
Abstract
BACKGROUND AND PURPOSE: Anoxic brain injury is a devastating result of prolonged hypoxia. The goal of this study was to use arterial spin-labeling (ASL) to characterize the perfusion patterns encountered after anoxic injury to the brain.
MATERIALS AND METHODS: Sixteen patients with a history of anoxic or hypoxic-ischemic injury ranging in age from 1.5 to 78.0 years (mean, 50.3 years) were analyzed with conventional MR imaging and pulsed ASL 1.0–13.0 days (mean, 4.6 days) after anoxic insult. The cerebral perfusion in each case was quantified by using pulsed ASL as part of the standard stroke protocol. Correlation was made among perfusion imaging, conventional imaging, clinical history, laboratory values, and outcome.
RESULTS: Fifteen of the 16 patients showed marked global hyperperfusion, and 1 patient showed unilateral marked hyperperfusion. Mean gray matter (GM) cerebral blood flow (CBF) in these patients was 142.6 mL/100 g of tissue per minute (ranging from 79.9 to 204.4 mL/100 g of tissue per minute). Global GM CBF was significantly higher in anoxic injury subjects, compared with age-matched control groups with and without infarction (F2,39 = 63.11; P < .001). Three patients had global hyperperfusion sparing areas of acute infarction. Conventional imaging showed characteristic restricted diffusion in the basal ganglia (n = 10) and cortex (n = 13). Most patients examined died (n = 12), with only 4 patients surviving at the 4-month follow-up.
CONCLUSION: Pulsed ASL can dramatically demonstrate and quantify the severity of the cerebral hyperperfusion after a global anoxic injury. The global hyperperfusion probably results from loss of autoregulation of cerebral vascular resistance.
Anoxic injuries resulting from global cessation of oxygenated cerebral blood flow (CBF) have profound effects on cerebral metabolism. Characteristic imaging findings include infarctions in regions with higher metabolic demands, including the basal ganglia and cerebral cortex.1–3 Arterial spin-labeling (ASL) perfusion imaging generates qualitative and quantitative data. ASL perfusion imaging findings in these patients have not been described in the literature. Xenon CT perfusion has been used to evaluate postresuscitation patients with mixed results.4–6 Other cerebral perfusion methods, such as nuclear medicine hexamethylpropyleneamine oxime single-photon emission CT and O-15 positron-emission tomography (PET), rely on differences in regional perfusion and may not detect a global symmetric hyperperfusion pattern.7 The goal of this study was to use ASL to characterize the perfusion patterns encountered after anoxic injury to the brain. We present a series of 16 patients with a history of anoxic injury who demonstrated marked cerebral hyperperfusion on pulsed ASL perfusion imaging. We propose that this marked hyperperfusion is secondary to the loss of autoregulation of cerebral vascular resistance caused by the anoxic injury.
Materials and Methods
Pulsed ASL was performed in 5000 consecutive clinical MR imaging examinations from December 2006 through January 2008. We retrospectively identified those patients with a discharge diagnosis or clinical history of hypoxic-ischemic or cerebral anoxic injury. Patient characteristics, including cerebral perfusion pattern, average gray matter (GM) CBF (in milliliters per 100 grams of tissue per minute), clinical history, laboratory data, and outcome were correlated with conventional imaging findings. The institutional review board at Wake Forest University approved this retrospective study.
Quantitative CBF maps were generated by using a Q2TIPS-FAIR sequence (second version of quantitative imaging of perfusion by using a single subtraction with addition of thin-section periodic saturation after inversion and a time delay sequence), as described previously.8 Briefly, this sequence generates 60 tag and control image pairs. Imaging parameters are as follows: TE, 28 ms; TI, 1800 ms; TI1s, 1200 ms; TI, 2000 ms; TR, 3000 ms; receiver bandwidth, 62.5 kHz; flip angle, 90°; FOV, 24 cm (frequency) × 18 cm (phase), an acquisition matrix 64 × 48 (11 sections; 8-mm thickness; 0-mm section gap), and frequency encoding direction anterior/posterior. The sequence was performed by using Signa Excite HD scanners (GE Medical Systems, Milwaukee, Wis) at field strengths of 1.5T and 3T. A diffusion gradient with an equivalent b-value of 5.25 mm2/s is added to suppress intra-arterial spins.9 Perfusion images were generated by using a fully automated data processing pipeline,10 including data transfer to network attached storage, conversion from DICOM to Neuroimaging Informatics Technology Initiative format, motion correction, tissue segmentation, flow quantification, creation of color JPEG CBF maps, conversion back to DICOM format, and insertion into the clinical PACS. These steps are performed by using distributed grid processing with the Sun Grid Engine (Sun Microsystems, Santa Clara, Calif). The images are corrected for motion and then subtracted to generate the relative perfusion signal intensity maps. The perfusion maps are segmented with SPM5 (statistical parametric mapping)11 based on the anatomic T1-weighted image (Fig 1) and then scaled by the mean signal intensity (M0) of blood. The segmentation and scaling step allows for voxel-wise computation of absolute CBF maps. The perfusion maps are colorized by using a standard scale, and a JPEG of the resulting image series is generated. The segmentation map is applied to the CBF data giving GM CBF quantification for the volume of acquisition, and the result is displayed on the JPEG image. Final grayscale perfusion images and the colorized JPEG images are automatically converted back to DICOM format and sent to the PACS for systemwide review.

Segmentation map obtained by using the T1-weighted image shows CSF (blue), white matter (red), and GM (green). The green areas are used for the mean GM CBF measurements.
For comparative purposes, average GM perfusion values were also obtained from a retrospective analysis of 2 age- and sex-matched control groups. Group 1 included 13 patients with an indication of stroke with normal conventional and perfusion imaging. Group 2 included 14 patients with an indication of stroke with acute infarcts on diffusion imaging. A one-way analysis of covariance (ANCOVA) was performed by using pulsed ASL (PASL) measures of global CBF in GM as the dependent measure, group (infarction negative, infarction positive, and anoxic injury) as the independent variable, and age as a covariate.
Results
The clinical features, laboratory values, and average GM perfusion values are listed in the Table. Sixteen patients (mean age, 50.3 years; range, 1.5–78.0 years) were identified with a history of anoxic injury. Nine patients had anoxic injuries outside of the hospital (n = 9), and 7 patients had anoxic injuries inside the hospital (n = 7). Only 5 patients had the duration of cardiopulmonary resuscitation documented (range, 30 seconds to 30 minutes). The average time between the anoxic episode and perfusion imaging was 4.6 days. Conventional imaging showed restricted diffusion in the basal ganglia in 10 patients and within the cortex in 13 patients (Fig 2). Partial pressure of carbon dioxide (Pco2) measurements obtained by arterial blood gas at the time of imaging averaged 38.6 mm Hg. Average GM CBF for the 16 patients was 142.6 mL/100 g of tissue per minute (± 36.2 mL/100 g of tissue per minute), ranging from 79.9 to 204.4 mL/100 g of tissue per minute. Twelve patients showed marked symmetric global hyperperfusion (n = 12; Fig 2). Three patients showed global hyperperfusion sparing previous areas of infarction (n = 3; Fig 3A, -B). One patient showed unilateral hyperperfusion (n = 1). Four patients survived, 1 remaining in a persistent vegetative state, 1 with severe encephalopathy, 1 with severe short-term memory loss, and 1 returning to baseline neurologic function. The patient who returned to baseline had the highest Pco2 measurement (54 mm Hg). The patients who survived had the least amount of diffusion abnormality. The remaining patients (n = 12) died within 1 month of perfusion imaging.

Axial diffusion-weighted, apparent diffusion coefficient (ADC), and quantitative CBF map from patient 2 shows the typical sequelae from anoxic injury, including diffuse bilateral symmetric restricted diffusion in the cerebral cortex (arrow) and the basal ganglia and thalami (arrowhead). The ADC image reflects the subacute nature of the ischemic change, because the imaging was done 9 days after the anoxic event. CBF map shows global hyperperfusion and the second highest average GM blood flow recorded in this study (190.6 mL/100 g of tissue per minute).

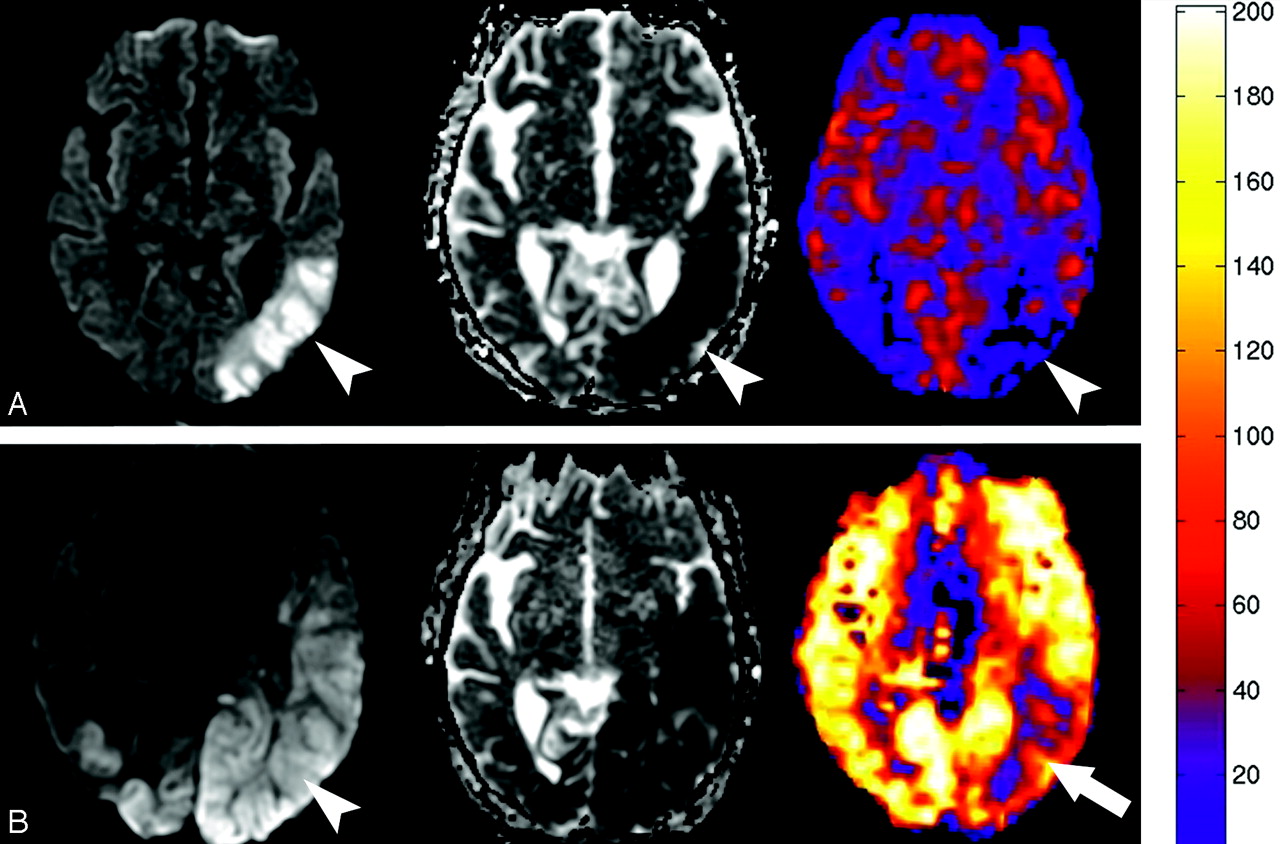
A, Diffusion, ADC, and quantitative CBF map generated from the PASL sequence obtained in patient 8 one day before the global anoxic event shows restricted diffusion and hypoperfusion in the left posterior watershed territory corresponding with areas of subacute infarction (arrowheads). B, Diffusion, ADC, and quantitative CBF map obtained 3 days after the episode of pulseless electrical activity in patient 8 shows interval worsening of the diffusion abnormality (arrowhead) with new marked global hyperperfusion. There is relative sparing of the previous subacute infarct in the left posterior MCA territory (arrow). Quantitative analysis performed by placing regions of interest over the entire section showed an average CBF increase from 31.4 to 188.6 mL/100 g of tissue per minute.
Clinical and imaging findings in 16 patients with anoxic injury
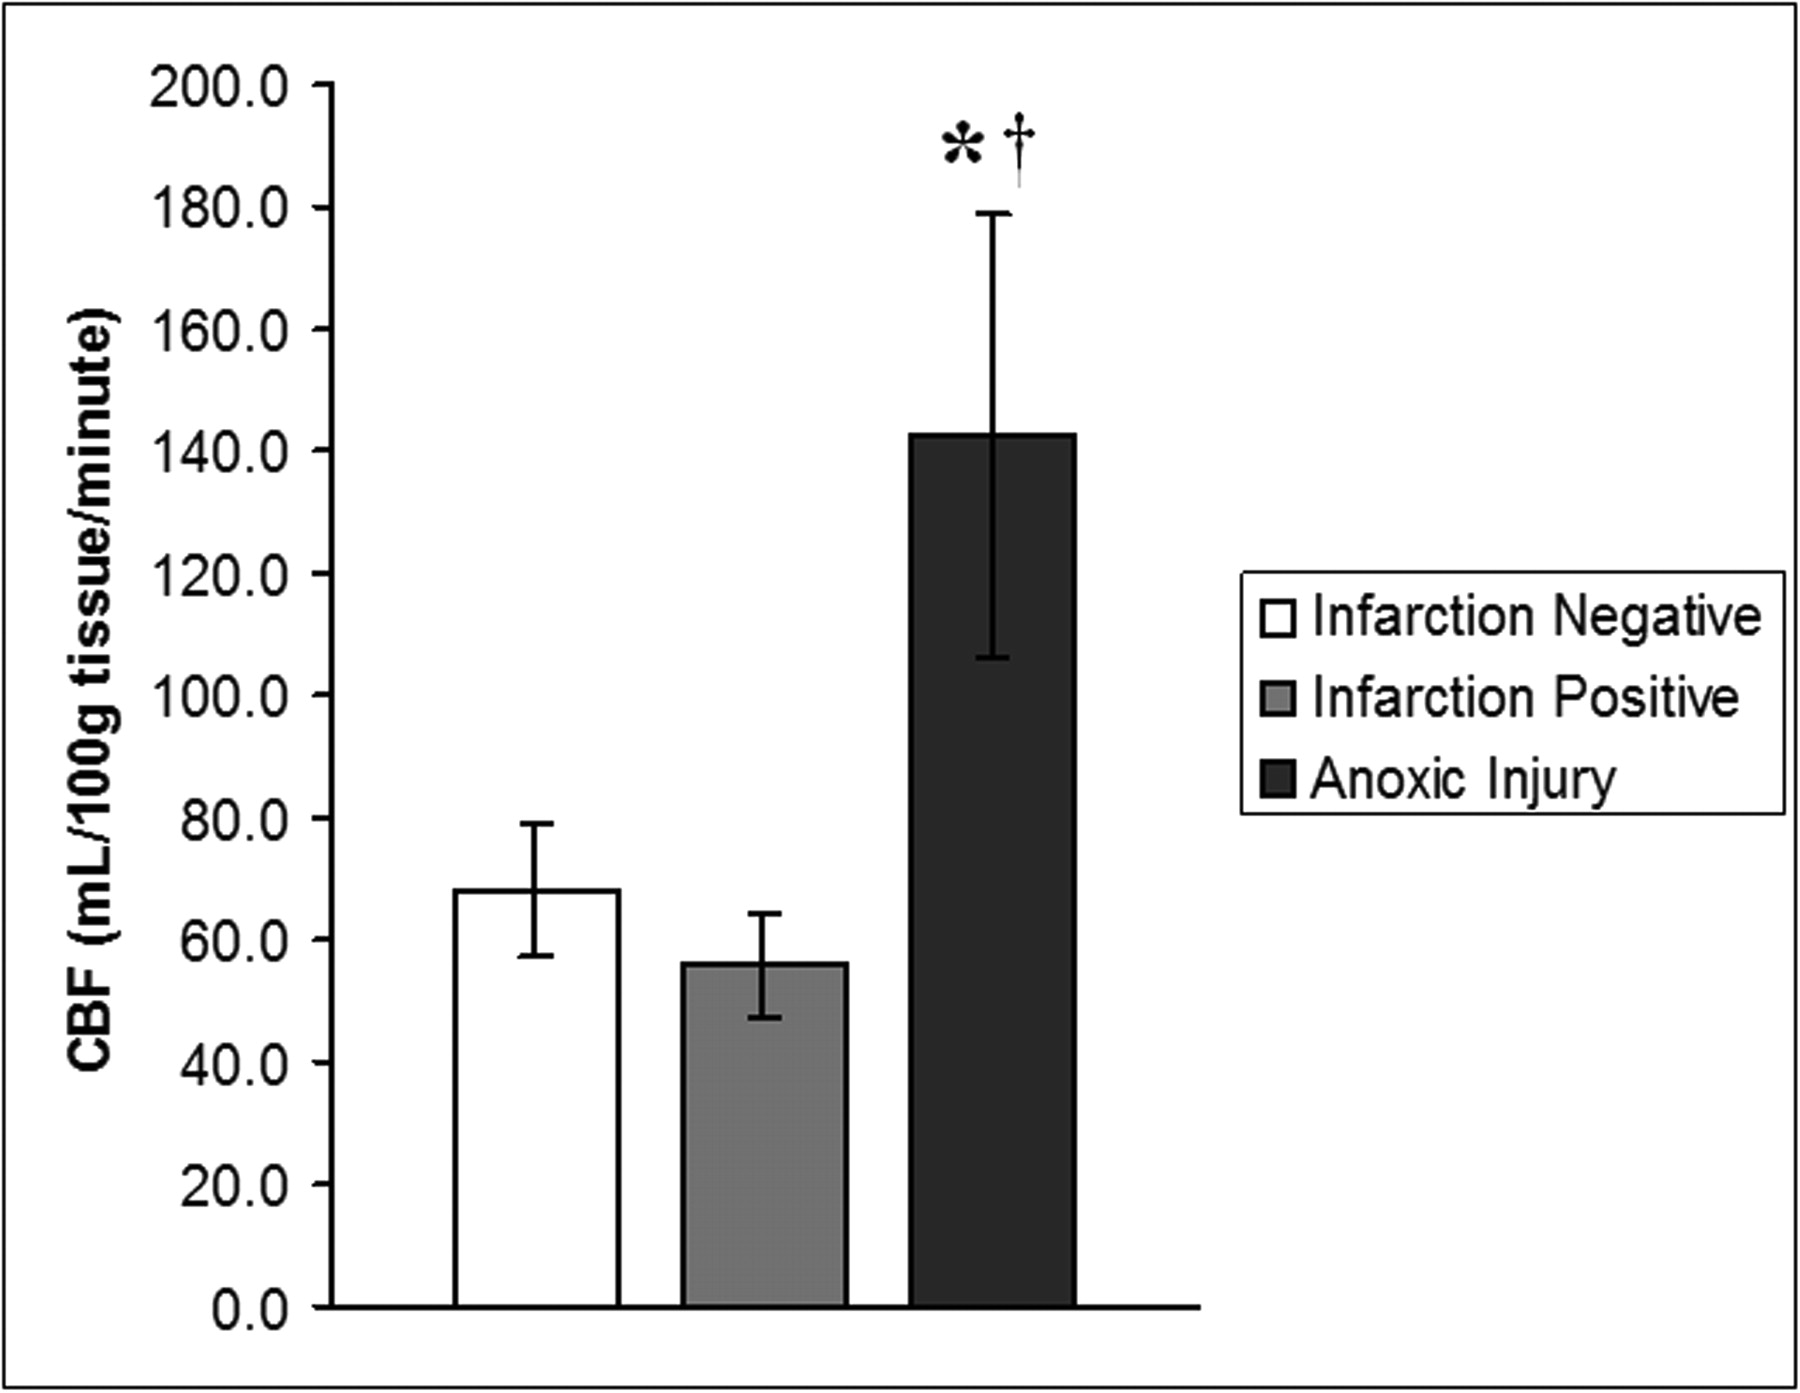
Group 1 (infarction negative) had a mean ± SD GM perfusion of 68.3 ± 10.9 mL/100 g of tissue per minute. Group 2 (infarction positive) had a mean ± SD GM perfusion of 56.1 ± 8.6 mL/100 g of tissue per minute. Group 3 (anoxic injury) had a mean ± SD GM perfusion of 142.6 ± 36.2 mL/100 g of tissue per minute. For rates of global CBF in GM, ANCOVA revealed a main effect of group, such that rates of global CBF in GM were significantly different between groups (F2,39 = 63.11; P < .001). More specifically, Bonferroni-adjusted post hoc analyses of between-group differences revealed rates of CBF to be significantly higher in the anoxic injury group compared with the infarction-negative (P < .001) and infarction-positive (P < .001) groups (Fig 4). There was, however, no statistically significant difference in global rates of CBF between the infarction-positive and infarction-negative control groups (P = .12).

Graph demonstrates rates of global GM CBF (in milliliters per 100 grams per minute), expressed as means ± SDs for 3 groups (infarction negative, infarction positive, and anoxic injury). Rates of global CBF in the anoxic injury group are 109% and 154% higher than rates of CBF in the infarction-negative and infarction-positive control groups, respectively. Data show a statistically significant difference between the anoxic injury and infarction-negative (*) groups and infarction-positive (†) groups. There was no statistically significant difference in global rates of CBF between the infarction-positive and infarction-negative groups.
Discussion
ASL perfusion MR imaging was first described over a decade ago12,13 and has been an active area of research.14,15 One advantage of ASL over conventional bolus tracking for perfusion measurement is that it provides absolute CBF information. Quantification of CBF facilitates the identification of cases with symmetric global perfusion abnormalities (Fig 2).
Causes of global cerebral hyperperfusion include etiologies that result in global vasodilation or loss of cerebral vascular autoregulation. Carbon dioxide is a potent vasodilator, and hypercapnia can cause transient vasodilation when cerebral perfusion autoregulation pathways are intact.16–19 This property has been exploited with tests, such as the hypercapnia challenge, to evaluate the cerebral vascular reserve.17 All of the patients in our series had normal arterial blood gas measurements except for case 6. Case 6 is a case of favorable outcome while showing global hyperperfusion. Previous studies have shown up to a 200% increase in CBF as Pco2 increases to values similar to case 6 (Pco2, 54).18–26 We believe that the global hyperperfusion in case 6 is a result of hypercapnia rather than anoxia.
Autoregulation of cerebral perfusion has been an active area of research.17,18,20,27–29 Autoregulation of CBF maintains the relationship CBF = CPP/CVR, where CPP is cerebral perfusion pressure and CVR is cerebral vascular resistance. As long as the cerebral arterioles can constrict and dilate to modulate CVR, they can accommodate a range of cerebral perfusion pressures and maintain constant CBF. When autoregulation is absent, CVR remains constant, and CBF is proportional to CPP, which is defined as mean arterial pressure minus intracranial pressure. Thus, when autoregulation is lost, CBF is proportional to mean arterial pressure.27–29
Several pathways have been hypothesized to account for autoregulation, including the myogenic response, neurogenic response, and the metabolic response, including the metabolites CO2, adenosine, potassium, nitric oxide, and calcium.17,27,28 Little human research exists regarding the effect of global anoxia on autoregulation.4,20,29–37 Animal models have shown a loss of cerebral vascular resistance in the postanoxic state resulting in uncontrolled hyperperfusion.38–42 Cerebral blood volume has been shown to increase with loss of autoregulation secondary to ischemia, but no large studies have demonstrated a similar relationship for CBF.43 Relative hyperperfusion has been shown in the thalamus, cerebellum, and occipital lobes with O-15 PET imaging in resuscitated patients; however, this method does not quantitate flow.36 Schaafsma et al36 believed this hyperperfusion was secondary to a “postanoxic disturbance of autoregulation.” We believe that a similar loss of autoregulation accounts for the cerebral hyperperfusion seen in our ASL patient series.20,36,38
Xenon-CT perfusion has been used to evaluate CBF after cardiac resuscitation. A study by Cohan et al4 showed an increase in global whole-brain CBF by up to 300% in nonsurviving patients. The CBF values obtained in the 6 patients who died in the Cohan et al study closely parallel the mean and range of our ASL data. Cohan et al showed, by using the fast flow compartment method, that the nonsurviving group mean cerebral perfusion was 145 mL/100 g of tissue per minute, ranging from 110 to 190 mL/100 g of tissue per minute.
A similar but less dramatic increase in cerebral perfusion was shown by Inoue et al5 by using serial xenon-CT perfusion studies during the week after the ischemic event. However, the values for CBF were significantly lower than the study by Cohan et al4 and were only hyperperfused relative to controls in patients who survived.5 A study by Nogami et al6 using xenon-CT perfusion 8–20 days after the hypoxic event showed a decrease in hemispheric CBF in patients with a severe disability, but also noted hyperperfusion within the putamen. This study was based on region-of-interest placement rather than global GM quantification. Given that several of the patients had cortical and laminar necrosis, there may have been an artificially decreased perfusion measurement if an area of infarction was selected for the region of interest.
The discrepancies between the xenon-based studies are probably multifactorial. Different methodologies, different time periods, (initial 48 hours, initial week, and from 8 to 20 days), technical factors, exclusion of nonsurvivors in 2 studies, small sample size of nonsurvivors (n = 6, Cohan et al4), and persistent vegetative state (n = 2, Inoue et al5, and n = 8, Nogami et al6) make it difficult to draw conclusions regarding the discrepancies between the xenon perfusion studies and the ASL data. Comparing the quantitative perfusion values between xenon and ASL is inconclusive, because 2 of the xenon-based studies used hemispheric perfusion values, whereas our ASL data were limited to GM perfusion. The xenon perfusion values and poor clinical outcomes (death) reported by Cohan et al4 most closely resemble our data with ASL.
Age has been shown to greatly affect cerebral perfusion, peaking at age 5–8 years.44,45 The quantitative nature of ASL allowed us to show that the 2 youngest patients in our series (1.5 and 11.0 years old) showed the highest average cerebral perfusion. We believe that normal age-related changes compounded the global hyperperfusion associated with the anoxic injury.
When a pattern of global cerebral perfusion is encountered in clinical practice, the radiologist should correlate the perfusion values with the patient's age, arterial blood gas measurements, conventional imaging, and clinical history. When the patient demonstrates global superphysiologic perfusion values, has no evidence of hypercapnia, and conventional diffusion imaging shows early associated infarctions of the basal ganglia and cortex,1 global cerebral anoxic injury should be strongly considered in the differential diagnosis.
It is unclear whether the global cerebral hyperperfusion pattern causes further microvascular damage or whether it serves some potential benefit. It is equally unclear whether pharmacologic regulation of this hyperperfusion through strict control of mean arterial blood pressure could have any significant benefit to the patient. With 12 of 16 normocapnic patients in our series dying within 4 weeks of perfusion imaging, it is clear that the natural course of anoxic-related cerebral injuries is devastating.2,35,36 Of the patients who survived in our series (n = 4), 1 patient was probably hypercapnic and returned to baseline function. The remaining survivors had unfavorable outcomes, including persistent vegetative state, severe encephalopathy, and profound short-term memory difficulties similar to those reported previously.36
Future trials with animal models may elucidate treatment strategies to preserve function and improve outcome. Recent animal models and clinical studies of global ischemia have shown promising neuroprotective effects of mild-to-moderate therapeutic hypothermia.46–49 Future potential studies with ASL may examine the effects of hypothermia and other treatment strategies on cerebral perfusion in the anoxic patient.
Conclusion
Global cerebral hyperperfusion secondary to irrecoverable loss of vascular resistance will be increasingly recognized as perfusion imaging is more widely clinically implemented. When global cerebral hyperperfusion is encountered, the short list of diagnostic considerations includes a normal young patient, hypercapnia, and anoxic injury. Correlation with conventional imaging, laboratory values, and clinical history should distinguish these entities. Currently the finding of global hyperperfusion associated with anoxic injury is an ominous sign and portends a poor outcome.2,4,20,50 The superphysiologic perfusion shown on ASL may open a door to further research opportunities aimed to improve outcome and establish treatment guidelines for global anoxic injuries.51
Acknowledgments
We thank Kathy Pearson for help with computer programming. We also thank Becky J. Mussat-Whitlow for reviewing the statistical data.
Footnotes
This work was supported by the Human Brain Project and the National Institute of Biomedical Imaging and Bioengineering through grants EB004673 and EB004673-02S2. This work was also partially supported by the Center for Biomolecular Imaging of Wake Forest University School of Medicine.
References
- Received November 30, 2007.
- Accepted after revision February 6, 2008.
- Copyright © American Society of Neuroradiology
In this issue


Jump to section
Related Articles
Cited By...
- Anoxic Brain Injury Detection with the Normalized Diffusion to ASL Perfusion Ratio: Implications for Blood-Brain Barrier Injury and Permeability
- Arterial Spin Labeling Perfusion Magnetic Resonance Imaging Performed in Acute Perinatal Stroke Reveals Hyperperfusion Associated With Ischemic Injury
- Medial Occipital Lobe Hyperperfusion Identified by Arterial Spin-Labeling: A Poor Prognostic Sign in Patients with Hypoxic-Ischemic Encephalopathy
- Brain Perfusion in Encephalopathic Newborns after Therapeutic Hypothermia
- Thalamocortical Dysfunction and Thalamic Injury after Asphyxial Cardiac Arrest in Developing Rats
- Novel MRI Approaches for Assessing Cerebral Hemodynamics in Ischemic Cerebrovascular Disease