
Abstract
BACKGROUND AND PURPOSE: Diffusion tensor imaging (DTI) of the spinal cord in patients harboring spinal arteriovenous malformations (AVMs) was carried out to evaluate the feasibility of this new technique to determine the displacement of the spinal cord tracts and to correlate morphologic and functional DTI data (fractional anisotropy [FA] and apparent diffusion coefficient [ADC]) with the clinical symptoms.
MATERIALS AND METHODS: Nine patients with spinal cord AVMs were investigated at 1.5T using a sagittal spin-echo single-shot echo-planar generalized autocalibrating partially parallel acquisition diffusion-weighted imaging sequence. ADC and FA maps were computed in different regions of interest (both above and below the nidus), and tractography was used to visualize the course of the tracts. The data were correlated with the clinical symptoms and compared with 12 healthy control subjects.
RESULTS: At the level of the nidus, tracts were normal, shifted, separated, or interrupted but not intermingled with the nidus. Interruption of the tracts was coherent with the clinical symptoms. In patients with severe neurologic deficits, FA values caudal to the nidus showed a reduced anisotropy consistent with loss of white matter tracts.
CONCLUSIONS: We demonstrate that AVMs may interrupt, displace, or separate the fiber tracts and that clinical symptoms may be reflected by the quantitative FA results and the morphologic loss of fibers distant to the lesion. DTI with fiber tracking offers a novel approach to image spinal cord AVMs and may open a window to understand the complex pathophysiology of these lesions.
In recent years, many studies concerning MR diffusion tensor imaging (DTI) and fiber tracking have been published concerning both the normal aspect and various pathologies in the brain, including brain arteriovenous malformations (AVMs).1 Concerning the spinal cord, this MR technique is more difficult to apply because of the following: 1) the small volume of the spinal cord compared with the brain, 2) difficulties in obtaining a homogeneous magnetic field inside the spinal canal, and 3) susceptibility artifacts related to the echo-planar imaging (EPI) technique used typically. Therefore, there is paucity of data concerning spinal cord DTI.2–5 Studies reported thus far describe DTI findings in compressive disease, chronic myelopathy, and multiple sclerosis.6–8 However, DTI has not yet been reported in vascular malformations affecting the spinal cord. AVMs of the spinal cord may give rise to an increase of the extracellular water because of venous congestion and/or a loss of white matter fibers (eg, because of wallerian degeneration after hemorrhage) in the normal-appearing cord distant to the nidus.9,10 To further differentiate the above-mentioned possible effects of spinal cord AVMs on the white matter, it appears appealing to use DTI because its principle is based on the anisotropic diffusion of extracellular water molecules11,12 within the anisotropic environment of white matter fibers.
One purpose of this study was to analyze the quantitative results of the apparent diffusion coefficient (ADC) and the fractional anisotropy (FA) that were measured both cranial and caudal to the nidus to evaluate whether these data can give information on the complex pathophysiology of spinal cord AVMs. Apart from hemorrhage, spinal vascular malformations can lead to neurologic deficits via various pathologic mechanisms, including venous congestion and mass effect.10,13 For a particular AVM, however, it is not known which of these pathologic mechanisms is the most relevant one, though this information might affect the therapeutic approach (ie, partial targeted endovascular treatment for compartments likely to rehemorrhage, endovascular flow reduction to treat venous congestion, or reduction of size of venous pouches to treat the mass effect).14 We hypothesize that the quantitative data could shed light on the pathologic mechanism to be encountered in a particular AVM, because, for example, mass effect may lead to an increase in anisotropy (because of compression of fibers),15 whereas cord edema because of venous congestion may lead to a decrease (because of separation of fibers).16 The main goal of the study, however, was to evaluate the feasibility of this new technique to determine the displacement of the spinal cord tracts and to correlate morphologic and functional DTI data (FA and ADC) with the clinical symptoms.
Materials and Methods
Subjects
Twelve patients with spinal cord AVM referred to our institution for endovascular treatment by transarterial embolization between March 2003 and December 2004 underwent MR imaging before treatment. Three patients were excluded from the present series: 1 because of previous surgery of the spinal cord and 2 because of excessive movement artifacts during scanning. The remaining 9 patients (5 male and 4 female patients) had a mean age of 23.7 years (range: 13–57 years). Clinical and demographic data are described in Table 1. The mean time elapsed between the onset of symptoms and MR examination was 25.7 months, ranging from 3 months to 8 years. Three patients were referred to us less than 6 months after the onset of symptoms. Six patients had an acute onset of symptoms (<48 hours), and 3 presented with chronic progressive symptoms. In 1 patient (patient 3), 2 previous embolization sessions had been performed 4 and 3 years before DTI imaging, respectively; in the other patients, no previous embolization had been performed.
Clinical data
The severity of the symptoms was evaluated with the clinical functional score that was described previously by McCormick et al.17 In this grading system, grade I is designated to patients whose neurologic examination is normal or who demonstrate a mild deficit without impairment of the function of any limb. In patients at grade II, sensorimotor deficits of limbs and/or severe pain and/or sensory deficits responsible for an impairment of the quality of life but compatible with independent and self-sufficient walking are present. Grade III is characterized by severe sensorimotor deficits of the inferior limbs or disabling sensorimotor deficits of the superior limbs. In grade IV, patients have deficits that render them totally dependent.17 Three patients had none or a mild deficit (grade I), 4 patients had a deficit resulting in a decrease in the quality of life (grade II), and 2 patients had a deficit resulting in total dependence in activities of daily living (grade IV). These latter 2 patients (patients 2 and 7) were found to have had a hemorrhagic event, as assessed by the combination of clinical and imaging data. As our routine imaging protocol before embolization included MR imaging, we did not deem it necessary to obtain ethics committee approval to add the DTI sequence; however, informed consent by all of the patients and institutional review board approval for chart and record review were obtained.
MR Imaging Technique
Imaging was performed on a 1.5T MR imaging system with actively shielded magnetic field gradients (maximum gradient: 40 mT/m). The protocol began with conventional sequences: acquisition of a T2-weighted coronal scout followed by a sagittal T2-weighted fast spin-echo (SE) sequence (FOV: 30 × 30 cm; image matrix: 640 × 384; section thickness: 3 mm; TR/TE: 4370 ms/119 ms), a sagittal T1-weighted SE sequence (FOV: 30 × 30 cm; image matrix: 576 × 346; section thickness: 3 mm; TR/TE: 400 ms/12 ms), and an axial T2-weighted gradient-echo sequence (FOV: 20 × 15 cm; image matrix: 256 × 134; section thickness: 4 mm; TR/TE: 1330 ms/27 ms).
DTI was performed using a sagittal SE single-shot echo-planar generalized autocalibrating partially parallel acquisition (GRAPPA) diffusion-weighted imaging sequence with a 2-fold acceleration factor; 2 b values (b = 0 and 500 s/mm2) along 6 noncolinear gradient directions (DTI6d) for patients 2, 4, 6, 7, 8, and 9 and along 25 directions (DTI25d) for the remaining patients (1, 3, and 5) were applied18,19 (FOV: 17.9 × 17.9 cm; image matrix: 128 × 128; 12 sections with section thickness of 3 mm; nominal voxel size: 1.4 mm × 1.4 mm × 3 mm; TR/TE: 4600 ms/73 ms for both DTI25d and DTI6d; the acquisition number was 6). Patients were asked to avoid swallowing and moving the head and limbs during diffusion-weighted imaging.
Image Analysis
Image analysis was performed on a voxel-by-voxel basis by using dedicated software (DPTools, http://www.fmritools.org). In addition to the 2D parametric FA color maps, 3D white matter fiber tracts were created using the principal diffusion directions method20–22 after oversampling and interpolation of the DTI dataset (n = 1 for 6 directions; n = 10 for 25 directions). In the principal diffusion directions method, the eigenvector corresponding with the largest eigenvalue is extracted from the diffusion tensor field generated from the DTI datasets in the region where the diffusion is linear, typically for a FA thresholding value of 0.18 and an angulation threshold of 45° (to prevent fibers from sudden transition and to keep tracking based on the connectivity of the neighborhood), as described previously.6,20–22
When morphologically analyzing the fiber tracking (FT), we qualitatively described the tracts as normal, as defined previously,6 shifted, separated, or interrupted (partially, ie, across parts of the axial plane, or completely, ie, across the entire axial plane). Concerning quantitative data, we made measurements on the FA and ADC maps. We placed regions of interest (ROIs) centrally within the cord to avoid partial volume effects with the CSF using a technique described previously6 (Fig 5). As specified in Table 2, we tried to locate the ROIs for all of the subjects cranial and caudal to the nidus. However, in practice, we had to individually tailor the ROI location for each patient. In 2 patients, the AVM nidus was located at the cervicomedullary junction; therefore, measurements cranial to the nidus were not feasible; in 1 patient, measurements caudal to the nidus were not possible, because the FOV was too small. Because in some subjects, T2 abnormalities were present, whereas in others, the cord appeared normal, we placed additional ROIs in the area of T2 hyperintensity and in the normal-appearing cord (Table 2). Measurements at the level of the nidus were only possible in a single subject, otherwise, quantitative measurements at the level of the nidus were not feasible because of susceptibility artifacts, thrombosis, glue artifacts, enlarged venous pouches, residua of old hemorrhages, or small volume of the residual cord. If the T2 hyperintensity had ill-defined margins with concomitant swelling of the cord, venous congestion was presumed to be the cause of the hyperintensity compared with gliosis or nonspace-occupying syringohydromyelia if the margins were well delineated and the volume of the cord was normal or decreased, a state that we will further refer to as “cavitation.”
FA and ADC values, qualitative assessments, and angiomorphology in the 9 investigated patients
Statistical Analysis
We used the method of Z-scores to compare the values of the patients with those of 11 healthy volunteers (8 men and 3 women; mean age: 36.7 years; range: 20 to 67 years) who were investigated with the same imaging protocol.6 Their FA and ADC values were 0.748 with a range of 0.7 to 0.8 for FA and 1.00 10−3 with a range of 0.77 to 1.25 10−3 for the ADC. FT showed the main white matter tracts (posterolateral corticospinal tracts and posterior lemniscal tracts) in all of the volunteers. The values of the AVM were considered abnormal when not included in the 95% confidence interval [Z-score > 2, Z = (x−μ)/σ, with x = value, μ = mean, and σ = SD] of the healthy volunteers.
Results
The most illustrative cases are reported in Figs 1-6 and show mainly the morphologic aspect of the fiber tracts compared with conventional MR imaging and digital subtraction angiography findings. In the following, we detail both the FT and the quantitative data of DTI in comparison with morphologic and clinical data.

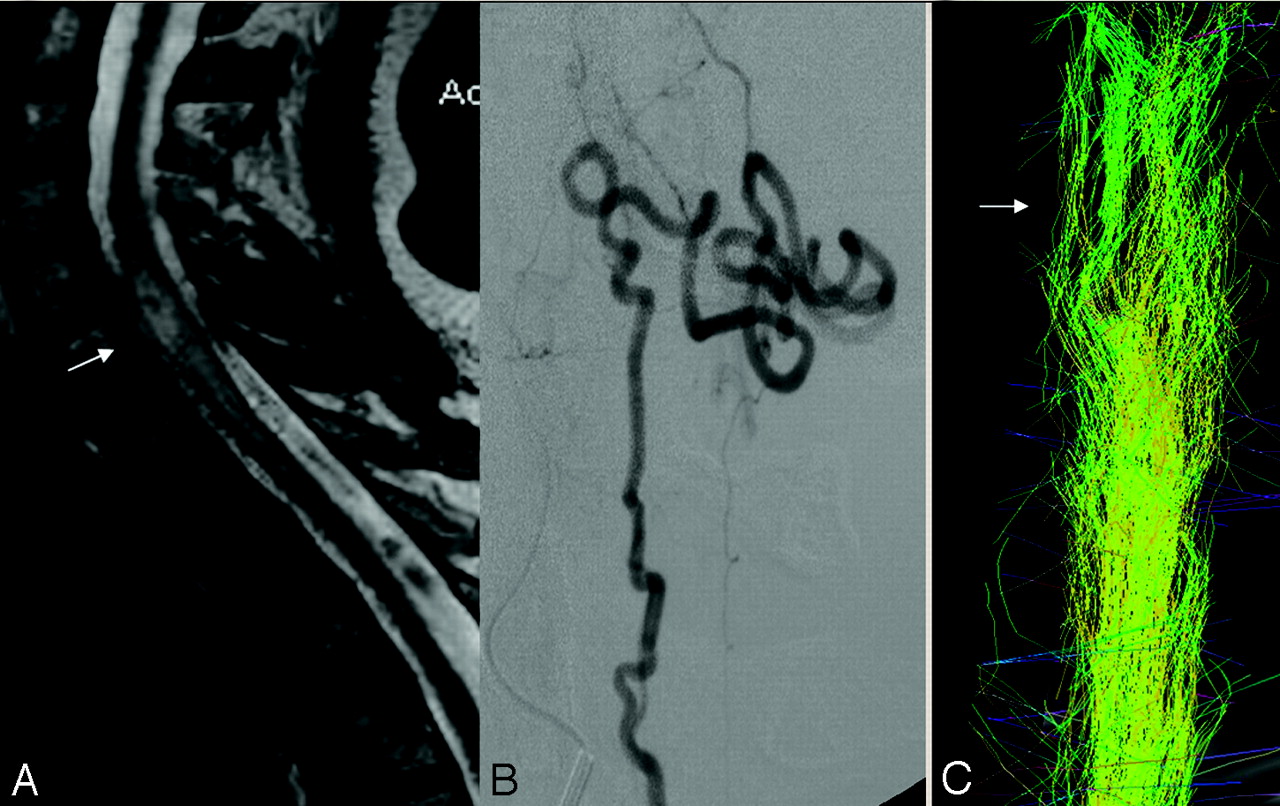
Venous congestion of the spinal cord and separated tracts (patient 1, DTI25d). This 57-year-old woman presented with a 2-year history of progressive paresthesia in the bilateral lower limbs, followed by further development of leg weakness and sphincter problems. The McCormick score was II. A pial arteriovenous fistula that was fed by the lateral spinal artery arising from the left posteroinferior cerebellar artery was found.
A, T2-weighted images showed enlargement of the spinal cord at the C6 level with hyperintensity reflecting local venous congestion (arrow).
B, There was a dilated vessel at the anterior surface of the cord, which corresponded with a vein draining the shunt caudally, as depicted on selective injection during angiography.
C, Posterior view of the FT25d showed separated fascicles at the level of C6 (arrow), with global enlargement of the beam of tracts. The remaining fibers were grouped together into fascicles. By counting the tracts at the level of the congestion (674) and below it (741; ratio: lesion level/caudal to lesion = 0.91), we were able to show that there was no evidence of focal interruption of the tracts.
DTI Results in Relation to the MR Morphology
At the level of the nidus, the fibers were separated, shifted, interrupted, or normal compared with the morphology of fibers in healthy control subjects. No fibers running through the nidus itself could be detected, comparing the results of the FT data with the conventional imaging data.
Distant to the nidus, congestive edema was present in 1 patient: FT25d showed separated fascicles, with global enlargement of the beam of tracts. There was a slight rarefaction of tracts (Fig 1). We found significantly decreased FA (0.42/Z = −11.83) and normal ADC values (0.955 10−3/Z = −0.34).
Cranial or caudal to the nidus, a cavitation as explained above was present in 3 patients (Figs 2 and 5). FT demonstrated a loss of tracts with global thinning of the beam. The remaining tracts were still grouped into fascicles and were separated from the midline. A significantly decreased mean FA of 0.42/Z = −11.7 (FA range: 0.36–0.50) and a normal mean ADC of 1.13 10−3/Z = 1.02 (ADC range: 0.79–1.45 10−3) were found.

Cavity in the cord: thinning of the beam of tracts and separated tracts (patient 2, DTI6d). This 29-year-old woman presented to our service 3 months after she had experienced a sudden complete paraplegia. Subsequently, no clinical improvement was noted.
A–C, The T2-weighted (A and B) and T1-weighted (C) morphologic sequences showed a central cavity within the thoracic cord, an AVM nidus located at T5, and dilated perimedullary vessels mainly cranial but also caudal to the nidus. There was only a moderate enlargement of the cord, which may have been because of the mass effect of the venous pseudoaneurysm.
D, Anteroposterior view of the angiogram showed the venous drainage of the arteriovenous shunt. There was a venous false aneurysm at the level of the nidus that was partially thrombosed as depicted on MR imaging (hyperintensity on both T1 and T2) and surrounded by hemosiderin (hypointensity on T1 and T2), indicating a previous hemorrhage, responsible for her initial symptoms.
E, Posterior view of the FT6d caudal to the nidus (arrow) showed a global thinning but no interruption of the beam of tracts at the level of the cavity in comparison with the normal size of the white matter tracts at C7 (double arrows). The tracts were separated from the midline but still grouped into fascicles.
In the segments of the cord distant to the nidus without T2 hyperintensity where draining veins were present, FA values were marginally decreased compared with those segments where no draining veins were visualized. DTI in normal-appearing cord above and below the nidus and distant to the T2 hyperintensity also showed slightly lower FA values in the group of patients compared with the normal cord of healthy volunteers (mean FA: 0.64 Z = −3.7), whereas the ADC was normal without statistically significant differences between both groups.
DTI Results in Relation to the Clinical Symptoms
In addition to the above-mentioned correlations of FA and ADC results to MR imaging data, we also performed a correlation with the clinical symptoms. At the level of the nidus, 1 patient with a severe neurologic deficit (McCormick IV) who became symptomatic because of a spinal hemorrhage had a complete interruption of the tracts (Fig 6). Five patients had partially interrupted tracts (Figs 3 and 5): 4 of them had a score of McCormick I or II without any obvious previous hemorrhage; the fifth had a more severe clinical score (McCormick IV) and a previous hemorrhage. In 2 patients, the tracts were separated but not interrupted at the level of the nidus, and the clinical score was good (McCormick I and II, respectively). In 1 patient, the tracts were shifted without focal interruption, and the clinical status was normal (Fig 4).

Nidus and segmental interruption of tracts (patient 3, DTI25d). A 23-year-old man presented with bilateral upper limb paresthesia, predominantly on the right side with a sensory deficit. MR imaging showed edema of the cervical spinal cord around the cervical AVM nidus at C2-C3, without any sign of hemorrhage. Angiography revealed a nidus inside the right hemicord, posteriorly located, fed by the pial network arising from the right vertebral artery. First embolization was followed by a clinical improvement of the right upper limb and regression of the T2 hyperintensity on MR imaging. A second session of embolization was performed 1 year later.
A, The third (and last) angiogram performed 3 years 9 months after the onset of the symptoms was not followed by embolization.
B, MR imaging performed at that time with DTI showed T2-hyperintensity inside the inferior part of the nidus corresponding with the embolized part of the nidus.
C, FT25d showed segmental interruption of the tracts of the right posterior column (arrowhead) as could be verified by counting the tracts at the level of the lesion (681) and below it (1017; ratio: lesion level/caudal to lesion = 0.67). The remaining tracts of the lateral column and the midline were slightly shifted showing a mild mass effect on the midline.

Nidus at the surface of the cord shifting the tracts (patient 5, DTI25d). A 14-year-old boy presented 4 months after he experienced a sudden paraplegia, which secondarily completely resolved (McCormick I).
A–C, MR imaging showed a nidus located close to the right surface of the thoracic cord, at the level of T8-T9. On these T2-weighted images, no hyperintensity of the cord was visualized.
D shows the anisotropy that, because of the small remaining volume of the cord at that level, cannot be determined.
E demonstrates displacement of the beam of fibers to the right without focal interruption (FT25d). Distal to the nidus, the fibers seem to be more separated compared with the proximal part, which may indicate an increased water content of the cord that is not yet visible on T2-weighted images as edema, which in fact suits the decreased FA values that were found in this area (Table 2).

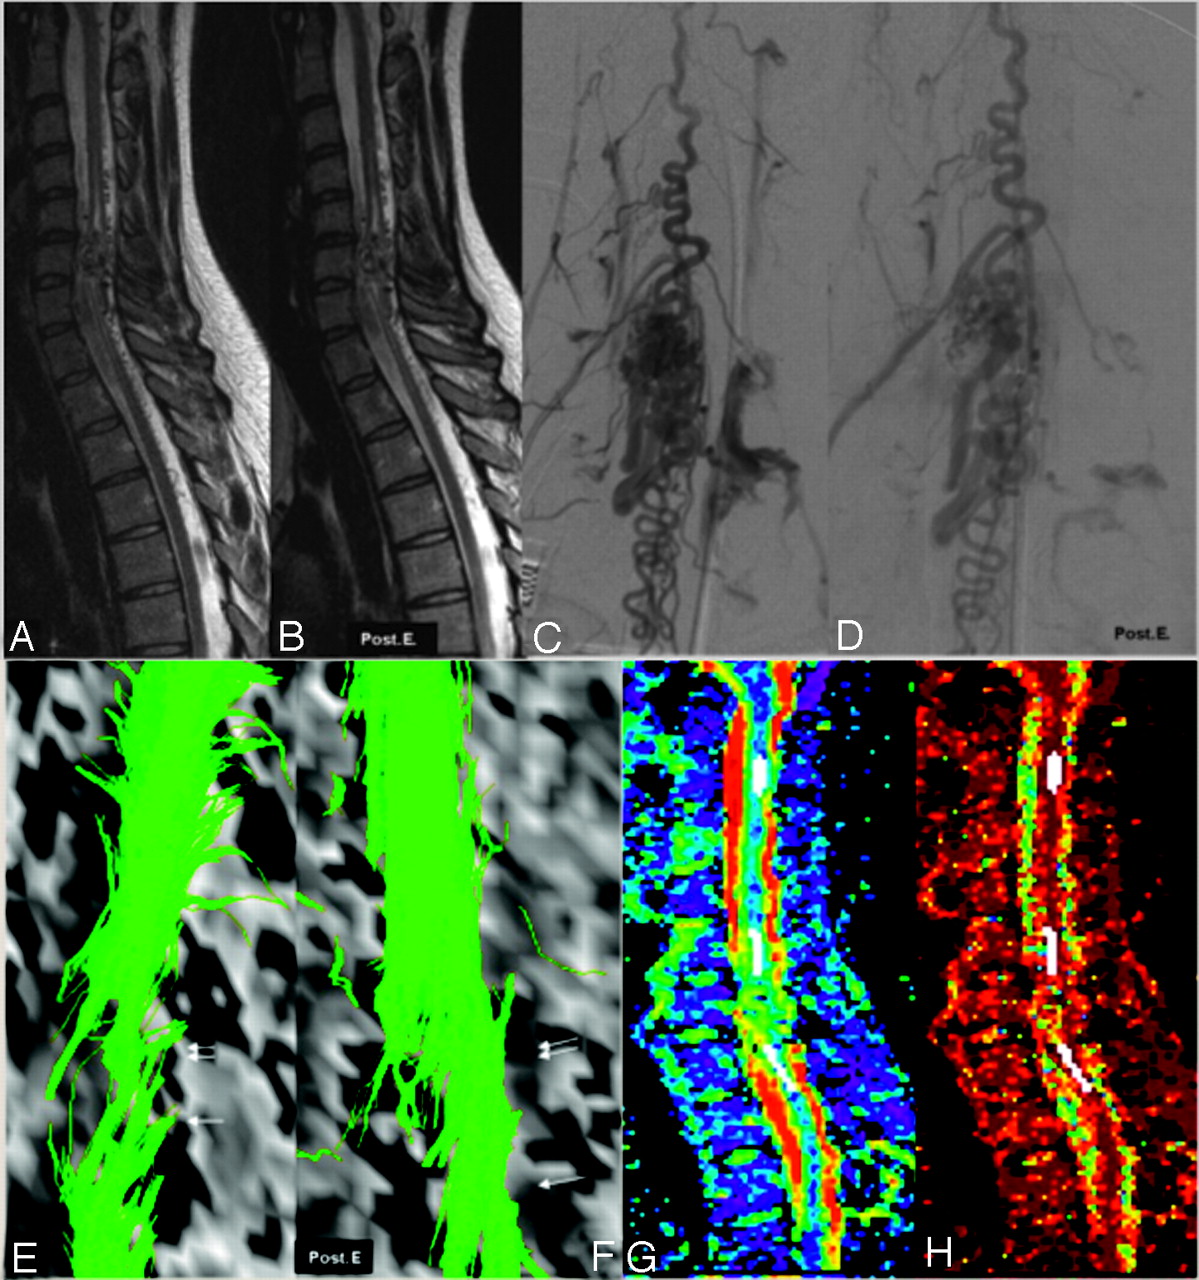
Increase of the tracts (FT6d) after embolization (patient 6, DTI6d). A 21-year-old woman with cervical spinal cord arteriovenous malformation first presented with a sudden tetraplegia when she was 12 years old. The neurologic status gradually improved (the McCormick score was grade I at the time of referral to our hospital). MR imaging, angiograms, fiber tracking before (A, C, and E) and after embolization (B, D, and F), and FA and ADC images (G and H) are shown.
At the level of the nidus (arrow), located within the cord, there was partial discontinuity of the tracts (E). Above and below the nidus, conventional T2-weighted images (A,B) showed a central cavity in the cord. Here, FT6d showed both a global thinning of the beam (double arrow in E) and separated tracts around the central cavity. When we compared the evolution after embolization, angiography demonstrated decrease of flow inside the nidus and the draining veins (D). T2-weighted images did not show any modification of the appearance of the perinidal cord. The FT6d showed (F) an increased number of tracts at the level (arrow) and just above (double arrow) the nidus, presumably due to a reduction of venous congestion with concomitant higher FA values and therefore better visualization of fiber tracts. Panels G and H demonstrate the FA values and the ADC map with the ROI placements (white areas) at 3 different levels.

Hemorrhage in the spinal cord (patient 7, DTI6d). An 18-year-old male patient presented with a sudden paraplegia because of hemorrhage in a thoracic AVM. When he was admitted 3 months later, the neurologic status was the same (McCormick IV).
A, MR imaging showed a nodular heterogeneous signal intensity inside the thoracic cord at the T2 level, corresponding with the point of bleeding.
B, The cord hemorrhage was located in the vicinity of the nidus that harbored an associated arterial aneurysm in the anterior sulcus of the cord with concomitant mass effect on the anterior spinal artery (arrow). An associated T2 hypointensity corresponding with hemosiderin was located at the anterior part of the cord and spread cranially to the midbrain and caudally to T4 level.
C, FT6d showed an interruption of all of the tracts at the T2-level (arrow), presumably because of susceptibility artifacts related to hemosiderin.
Under the assumption that FA and ADC in the normal-appearing cord caudal to the nidus may be altered because of the AVM, we investigated quantitative DTI results caudal to the cord. Four patients had a good clinical score (McCormick I). In these patients, the FA values were normal compared with the group of healthy control subjects (mean FA: 0.74/Z = 0.51), whereas the ADC values were slightly decreased (mean ADC: 0.849 10−3/Z = −1.0). Patients with neurologic symptoms had decreased FA values, both compared with the group of healthy volunteers and with the group of patients with good clinical scores. Three patients with a score of II had a mean FA of 0.68 (Z = −2.5), whereas ADC values were similar compared with patients with a score of I (mean ADC: 0.861 10−3/Z = −1.0). In the 2 patients with severe neurologic impairment (McCormick IV), FA values caudal to the AVM could be measured for technical reasons in only 1 patient. In this patient, the decrease in FA values found caudal to the nidus in the normal-appearing cord was most pronounced with a mean FA of 0.55 (Z = −6.8), whereas ADC values were normal (mean ADC: 1.014 10−3; Z = −0.11).
Quantitative DTI results in the normal-appearing cord were also investigated with regard to the duration of symptoms. However, here we found no difference between the group of patients who were imaged with a longer latency and the patients imaged in close temporal relation to their symptom onset.
Discussion
Background
Spinal cord AVMs are usually diagnosed by conventional MR imaging showing an intramedullary nidus and dilated perimedullary draining veins.9,23,24 MR imaging can also depict potential complications of AVMs, such as hemorrhage (hematomyelia or subarachnoid hemorrhage) or venous congestion because of altered venous drainage. This congestive edema of the spinal cord may extend over multiple segments and is due to an increase of interstitial water. Chronic venous congestion leads to slowly progressive neurologic symptoms and spinal cord atrophy. In patients with hematomyelia, AVMs may lead to variable neurologic deficits resulting from direct damage to the gray and white matter.10 Endovascular treatment by transarterial embolization with glue is aimed first at excluding those parts of the nidus that harbor identifiable angioarchitectural risk factors, such as intranidal false aneurysms or drainage into venous ectasias or stenosis. A second goal is to reduce the flow in the nidus and subsequently in the draining veins to decrease the venous congestion.25 MR imaging performed after embolization may, therefore, show complete regression of the T2 hyperintensity. Our series of 9 patients with spinal cord AVM investigated with DTI presented with various clinical and imaging findings in terms of the presence of hemorrhage, venous congestion, and the time elapsed between the onset of the symptoms and the admission. Although this group of patients allows us to evaluate the use of DTI in a wide variety of different pathologic mechanisms present in AVM, it makes the investigated group of patients rather heterogeneous. Still, there were certain characteristic findings that warrant further discussion.
DTI at the Level of the Nidus
At the level of the nidus, FT may give additional information compared with the conventional morphologic MR images. As could be demonstrated in our series, the morphologic aspects of the fiber tracts could be demonstrated in all 9 of the patients, though the exact delineation among the nidus, the intrinsic draining veins, and the white matter was difficult to perceive because of low spatial resolution. In most patients, FT did not show focal interruption of tracts at the level of the nidus. This is coherent with the notion that an AVM, being in the subarachnoid or subpial space, does not “infiltrate” the normal spinal cord but in fact displaces or separates the fiber tracts. For brain AVMs, this has been recently illustrated by Maruyama et al,26 who, by using FT, were able to show that corticospinal tracts in patients with rolandic AVMs are separated or displaced, but there are no tracts running through the vascular malformation. In our series, continuous tracts were correlated with a good clinical status. If interruption of tracts was present, clinical symptoms corresponded with the interrupted tract (Fig 3: patient with loss of sensation and interrupted posterior white matter fibers). The cause of the interruption of the tracts may be because of one of the following: 1) the real loss of white matter fibers; 2) magnetic susceptibility artifacts because of the hemoglobin degradation products, the nidus, or the draining veins; or 3) an increase of free water in the vicinity of the nidus with subsequent decrease in anisotropy. When the nidus was not located inside the cord but close to its surface, the added value of the FT was not so evident, because T2 sequences could already demonstrate sufficiently the shifted cord distinct from the nidus. Still, FT was able to demonstrate the continuity of white matter bundles that were shifted by the nidus. For those patients who did not present with hematomyelia, there was no obvious discordance between the clinical data and the appearance of the tracts (preserved, shifted, or interrupted) at the level of the nidus as depicted by FT. Problems of FT arise, however, in patients with hemorrhage, because the interruption of tracts may be the consequence of susceptibility artifacts because of hemoglobin degradation products and may not be related to damage of the white matter from the hematomyelia. Furthermore, susceptibility artifacts from thrombosed pouches, pulsation, and flow artifacts render FT difficult to interpret. Evaluation of routine anatomic sequences in addition to FT images is, therefore, recommended.
DTI in Venous Congestion
In the single patient who presented with venous congestion, we were able to show that the tracts were heterogeneously separated and grouped into fascicles that may correspond with the anatomic fascicles. Two mechanisms may explain this aspect: a heterogeneous loss of white matter fibers predominating at the periphery of the white matter fascicles or a heterogeneous repartition of the increase of water in the interstitium related to the angioarchitecture of the intrinsic vascular network.
DTI is mainly based on the directed diffusion of extracellular water and is related to the interaction between the white matter fibers and the extracellular water.27 During venous congestion, the increase in extracellular water will, therefore, lead to a decrease of the FA while the fibers are still intact. FA is more sensitive than SE sequences to detect an increase of water, as Facon et al6 had already reported in compressive pathology of the spinal cord. Depending on the intensity and the duration of the congestion, however, white matter fibers may become irreversibly damaged over time, leading to a further decrease of FA values. Because there has been only 1 patient in our series presenting with venous congestion distant to the nidus, our results have to be interpreted with caution. More patients, especially those with early or mild venous congestion, need to be studied to further assess the effect of venous congestion on FT.
DTI in Cavitation
In patients presenting with sharply delineated T2 hyperintensities of the central spinal cord representing either gliosis or nonspace-occupying syringohydromyelia, FT showed a global thinning of the beam. We presume that this thinning is related to a true decrease of the white matter bundles in the vicinity of the lesion as shown by the concomitant decrease of the size of the cord on T2-weighted images. The decrease in FA at these levels further confirms the loss of fibers, whereas the normal mean ADC speaks in favor of a gliosis instead of a syringohydromyelia as the most probable morphologic substrate of the observed imaging findings. Nevertheless, quantitative data must be interpreted with caution because of limited spatial resolution of DTI with subsequent partial volume averaging within our longitudinal ROIs. The measurement with the ROI that we applied cannot distinguish between the different compartments of the spinal cord (ie, gray and white matter) depicted in high-resolution axial sections. Higher field strengths are necessary to overcome this problem, as shown in animal studies at 7T, where the FA values for normal gray and white matter are 0.59 and 0.92, respectively.28 Because we placed our ROIs in the sagittal plane, both white and gray matter areas are likely to be averaged in various and unknown proportions for different patients, thereby affecting the quantitative results considerably.
DTI Findings Related to Clinical Aspects
Caudal to the nidus within the normal-appearing cord, we were able to show a decrease of FA values in patients with poor clinical scores compared with both patients with good clinical scores and the group of healthy control subjects. These findings may be related to the loss of fibers because of wallerian degeneration, which has already been described for the brain after stroke.29,30 After cerebral infarction, a reduced anisotropy within the corticospinal tract remote from the lesion was found 2–6 months after ischemic stroke, highlighting the potential of DTI to detect and monitor the structural degeneration of fiber pathways.
A significant limitation of our conclusions is because of the low number of subjects and the heterogeneous patient population with a small number of patients with the respective pathologies (1 patient with an edema and 3 patients with what we call a cavitation). Therefore, we cannot decide whether the ADC values that we have seen in these patients truly reflect biological phenomena or whether they constitute an artifact that we cannot fully explain. More patients are needed to fully characterize the ADC values under these circumstances in the spinal cord. One might, for example, presume that, in venous congestion, not only an increase in water may be present but that a true cellular infiltration can occur. Because of the longstanding nature of the disease in some patients, one might also think of gliosis as the reason for the normal ADC values. In cases of cavitation, arachnoidal adhesions may be present that account for a nonelevated ADC. Potential sources of artifacts that may explain our findings are partial volume averaging, artifacts from the acquisition technique, and distortions because of local field inhomogeneities. However, our primary aim was to evaluate whether DTI of the spinal cord is feasible in patients harboring spinal vascular malformations. The complex and different pathophysiologies including venous congestion and hematomyelia and the different time intervals between symptom onset and imaging interfere with the interpretation of the results. Facing a loss of tracts, it remains impossible to differentiate a true loss of white matter fibers from the increase of interstitial-free water. The calculated fiber trajectories and ROI statistics therefore do not necessarily reflect true pathology. Susceptibility artifacts (because of hemoglobin degradation products or vascular structures) and the heterogeneity of the magnetic field in the spinal canal are additional problems. Although we were able to ameliorate our imaging sequences by changing the protocol from DTI6d to DTI25d, a single-shot EPI sequence still suffers from strong susceptibility distortions. Using parallel imaging techniques, this susceptibility distortion may be reduced5; still, GRAPPA parallel imaging as used in this article may cause unfolding artifacts that may give rise to a pseudointerruption of spinal cord fibers. These problems may potentially be overcome with the use of new MR acquisition techniques, such as multishot SE DTI or a reversed gradient approach (that reduces in-plane voxel displacements by correcting distortions in the phase-encoding direction)31 or trying higher acceleration factors that may reduce some of these susceptibility and geometric distortion artifacts32 and that warrant further studies in this field.
Conclusions
In this short series we were able to show the following: 1) DTI of the spinal cord is possible in the presence of vascular malformations; 2) AVMs at the level of the nidus can interrupt, displace, or separate the fiber tracts, whereas, distant to the nidus, the effects of congestion or gliosis on the tracts can be perceived; 3) the clinical score can be reflected by the interruption of fibers close to the nidus and by a loss of fibers distant to the lesion; and 4) the quantitative results, especially the FA values, may be related to the clinical symptoms. We conclude that DTI with FT offers a novel approach to image spinal cord AVMs and opens a window to understand the complex pathophysiology of these lesions.
Acknowledgments
We thank one anonymous reviewer for his helpful and constructive critique. Moreover, we are deeply indebted to Soke M. Chng, MD, and Sean Cullen MD, for final proofreading and editing of the article.
References
- Received August 14, 2006.
- Accepted after revision November 8, 2006.
- Copyright © American Society of Neuroradiology
In this issue


Jump to section
Related Articles
Cited By...
- No citing articles found.