
Abstract
PURPOSE: We sought to determine whether an early CT ischemic lesion showing parenchymal hypoattenuation might be undetectable on diffusion-weighted imaging (DWI) in acute cerebral ischemia.
MATERIALS AND METHODS: We retrospectively evaluated CT and MR images of 70 consecutive patients with acute middle cerebral artery (MCA) infarction. All patients underwent CT and MR imaging within 6 hours of symptom onset. We determined the presence of reversed discrepancy (RD), defined as an early ischemic lesion showing parenchymal hypoattenuation on CT but no hyperintensity on DWI. CT Hounsfield units (HU), apparent diffusion coefficients (ADCs), and perfusion parameters were calculated for RD lesions.
RESULTS: RD was found in 9 (12.9%) patients and at basal ganglia (89%). The mean HU of RD lesion was lower than that of normal tissue (ΔHU, 2.33 ± 0.74, P < .001). RD lesions showed no significant decrease of ADC (ADC ratio, 0.97 ± 0.07, P = .059) and cerebral blood flow (relative CBF, 0.87 ± 0.20, P > 0.05). Delayed DWI hyperintensity occurred in 8 (88.8%) RD lesions, and all lesions progressed to infarction. In 6 (66%) of 9 patients with RD, Alberto Stroke Program Early CT scores of ischemic lesions were lower on CT than those on DWI.
CONCLUSION: RD was uncommonly found mainly in basal ganglia, and all RD lesions progressed to infarction at follow-up. Early CT ischemic lesion showing parenchymal hypoattenuation may be undetectable on DWI, and DWI may underestimate extent of severe ischemic tissue in patients with acute MCA infarction.
In patients with acute ischemic stroke, early ischemic changes on CT include parenchymal hypoattenuation, loss of gray-white matter distinction, and brain swelling with sulcal effacement.1–4 Although the significance of early ischemic changes remains controversial within 3 hours after symptom onset,4,5 patients showing large parenchymal hypoattenuation have a high risk of symptomatic hemorrhage after tissue plasminogen activator (tPA) treatment.3 An early CT ischemic lesion showing hypoattenuation indicates severe ischemic edema, critical hypoperfusion, and irreversible ischemic injury.6,7
Recent MR imaging studies8–11 have suggested that MR imaging has the potential to be the first imaging method for making a decision of thrombolytic therapy in acute ischemic stroke. Diffusion-weighted imaging (DWI)–hyperintense lesions, though rarely permanently reversible, usually represent ischemic tissue that will progress to infarction.12–14 In most cases of acute cerebral ischemia, the size of a hyperintense lesion on DWI is similar to or larger than that on CT, and there is a correlation of lesion size between CT and DWI.15,16 However, little documentation is available on a finding of reversed discrepancy (RD) between CT and DWI in acute cerebral ischemia.16,17
This study was performed to determine whether an early CT ischemic change of parenchymal hypoattenuation may be undetectable on DWI, and to determine whether the extent of severe ischemic tissue may be underestimated on DWI in patients with untreated acute middle cerebral artery (MCA) infarction.
Materials and Methods
Patients
Between May 1997 and June 2004, 215 consecutive patients who presented with acute MCA infarct and a National Institutes of Health Stroke Scale (NIHSS) score of more than 3 underwent CT within 6 hours of symptom onset. MR imaging was performed after CT on the same day in 210 patients. Of these 210, we retrospectively included 70 patients (40 men and 30 women; mean age, 70 years) who underwent MR imaging within 6 hours of symptom onset and who did not undergo thrombolytic therapy.
CT and MR Imaging
All CT scans were obtained using a helical CT scanner or multidector CT (Hi-Speed Advantage or LightSpeed Ultra; GE Medical Systems, Milwaukee, Wis). The scanning parameters of the unenhanced CT were 120 kV and 240 or 300 mAs with a 512 × 512 image matrix, 23- or 24-cm field of view, and a 5-mm section thickness. Maximal intensity projection CT angiography (CTA) was obtained from enhanced CT source data obtained according to a protocol of multiphasic perfusion CT.16
MR imaging was performed using a 1.5T unit (GE Medical Systems) with echo-planar imaging (EPI) sequences, including diffusion- and perfusion-weighted imaging (DWI/PWI). The typical stroke MR imaging protocol consisted of DWI, PWI, T2* gradient-echo, gadolinium-enhanced T1-weighted imaging, and 3D time-of-flight MR angiography (MRA). Imaging parameters of DWI were as follows: repetition time (TR), 6500–10,000 ms; echo time (TE), 71.7–96.8 ms; matrix, 128 × 128; 3 directions; field of view (FOV), 24 or 28 cm; section thickness, 5 mm; and intersection gap, 2 mm. DWI was obtained with b values of 0 and 1000 s/mm2. PWI was performed with gradient-echo, echo-planar sequences with following parameters: TR, 2000 ms; TE, 60 ms; flip angle, 90°; matrix, 128 × 128, FOV, 24 cm; section thickness, 5 mm; and intersection gap, 2 mm. A series of images (8–10 sections, 40–50 images per section) was obtained before, during, and after administration of the contrast agent. Perfusion maps of relative cerebral blood volume (rCBV), time-to-peak (TTP), and relative cerebral blood flow (rCBF) were generated after eliminating the recirculation of contrast agent by γ-variate curve fitting. The rCBF map was obtained via the singular value decomposition deconvolution method.18,19
Determination of Reversed Discrepancy, Extent of Ischemic Lesion and Arterial Occlusion
In a retrospective manner, 2 neuroradiologists (D.G.N. and E.Y.K.) independently reviewed CT and DWI and determined the presence of RD. Disagreements were decided by consensus. The interpreters were unaware of initial MRAs, follow-up images, and clinical information except for information of affected hemisphere. The lesion exhibiting RD was defined as an early ischemic lesion that showed parenchymal hypoattenuation or loss of gray and white matter distinction on CT but no obvious hyperintensity on DWI. RD was determined when the extent of the RD was equivalent to an Alberta Stroke Program Early CT Score (ASPECTS)20 of at least 1 in the affected MCA territory. In all patients with RD, the extent of ischemic lesion was assessed using ASPECTS by parenchymal hypoattenuation on CT and by parenchymal hyperintensity on DWI. For determining ASPECTS, CT or DWI was reviewed independently of each image at a separate session. The 2 interpreters evaluated initial CTAs, initial MRAs, and follow-up (day 1) MRAs by consensus to determine arterial occlusion and presence of arterial recanalization, and recanalization rate of arterial occlusions at day 1 was compared between the patients with and without RD.
Quantitative Measurement of Reversed Discrepancy Lesions
In all patients with RD, initial and follow-up MR imaging, including DWI, PWI, and MRA, were successfully obtained 1 day after the initial MR imaging except for 1 patient (patient 4) in whom the initial PWI was not optimally obtained because of poor contrast enhancement. The PWI data from the patient 4 was not used in the analysis.
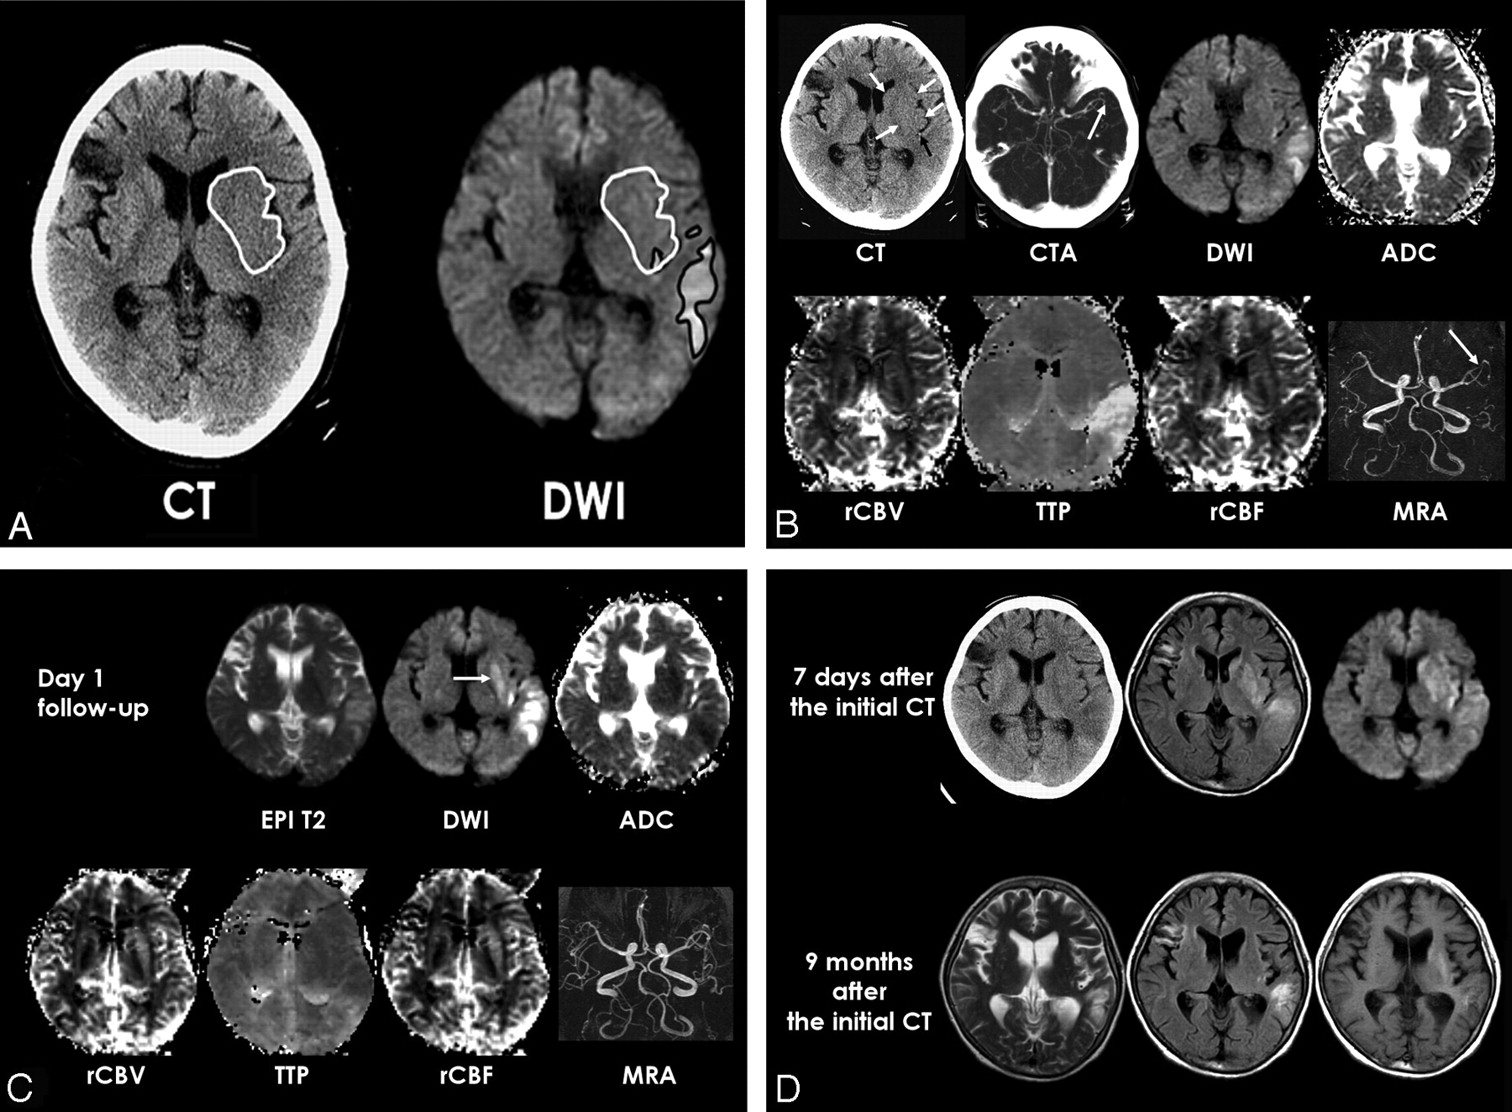
CT Hounsfield units (HU), ADC, DWI signal intensity, T2 signal intensity, TTP, rCBV, and rCBF values were measured by the final 3 regions of interest (ROIs) of RD lesion (only CT positive), DWI lesion 1 (both CT and DWI positive), and DWI lesion 2 (only DWI positive). All DWI and PWI images were spatially coregistered to the first volume of CT scans or EPI T2-weighted images (DWI b = 0) to superimpose the ROIs delineated on CT images using SPM2 (Wellcome Department of Cognitive Neuroscience). The 2 neuroradioligsts manually drew ROIs by consensus along the margins of the hypoattenuated lesions on CT and then drew ROIs along the margins of the hyperintense lesions on DWI in all patients with RD (Fig 1). Each ROI made on CT was superimposed on the same DWI images, which allowed us to make an ROI only for a lesion with RD (ROIRD) and ROIs for the whole DWI lesions (ROIDW), DWI lesion 1 (ROIDW1), and DWI lesion 2 (ROIDW2). The final 3 ROIs of RD lesion (ROIRD), DWI lesion 1(ROIDW1), and DWI lesion 2 (ROIDW2) were transferred to the corresponding coregistered images of the initial CT, DWI, and PWI maps including TTP, rCBV, and rCBF. For comparison, mirror ROIs were drawn on the contralateral hemisphere. The size of ROI ranged from 1.2 to 30.4 cm2. The ADC values were thresholded at 1200 × 10−6 mm2/s to minimize partial volume effect with CSF. The same quantitative measurements using ROIs were performed for follow-up MR imaging obtained at day 1 in patients with RD.

Patient 7. A, ROIs for parenchymal hypoattenuation and DWI hyperintensity were placed manually on unenhanced CT and DWI (TR, 10,000 ms; TE, 71.7 ms). The 2 ROIs for CT lesion and DWI hyperintensity provide an ROI for the lesion with reversed discrepancy showing CT parenchymal hypoattenuation and no obvious DWI hyperintensity.
B, Initial unenhanced CT shows subtle hypoattenuation of lentiform nucleus, caudate, and insula in the left MCA territory (white arrows). A hyperattenuated artery sign of the left inferior M2 branch (black arrow) is also seen. Maximum intensity projection CT angiography (CTA) shows occlusion of the left inferior M2 (arrow). DWI shows hyperintense lesions in the left temporal lobe and posterior insula, but DWI hyperintensity seems very subtle and not obvious in basal ganglia and is not seen in most areas of insula. ADC map shows cytotoxic edema in the left temporal lobe. Perfusion maps show an increased TTP delay and decreased rCBF only in the left temporal lobe, and no obvious perfusion abnormality is seen in the left basal ganglia. Initial MRA shows occlusion of the left inferior M2 (arrow).
C, Follow-up MR images at day 1 show delayed DWI hyperintensity and decreased ADC in the left basal ganglia (arrow). Perfusion maps and MRA demonstrate reperfusion in the left MCA territory and recanalization of the left M2 occlusion.
D, Follow-up CT and fluid-attenuated inversion recovery (FLAIR) images (TR, 10,000 ms; TE 133 ms; TI, 2200 ms) 7 days later show infarction in the RD lesion of basal ganglia and insula, and DWI shows increased extent of DWI hyperintense lesion in the left basal ganglia. FLAIR and T2-weighted MR images (TR, 3683 ms; TE, 104 ms) obtained 9 months after the initial CT show atrophy of the left basal ganglia and insula. T1 hyperintensity is seen in the left striatum at long-term follow-up. In this patient, there was a spontaneous rapid improvement of aphasia and motor weakness within 1 hour after symptom onset.
Clinical Data Analysis
A stroke neurologist assessed baseline, acute (days 1 and 7), and chronic (day 90) clinical data using the modified Rankin Score (mRS), and then compared for patients with and without RD. The incidence of spontaneous rapid clinical improvement (NIHSS score more than 3) within a few hours after stroke was assessed and compared for 2 subgroup patients. Time duration from onset to CT or MR imaging and the time interval between CT and MR imaging were compared between the 2 groups. The incidence of RD was compared between the patients who underwent MR imaging within 3 hours after symptom onset and those who underwent imaging at 3 to 6 hours. Hemorrhagic transformation was determined on T2* gradient-echo images at day 1.
Statistical Analysis
Statistical analysis was performed using commercial software (SPSS-PC, version 10.0; SPSS, Chicago, Ill). Comparisons of mean values for CT attenuation, ADC, DWI signal intensity, TTP, CBV, and CBF between lesions and contralateral hemispheres, and mean values for CT attenuation, ADC, ADC ratio, DWI signal intensity ratio, TTP delay, rCBV, and rCBF between lesions with RD and DWI lesions were compared with the use of a paired t test. When variables were non-normally distributed, comparisons were performed with the use of the Wilcoxon signed-rank test. Comparisons of clinical scores between the 2 subgroup patients with and without RD were performed with the use of the Student t test. The χ2 test or Fisher exact test was used to compare recanalization rates of arterial occlusions at day 1 and the incidence of rapid clinical improvement between patients with and without RD. A P value of < 0.05 was considered statistically significant. Two observers independently determined ASPECT scores on both CT and DWI. Each observer determined the presence of RD when the case showed discrepancy in the areas of ASPECT score between CT and DWI. For the presence or absence of RD, interobserver agreement was evaluated with κ agreement index.
Results
Demographic Data of Patients with Reversed Discrepancy
RD was found in 9 (12.9%) of 70 patients and located at basal ganglia in 8 (88.8%) of 9 patients with RD. The κ value for the presence of RD was 0.97. In all patients with RD, DWI hyperintense lesions were also present. Table 1 shows the demographic data of 9 patients (5 men and 4 women; mean age, 72 ± 12 years). The mean time to CT and MR imaging was 2.5 ± 1.3 and 4.1 ± 1.4 hours, respectively, after symptom onset, and mean time interval between initial CT and MR imaging was 1.6 ± 0.9 hours. A second follow-up CT or MR imaging was performed in 8 patients within 8 days (mean, 5.5 ± 2.4 days). No second follow-up imaging was performed in 1 patient (patient 4). In 4 patients, additional follow-up CT or MR images were obtained 3 to 11 months after the initial CT.
Clinical data of 9 patients with reversed discrepancy (RD)
Extent of Ischemic Lesion and Arterial Occlusion
In 6 (66%) of the 9 patients with RD, ASPECTS of early ischemic lesion showing hypoattenuation on CT were lower than those on DWI, and mean ASPECTS of 9 patients with RD was significantly lower on CT than those assessed on DWI (4.6 ± 2.5 and 6.0 ± 2.1, respectively, P = .023). CTA was obtained in 8 of 9 patients with RD. CTA showed occlusion of M1 in only 3 patients and patent M1 segment in the other 4 of the 7 patients who had RD in basal ganglia. In 1 patient with RD in the frontal cortex, there was no arterial occlusion at CTA.
In 5 (56%) patients with RD, initial MRA vascular territory on the affected side was smaller than that of CT ischemic lesion (ie, mismatch). Follow-up MRA 1 day after the initial MRA demonstrated recanalization of arterial occlusions in 4 (50%) of 8 patients with RD who had arterial occlusions on the initial MRA. In 29 patients without RD who underwent both initial and follow-up MRA at day 1 and had arterial occlusions on the initial MRA, recanalization was observed in 7 patients on MRA at day 1. The recanalization rate of arterial occlusions at day 1 was higher in the patients with RD than in those without RD, but without significance (50% and 24%, respectively, P > .05).
Quantitative Measurement of Lesions Showing Reversed Discrepancy
Table 2 demonstrates mean values of CT HU, DWI, and PWI in lesions with RD on initial CT and MR imaging. The CT HU and TTP of RD lesion was significant different from contralateral control values (P < .001, respectively), but ADC and other MR imaging parameters of RD lesions were not different from control values. The mean CT HU of RD lesion was not significantly different from those of DWI lesion 1 (P > .05), but it was lower than that of DWI lesion 2 (P < .001). The mean ADC, ADC ratio, and DW signal intensity ratios of RD lesions were significantly different from those of DWI lesion 1 or 2 (P < .001). The mean TTP and rCBF values of RD lesions were less delayed and higher than those of DWI lesion 1 or 2 (P < 0.001, respectively). The mean rCBV value between RD lesion and DWI lesion 1 or 2 was not significantly different (P > .05).
Mean values of computed tomographic (CT) attenuation, apparent diffusion coefficient (ADC), diffusion-weighted MR imaging (DWI)*
Table 2 shows changes in mean ADC, DWI signal intensity, and T2 signal intensity values observed at the day-1 follow-up. For RD or DWI lesions, mean ADC values were significantly lower at follow-up than those at the initial DWI (P < .001), and DWI and T2 signal intensities were higher than those at the initial DWI (P < .001). T2 signal intensities of RD lesions were significantly lower than those of DWI lesion (P < 0.001) at the day-1 follow-up. The mean ADC value and DWI signal intensity of RD lesions were significantly different from those of DWI lesion (P = .037 and P < .001, respectively) at follow-up. The day 1 follow-up DWI demonstrated delayed hyperintensity of RD lesions in 8 (88.8%) of the 9 patients. In these 8 patients (except for 1 patient without a second follow-up image), all RD lesions progressed to overt infarctions at second follow-up. In 1 patient who had no delayed DWI hyperintensity at RD lesion at day 1, RD lesion progressed to infarction at the second follow-up. RD lesions converted to atrophy (n = 2) (Fig 1) or pan-necrosis (n = 2) (Fig 2) in 4 patients who underwent long-term follow-up CT or MR. The total area of CT hypoattenuation lesions and area of RD lesions was 500.25 and 128.47 cm2, respectively. The area of RD lesion was present in 25.7% of total area of CT ischemic lesion in 9 patients with RD.

Patient 8. A, Initial unenhanced CT shows parenchymal hypoattenuation and loss of gray-white matter distinction in the left frontal lobe of ACA and MCA territory (arrows). Echo-planar spin-echo T2-weighted image (EPI T2, DWI of b value of 0, TR, 6500 ms; TE, 96.8 ms) shows no hyperintensity in the left frontal lobe. DWI (6500/96.8) and ADC map show hyperintensity and reduced ADC only in the medial frontal cortex and precentral gyrus that are only a part of hypoattenuated ischemic lesion depicted on CT. Perfusion maps show a TTP delay in the DWI lesion but no significant perfusion abnormality in the left frontal lobe lesion with reversed discrepancy on CT and DWI (arrowheads). MRA shows decreased signal intensity of the left distal MCA branches (arrow) and there was occlusion of the left A2 on MRA (not shown).
B, Follow-up MR images at day 1 show delayed DWI hyperintensity and ADC decrease in the left frontal lobe lesion with reversed discrepancy (arrows) and more severe cytotoxic edema in the medial frontal cortex and precentral gyrus of the left frontal lobe. Follow-up MRA shows recanalization of distal MCA branches but persistent perfusion abnormality in the ischemic lesion found on the initial DWI.
C, Follow-up CT image obtained 7 days after the initial CT demonstrates ischemic edema with heterogeneous hypoattenuation in the left frontal lobe. CT image obtained 11 months after the initial CT shows overt infarction with necrosis in the lesion with reversed discrepancy.
Clinical Data Analysis
No significant difference was observed in the baseline NIHSS scores (15.4 ± 4.5 and 13.6 ± 5.4), 24-hour NIHSS scores (13.7 ± 5.4 and 10.1 ± 6.2), or the chronic mRS (3.4 ± 1.6 and 2.8 ± 1.7) between those with and without RD on initial CT and DWI (P > .05). Spontaneous rapid clinical improvement was found in 3 (30%) patients with RD and 2 (3%) of patients without RD (P = .013). No significant difference was observed in terms of duration from symptom onset to CT and MR imaging (2.5 ± 1.3 versus 2.4 ± 1.2 and 4.1 ± 1.4 versus 3.8 ± 1.3, P > .05) or in terms of the time interval between CT and MR imaging (1.6 ± 0.9 and 1.4 ± 0.8, P > .05). No difference in the incidence of RD was found according to the time between onset and MR imaging, ie, 3 hours (13.0%, 3 of 23) and 3 to 6 hours after symptom onset (12.8%, 6 of 47) (P > .05). In 1 of 9 patients with RD, hemorrhagic transformation was observed in an RD lesion on T2* gradient-echo images at day-1 follow-up.
Discussion
Our study demonstrates that the early CT sign of parenchymal hypoattenuation may be undetectable on DWI in patients with acute cerebral ischemia. In 12.9% of patients with acute stroke who did not undergo thrombolytic therapy, portions of acutely ischemic brain tissue showed hypoattenuation on CT but appeared normal on DWI images obtained immediately afterward.
CT attenuation is linearly proportional to tissue water content,21 and an early CT sign of parenchymal hypoattenuation develops under the severe CBF decrease because early ischemic edema accompanying uptake of tissue water develops under CBF less than 10–15 mL/g/min.22 Meanwhile, the CBF threshold for an ADC decrease is higher than that of CT, and an ADC decrease occurs before CBF declines at the critical threshold for energy failure.23,24 The presence of RD between CT and DWI contradicts the general concept of higher sensitivity of DWI for early ischemic tissue and the natures of the correlations between CT attenuation and ADC or CBF.25,26
What, then, is the pathophysiology of RD? The results of the present study suggest that RD may be related to early spontaneous reperfusion, which is supported by the mismatch between the site of arterial occlusion and vascular territory for an RD lesion, very mildly reduced to normal CBF in an RD lesion, and higher incidence of rapid clinical improvement. However, it is unclear why a hypoattenuated RD lesion has a normal ADC. The normal ADC of RD lesion might be explained by the transient normalization of ADC because of reperfusion, as has been reported in previous studies.14,27–29 Pseudonormalization of ADC has been shown with previous animal and human studies after early reperfusion.13,27–29 A number of theories attempt to explain this phenomenon, but the exact cause is unknown. As for the explanation of early ADC renormalization, transient recovery from histologic cellular change by early ischemia or water influx by reperfusion seems less likely because ADC renormalization is not associated with a reversal of astrocytic swelling or neuronal shrinkage, and more severe ischemic tissue resulting in blood-brain barrier breakdown has no ADC reversibility according to animal studies.27,28 The finding of RD might give us a message similar to that of an animal study,28 which showed a discrepancy between histologic finding of persistent cytotoxic edema and reperfusion-induced ADC renormalization. A theory of transient recovery of energy metabolism suggested for explaining transient ADC normalization29 might be also a possible explanation for RD that CT hypoattenuation as a result of continuation of ischemic edema may coexist with transient normalization of ADC after early reperfusion. Nevertheless, it remains to be determined whether transient energy metabolism recovery can occur in ischemic tissue showing hypoattenuation on CT.
Although ADC decrease of ischemic tissue is related to cytotoxic edema and energy failure,27,30 the exact mechanism of ADC decrease remains unclear.27,31 However, the finding of RD evidently indicates that a decrease of CT attenuation has a pathophysiology different from that of an ADC decrease in acute cerebral ischemia The mechanism of CT hypoattenuation in early ischemic tissue may be complex. It may be due to a combination of increase in tissue water and low CBV.32 However, our data do not support the concept that low CBV is a direct major cause of CT signs of parenchymal hypoattenuation because our data showed lack of CBV decrease in RD lesion and presence of CT hypoattenuation without a concomitant arterial occlusion in some cases.
Although patients with RD showed higher incidence of rapid clinical improvement, there was no significant association with a better clinical outcome or significantly higher incidence of spontaneous arterial recanalization than those without RD. Further study is required to determine whether early reperfusion may reduce the degree of tissue damage or functional injury in ischemic tissue showing CT hypoattenuation.
Our study demonstrates that severe ischemic tissue showing CT hypoattenuation could be missed in patients with untreated hyperacute ischemic stroke even within 3 hours of onset. Although DWI is usually more accurate, reliable, and sensitive for early ischemic tissue than CT, it may be less sensitive for depicting severe ischemic tissue than CT in some patients if spontaneous early reperfusion occured within the severe ischemic tissue. If one obtains only MR imaging in acute stroke patients, ischemic lesions that are not visualized on DWI but are destined to infarct may be present. Therefore, although the utility of DWI for decision-making for thrombolytic therapy is probably widely accepted, it should be recognized that the evaluation of the extent of severe ischemic tissue can be inaccurate by DWI, and caution should be exercised when determining eligibility for thrombolytic therapy based on the extent of ischemic tissue on DWI.
In conclusion, a finding of RD was uncommonly found in untreated patients with acute MCA infarction and its pathophysiology may be related to pseudonormalization of ADC by spontaneous early reperfusion in severe ischemic tissue. Severe ischemic tissue showing an early CT sign of parenchymal hypoattenuation may be undetectable on DWI and DWI may underestimate its extent in patients with untreated acute MCA infarction.
References
- Received September 26, 2005.
- Accepted after revision January 19, 2006.
- Copyright © American Society of Neuroradiology
In this issue


Jump to section
Related Articles
Cited By...
- Recent Administration of Iodinated Contrast Renders Core Infarct Estimation Inaccurate Using RAPID Software
- Diagnosis of DWI-negative acute ischemic stroke: A meta-analysis
- Diffusion-Weighted Magnetic Resonance Imaging May Underestimate Acute Ischemic Lesions: Cautions on Neglecting a Computed Tomography-Diffusion-Weighted Imaging Discrepancy
- Early Ischemic Change on CT Versus Diffusion-Weighted Imaging for Patients With Stroke Receiving Intravenous Recombinant Tissue-Type Plasminogen Activator Therapy: Stroke Acute Management With Urgent Risk-factor Assessment and Improvement (SAMURAI) rt-PA Registry
- Correlation between CT and Diffusion-Weighted Imaging of Acute Cerebral Ischemia in a Rat Model