
Abstract
BACKGROUND AND PURPOSE: Perfusion CT (PCT) has the ability to measure quantitative values and produce maps of cerebral blood flow (CBF), cerebral blood volume (CBV), and mean transit time (MTT). We assessed cerebral hemodynamics by using these parameters and acetazolamide challenge in patients with cerebrovascular steno-occlusive disease.
METHODS: Fifteen patients underwent PCT with acetazolamide challenge. Comparison of mean CBF, CBV, and MTT was determined between hemispheres and before and after acetazolamide challenge. Hemispheric ratio and percent change due to acetazolamide administration were also calculated. Absolute values and percent changes 2 SDs outside the mean from the nonstenotic hemispheres were defined as abnormal.
RESULTS: Significant decreases in CBF (−25.1%, P = .003) and significant increases in MTT (47.1%, P < .001) were found in stenotic hemispheres. After acetazolamide challenge, significant changes in CBF (−39.5%, P < .001) and MTT (92.9%, P < .001) were also seen. The acetazolamide test significantly decreased CBF hemispheric ratio (−20.3%, P < .001) and increased MTT hemispheric ratio (30.8%, P = .002), making both maps more asymmetric. Significance in CBF and MTT percent changes (P < .001 and P = .005, respectively) was found between hemispheres. When CBF percent changes were assumed to represent the true determinant of hemodynamic impairment, normal ranges of baseline MTT value and MTT percent changes demonstrated sensitivities of 66.7% and 100% and specificities of 58.3% and 75%, respectively, for detecting patients with hemodynamic impairment.
CONCLUSION: Parameters obtained from PCT with acetazolamide are promising for the evaluation of cerebral hemodynamics in patients with cerebrovascular steno-occlusive disease.
Arterial stenosis or occlusion can cause a reduction in the pressure in the distal arterial vessels; however, the degree of stenosis or the presence of arterial occlusion does not accurately predict the hemodynamic status of the distal circulation.1 Collateral circulation can maintain normal cerebral perfusion pressure and normal cerebral blood flow (CBF) in many of these patients. When collaterals are not adequate to maintain normal perfusion pressure, reflex vasodilation occurs to maintain normal blood flow. This response, as well as the reflex vasoconstriction observed with increased perfusion pressure, is known as autoregulation.
In some studies, the measurements of cerebral blood volume (CBV) or mean transit time (MTT) are intended to detect the presence of autoregulatory vasodilation.2 Increases in CBV are found distal to stenotic or occluded carotid arteries in some patients, but this response may be variable. MTT may be more sensitive than CBV alone for the identification of autoregulatory hemodynamic compromise.
Another category of studies uses paired CBF measurements with the initial measurement obtained at rest and the second measurement obtained following a cerebral vasodilatory stimulus to calculate percent changes.2 Normally, this will result in a robust increase in CBF. If the CBF response is muted or absent, pre-existing autoregulatory cerebral vasodilation due to reduced cerebral perfusion pressure is inferred.
Although a number of different methods of perfusion imaging may be used to evaluate patients with cerebrovascular insufficiency, many of these previously reported methods (such as positron-emission tomography and xenon-enhanced CT) may be unavailable outside large centers. The usefulness of dynamic perfusion CT (PCT) imaging for early diagnosis of acute ischemic stroke has been previously reported, and it has become a promising tool for a quick and inexpensive evaluation of the cerebral circulation in an acute stroke. However, there are few reports assessing the feasibility of PCT in the evaluation of patients with chronic cerebral ischemia.3–5 The purpose of our study was to assess cerebral dynamics by perfusion parameters of PCT before and after acetazolamide challenge in patients with unilateral significant cerebrovascular steno-occlusive disease.
Methods
Theory
PCT is performed on the basis of the central volume principle by monitoring the first pass of a bolus of iodinated contrast material through the cerebral vasculature.6 The contrast agent infused at a slower rate (eg, 4 mL/s) causes a transient increase in attenuation, proportional to the amount of contrast material in a given region. We also assume that a linear relationship exists between the enhancement in CT numbers and the concentration of contrast material within an artery or brain tissue region and that contrast material and blood have the same hemodynamic properties. Deconvolution of arterial and tissue enhancement curves, a complex mathematic process, gives the MTT. The CBV is calculated as the area under the curve in parenchymal pixels divided by the area under the curve in arterial pixels. CBF is calculated as CBV/MTT.
Designs
From July 2003 through August 2005, PCT scans with acetazolamide challenge were retrospectively reviewed in patients who were selected with the following criteria: normal findings on a nonenhanced CT scan of the brain and bilateral biplane common carotid arteriography showing unilateral stenosis with >70% diameter reduction (Table 1). The patients had to have normal contralateral cerebrovasculature. There was no newly developed neurologic deficit at the time of PCT.
Patient characteristics and hemodynamic impairment in hemispheres distal to stenoses
Imaging Protocol
PCT studies were performed on a CT unit equipped with an 8-detector array (LightSpeed, GE Healthcare, Milwaukee, Wis). After nonenhanced CT of the whole brain, 4 adjacent 5-mm-thick sections were selected at the level of the basal ganglia that covered all 3 vascular territories. We also activated the red laser alignment light on the CT scanner and made 3 marks on the patient’s skin. A bolus of 40 mL of iodinated contrast material was injected at a rate of 4 mL/s into an antecubital vein with a power injector. At 5 seconds after the injection, dynamic (continuous) scanning was initiated with the following technique: 120 kVp, 60 mA, 4 × 5 mm-thick sections, and 1-second per rotation for 50 seconds. The 1-second images were reformatted at 0.5-second intervals, and the 5-mm-thick sections were reformatted into two 10-mm-thick sections. PCT was performed repeatedly, approximately 15 minutes after intravenous bolus injection of 1 g of acetazolamide. With the aid of the skin marks, the same section could be obtained reliably.
Data Analysis
An experienced neuroradiologist (P.-S.Y.) used the anterior cerebral artery contralateral to the stenoses as the arterial input and the superior sagittal sinuses as the venous outflow to maintain a constant technique in the generation of perfusion maps. The same author drew identical-sized mirrored regions of interest (ROIs) manually on the reference CT image from the cine dataset over the cortical gray matter of the expected territory of the middle cerebral arteries bilaterally, taking care to exclude large cortical vessels. Maps of the CBF, CBV, and MTT were then generated with ROIs in place (Fig 1) by using a workstation (Advantage Windows, GE Healthcare) with PCT software. From each ROI, the absolute values of the CBF, CBV, and MTT were calculated.

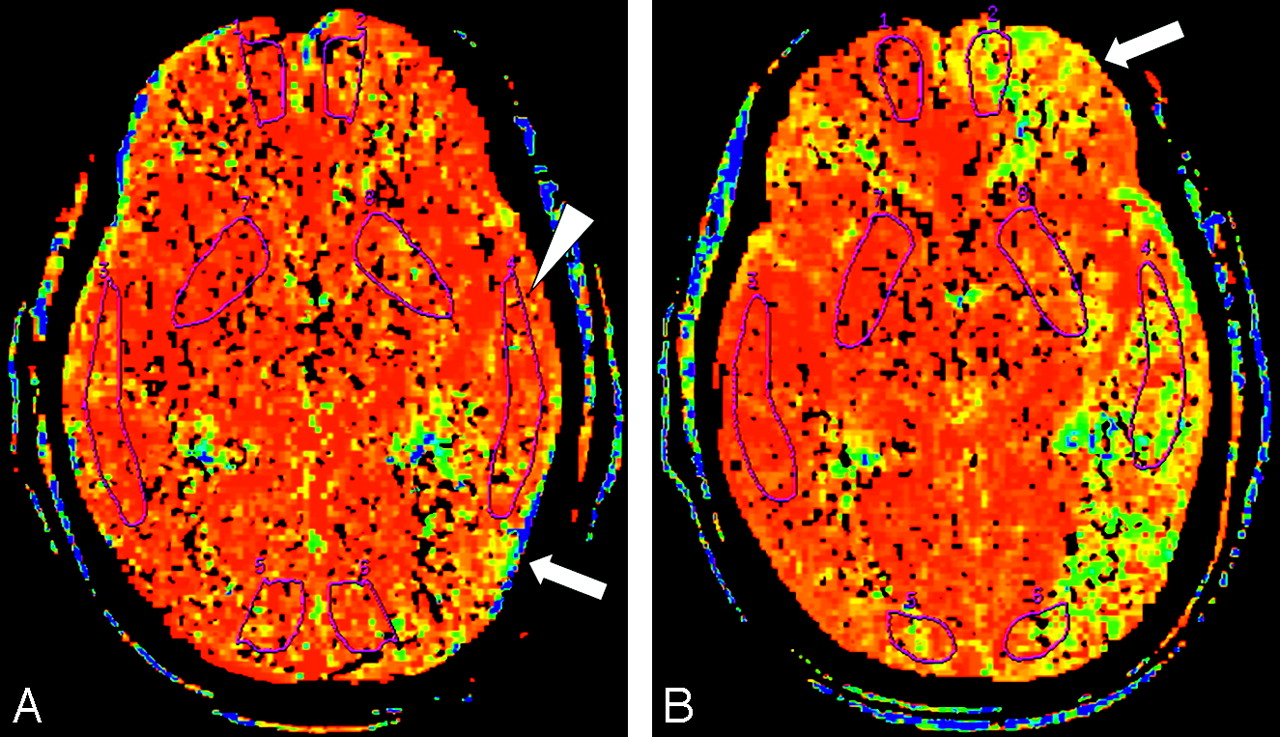
MTT maps in a 66-year-old woman.
A, MTT map before acetazolamide infusion shows prolonged MTT in the left hemisphere represented as areas displayed (yellow and green arrow). The ROI placed in the left hemisphere (arrowhead) does not include the areas of maximal MTT elevation.
B, MTT map obtained 15 minutes after infusion of acetazolamide, with use of the same section location and display parameters as those in A. Despite appropriate response on the right, no shortening in MTT is apparent in the left hemisphere. Instead, additional prolongation in MTT can be seen in areas in the left middle cerebral artery territory and the frontal lobe (arrow). By using ROI analysis, we measured a paradoxical prolongation in mean cortical MTT value of 93.7% on the left and interpreted it as evidence of hemodynamic impairment due to reduced perfusion pressure.
The cerebral hemodynamic status was also assessed by hemispheric ratio and percent changes. Hemispheric ratio was determined by dividing the absolute values in the stenotic hemispheres by those in the nonstenotic sides. Percent changes in each hemisphere were calculated as follows: percent changes (%) = (parametersACZ-parametersBaseline) ÷ parametersBaseline × 100, where parametersBaseline and parametersACZ represented parameters before and after intravenous injection of acetazolamide, respectively. Two-tailed paired t tests were used to (1) compare mean perfusion parameter values in stenotic hemispheres with those in nonstenotic sides, (2) compare the mean CBF, CBV, and MTT hemispheric ratios before injection of acetazolamide with those after challenge, (3) compare mean perfusion parameter values before injection of acetazolamide with those after challenge in hemispheres ipsilateral and contralateral to the stenoses, and (4) compare the mean CBF, CBV, and MTT percent changes in stenotic hemispheres with those in nonstenotic sides.
In addition, perfusion measurements from the baseline values and percent change of nonstenotic hemispheres were used to define the normal ranges. Values outside the normal ranges determined between the mean plus 2 SDs and that minus 2 SDs were considered to be abnormal (hemodynamic impairment).
Results
Patient Characteristics
We identified 15 patients (9 men, 6 women; age, 68 ± 10 years [mean ± SD]) who fulfilled the inclusion criteria. Table 1 provides clinical information, cerebrovascular history, and significant vascular anatomy from each patient. Severe arterial stenoses were suggested by MR angiography in 14 patients and by duplex sonography in 1 patient. Five patients who were asymptomatic underwent MR angiography during medical checkups. Digital subtraction angiography and PCT were requested to confirm the presence, quantify the degree, and evaluate the hemodynamic significance of the stenoses. The median interval between PCT and angiography was 1 day, with a range of 1–38 days. All patients underwent the PCT successfully. No adverse effects were reported after acetazolamide challenge.
Comparison of Parameters Measured Within Middle Cerebral Artery Territories
Before Acetazolamide Infusion.
Thirteen patients with unilateral significant cerebrovascular stenosis had lower CBF values on stenotic hemispheres than on nonstenotic sides. Eight patients had lower CBV values on stenotic sides, and 7 patients had greater CBV values on nonstenotic sides. Fourteen patients had greater MTT values on stenotic sides than on nonstenotic sides. In the whole group, statistically significant decreases in mean CBF values and increases in mean MTT values were on the sides affected by stenoses within the ROIs.
After Acetazolamide Challenge.
Nine patients had lower CBV values on stenotic hemispheres, and 6 patients had greater CBV values on stenotic sides. No statistically significant difference in mean CBV values was found between stenotic and nonstenotic hemispheres before or after injection of acetazolamide. However, all patients had lower CBF values and greater MTT values on stenotic hemispheres than on nonstenotic sides. The decreases in mean CBF values and increases in mean MTT on stenotic hemispheres were also significant. The data are summarized in Table 2.
Values of perfusion CT parameters and percentage change before and after acetazolamide in the cerebral hemispheres ipsilateral and contralateral to the stenoses
Hemispheric Ratios
The mean values of the hemispheric ratios before and after acetazolamide challenge are shown in Table 3. Statistically significant decreases in mean CBF ratio and increase in mean MTT ratio were demonstrated after injection of acetazolamide. No difference was found with respect to the mean CBV ratio.
Values of hemispheric ratios before and after acetazolamide challenge
Comparison of Parameters Measured Before and After Acetazolamide Challenge
Hemispheres Distal to Stenoses.
Eight patients had increased CBF values, 11 patients had increased CBV values, and 7 patients had decreased MTT values after acetazolamide challenge. In the whole group, there was no significant relationship between the baseline and the acetazolamide-challenged mean perfusion parameters.
Hemispheres Contralateral to Stenoses.
All patients had increased CBF values, 12 patients had increased CBV values, and all patients had decreased MTT values after acetazolamide challenge. In the whole group, significant increases in mean CBF and CBV values and significant decreases in mean MTT value were found. The data are summarized in Table 2.
Percent Changes
The values of the CBF, CBV, and MTT percent changes in the cerebral hemispheres ipsilateral and contralateral to the stenoses are shown in Table 2. Statistically significant increases in mean CBF percent change and decreases in mean MTT percent change were demonstrated on nonstenotic hemispheres. No difference was found with respect to the mean CBV percent change.
Hemodynamic Impairment
Table 1 also summarizes the patients with hemodynamic impairment.
Defined by Normal Ranges.
All patients had normal CBF values in the stenotic sides. One patient had an abnormal CBV value above the upper limit of the normal range (0.4–5.6 mL/100 g). MTT values were prolonged in 6 patients (normal range, 1.9–5.0 seconds).
Defined by Percent Change.
CBF showed a decrease of 13.3% or greater from the baseline in 3 patients. All patients had normal CBV percent changes. Six patients had MTT increase of 3.1% or greater after acetazolamide challenge.
Discussion
The primary goal of this study was to evaluate the feasibility of PCT with acetazolamide challenge to assess cerebral hemodynamics by using the perfusion parameters in patients with unilateral significant cerebrovascular stenosis. The CT scanners used to perform PCT studies are available in most radiology departments.7 PCT studies, even combined with acetazolamide challenge, are also rapid and require little time to postprocess. The quantitative results potentially available with PCT may offer an advantage over qualitative techniques such as single-photon emission CT and perfusion-weighted MR imaging. The ability to measure CBV and MTT may also be an added advantage of PCT.
The accuracy of the central volume principle and the deconvolution method of quantification of PCT had been validated relative to other methods of CBF analysis, including injected microspheres in the experimental animal and the diffusible tracer, xenon.5,6,8,9 However, there are significant issues regarding the quantification of PCT as used clinically. First, the choice of the input artery was operator-dependent, which permitted partial volume effects in the attenuation measurements of the operator. In addition, on the basis of the deconvolution model, the input artery should ideally be chosen from the most proximal large feeding vessel directly supplying the tissue of interest. For practical reasons, it is not always possible to select such an input artery. There are limits to the accuracy of perfusion parameter calculations based on first-pass dynamics. Second, other than exclusion of areas that contained major blood vessel branches, there were no standardized guidelines for placing ROIs, which may make comparing results between different investigators difficult. Larger ROIs may result in greater volume averaging of gray and white matter, therefore lowering quantitative values for CBF compared with the results obtained when using smaller ROIs centered in the cortex. Third, PCT had a limited spatial coverage, which might make areas most severely affected by stenoses undetectable.
In the present study, all the perfusion CT maps and ROIs were generated by an experienced neuroradiologist (P.-S.Y.) to minimize interoperator variability and address the reproducible results. He created hand-drawn ROIs over the cortical gray matter of the expected territory of the middle cerebral arteries, with care not to involve substantial parts of the cerebral white matter. This is to reduce potential errors from the differences of physiologic perfusion values within the gray and white matter. Large cortical blood vessels were also excluded from the ROIs drawn in this study because it was assumed that inclusion of large blood vessels would decrease accuracy. We typically chose a transverse section through the level of the basal ganglia because this level contained representative territories supplied by the anterior, middle, and posterior cerebral arteries, therefore offering the opportunity to find abnormalities in each of these major vascular territories. We used the anterior cerebral artery contralateral to the stenoses as the input artery in all patients to maintain homogeneity in the study. Prior work10 indicates that perfusion maps derived by using various unaffected arteries (eg, unaffected middle cerebral artery versus unaffected anterior cerebral artery) provide similar results. The problem with using a single unaffected artery as the reference artery for the whole brain is that on the affected side, CBF values may be underestimated and MTT values may be overestimated. Further work in this issue is needed to determine the optimal input artery selection for assessment of patients with various forms of cerebrovascular disease.
These limitations may result in the wide ranges of absolute measurements, making detection of abnormal values difficult. Intrasubject normalization of the data is frequently used to deal with these problems. The use of hemispheric ratios takes advantage of the basic symmetry of the brain to improve sensitivity for identifying localized disease. In the present study, we selected patients with angiographically proved unilateral significant cerebrovascular stenosis. Thus, the measurements from the nonstenotic hemispheres can be used as a standardized reference.
Another way to deal with these problems is paired studies comparing a baseline measurement of perfusion parameters with a second measurement after a vasodilatory stimulus to calculate percent changes. Only CBF percent change (eg, regional cerebral vasoreactivity) has been studied previously. In our study, we used acetazolamide, a potent inhibitor of the enzyme carbonic anhydrase, as a cerebral vasodilatory stimulus. Although its precise mechanism of action is not known with certainty, acetazolamide infusion increases CBF by causing vasodilation of the cerebral arterioles.11,12 Not only CBF percent change but also CBV and MTT percent changes were calculated and analyzed.
CBF measurements were decreased in the hemispheres distal to the stenoses, both before and after acetazolamide challenge. The test was helpful in the depiction of additional asymmetry (further decrease in the CBF hemispheric ratio). The mean CBF value of 69.8 mL/100 g per minute, measured in the cortical gray matter in the hemispheres contralateral to the stenoses, was greater than the mean CBF value of 42.4 mL/100 g per minute reported for the basal ganglia location by Leenders et al,13 in which positron-emission tomography was used. It was also greater than the mean CBF value for cortical gray matter of 48.5 mL/ 100 g per minute reported by Hagen et al14 in a study in which xenon-enhanced CT was used. Using PCT, Eastwood et al15 reported that the mean CBF values were 48.6 mL/100 g per minute in full middle cerebral artery territories and 56.7 mL/100 g per minute in solely basal ganglia regions. The greater CBF value in our study may be due to different methods for measuring CBF value, different location for placing ROIs, and different selected patients for normal control.
CBF value below 5.4 mL/100 g per minute, considered to be abnormal in our study, was in good agreement with the study for patients with acute middle cerebral artery stroke by Eastwood et al,15 in which CBF values ranging between 0 and 10 mL/100 g per minute were considered to be those consistent with severe ischemia. This present study demonstrated that none of the patients had hemodynamic impairment as defined by this CBF value. This finding is due to different groups studied and timing of neurologic deficit. In addition, measurements of CBF in a resting state alone are considered inadequate for evaluation of hemodynamic impairment.2 First, normal values may be found when perfusion pressure is reduced, but CBF is maintained by autoregulatory vasodilation. Second, CBF may be low when perfusion pressure is normal. This can occur when the metabolic demands of the tissue are low.
CBF percent change has been used to evaluate hemodynamic impairment. Patients without a robust increase in CBF after acetazolamide challenge are considered to be at an increased risk of stroke and may benefit from interventions designed to increase blood flow.3,11,16–19 Webster et al17 showed that with xenon CT measurement of CBF percent change, an arbitrary decrease of 5% or greater from baseline (steal phenomenon) indicates tissues at a higher risk of stroke. Using the same method and measurements from 8 healthy volunteers, Kuroda et al 16,19 found that an increase of less than 9.7% over the baseline was the value 2 SDs below the mean CBF percent change. We used PCT with measurements from hemispheres contralateral to the stenoses and found that a CBF percent change decrease of 13.3% or greater was outside the normal range. Further studies in which PCT is compared with other methods may help to determine if a scaling factor is needed to interpret CBF percent change obtained with PCT.
Measurements of CBV showed no significant difference between hemispheres before and after injection of acetazolamide. There was no difference in hemispheric ratio before and after acetazolamide challenge or in percent change between stenotic and nonstenotic hemispheres. This was likely dependent on the degree and sufficiency of autoregulatory vasodilation and was discussed in detail in the study by Derdeyn et al.20 First, the relationship between CBV and autoregulatory vasodilation is not linear or direct. The small penetrating arterioles at which level the autoregulatory changes occur represent a small fraction of total CBV. The largest component of CBV is venous, and the degree to which autoregulatory vasodilation leads to increase CBV may be variable. Second, there may be biologic variability in the cerebral vasodilatory response to reduced cerebral perfusion pressure. Human studies indicate that individual variability seems to occur.20 Third, it may be difficult to accurately measure changes in CBV because of autoregulatory vasodilation. Normal CBV is approximately 4%. A 25% increase in CBV would increase this to 5%. Different imaging methods may have different strengths to detect these small changes. However, after injection of acetazolamide, significant increases in mean CBV value were found in the hemispheres contralateral to the stenoses, suggesting that PCT may detect the vasodilatory response induced by acetazolamide.
Before injection of acetazolamide, MTT measurements were already increased in the hemispheres distal the stenoses. The use of the acetazolamide test made the MTT maps asymmetry clearer (further increase in the MTT hemispheric ratio). The cortical CBF/CBV ratio, mathematically equivalent to the inverse value of MTT, was significantly correlated with cerebral perfusion pressure and could be a reliable index.21,22 A recent study by Wintermark et al23 showed that MTT maps were significantly more sensitive than nonenhanced CT, regional CBF, and CBV maps in detecting acute hemispheric stroke. In the present study, the mean MTT value of 3.4 seconds measured in the cortical gray matter in the hemispheres contralateral to the stenoses was in good agreement with the study of patients with acute middle cerebral artery stroke by Eastwood et al,15 in which the mean MTT value was 3.6 seconds for full middle cerebral artery territories and 2.9 seconds for solely basal ganglia regions. MTT values above 5.0 seconds, considered to be abnormal in our study, were shorter than the MTT value of 6 seconds calculated from 3 SDs above the mean MTT in control patients.15
When hemodynamic impairment defined by CBF percent change was assumed to represent the true determinant (or criterion standard), 5 of the 12 patients with normal cerebral hemodynamic status had a false-positive result defined by an abnormal baseline MTT value. Conversely, 1 of 3 patients with hemodynamic impairment had a false-negative result. False-positive results might be due to reflex vasodilation to maintain normal CBF despite reduced cerebral perfusion pressure. The acetazolamide challenge showed flow augmentation and further CBV increase from arteriolar vasodilation without evidence of exhausted autoregulation. The false-negative finding in patient 15 was related to improper ROI placement (Fig 1). When reviewed retrospectively, the MTT map showed that the maximal MTT elevation area was not in the ROI but still in an area supplied by the middle cerebral artery.
In the hemispheres distal to the stenoses, there was paradoxic prolongation in MTT values from the baseline after acetazolamide challenge. This suggested decreased cerebral perfusion pressure after injection of the acetazolamide and might be the underlying cause of the steal phenomenon. To our knowledge, the MTT percent change has not been used as a parameter to assess cerebral hemodynamics. Two patients with marked MTT prolongation also had abnormal CBF percent change. However, only 1 of the 4 patients with mild MTT prolongation had abnormal CBF percent change. The patient, unlike the other 3, had a higher baseline CBV value and poor vasodilatory change after acetazolamide challenge, which might imply the presence of poor vascular reserve and maximal autoregulatory vasodilation.
Acetazolamide has been used for a long time for the evaluation of cerebral hemodynamics. It is generally well tolerated. There were no adverse effects in our patients. Intravenous injection is known to cause circumoral numbness, headache, and tingling of the palms. Reversible pontine ischemia in a patient with stenosis of the basilar artery and transient ischemic attack in a patient with complete occlusion of a vertebral artery have been reported with the use of acetazolamide.24,25
PCT has the ability to measure CBF, CBV, and MTT, which is encouraging when assessing cerebral hemodynamics. By proper placement of ROI, prolonged MTT may be quite sensitive to detect the presence of altered brain hemodynamics without the use of acetazolamide. More information related to CBF change after injection of acetazolamide could be obtained to indicate autoregulation and cerebral perfusion pressure inferred by CBV and MTT, respectively. However, it should be noted that CBF is calculated as CBV/MTT on the basis of the central volume principle. It is not statistically valid to compare CBF with MTT or CBV because they will covary.
This study is limited in a number of ways that will need to be addressed in future trials with the use of this method. First, the normal ranges of perfusion parameters were determined from the hemispheres contralateral to the stenoses. Although there was normal cerebrovasculature proved by angiography, hemodynamic status in these hemispheres may not be assumed to be normal because of the possibility of interhemispheric shunting of blood. A future study in healthy humans with normal cerebrovasculature could help to show the optimal ranges of CBF, CBV, and MTT values. Second, it is important that future clinical studies of PCT in patients with hemodynamic impairment define each perfusion parameter or, in combination, provide association with stroke risk. Third, formal comparison of this method with other techniques in patients with cerebrovascular stenosis should be undertaken. The quantitative parameters using PCT should be standardized with validation of accuracy, reliability, and reproducibility. Finally, the limitation of anatomic coverage could be addressed, in part, by examining 2 different levels during each study. This issue will be addressed in the near future through the development of multisection CT scanners with greater arrays of elements.
Conclusion
Dynamic PCT is a noninvasive method that provides CBF, CBV, and MTT values and can be combined successfully with the acetazolamide challenge test to fully assess cerebral hemodynamics. Hemodynamic impairment could be inferred by abnormal baseline MTT values, CBF percent change, and MTT percent change. The use of acetazolamide also enhances the asymmetry in CBF and MTT maps. Although the use of these parameters for predicting patient outcome or guiding clinical management has not been established, added information is clearly encouraging. The availability and rapidity of PCT with acetazolamide challenge could result in potential usefulness for clinical investigations and management in patients with cerebrovascular disease.
References
- Received November 21, 2005.
- Accepted after revision January 3, 2006.
- Copyright © American Society of Neuroradiology
In this issue


Jump to section
Related Articles
Cited By...
- Association Between Changes in Lipid Profiles and Progression of Symptomatic Intracranial Atherosclerotic Stenosis: A Prospective Multicenter Study
- Vasodilatory Capacity of the Cerebral Vasculature in Patients with Carotid Artery Stenosis
- Reply:
- The Acetazolamide Challenge: Techniques and Applications in the Evaluation of Chronic Cerebral Ischemia
- Tracer Delay-Insensitive Algorithm Can Improve Reliability of CT Perfusion Imaging for Cerebrovascular Steno-Occlusive Disease: Comparison with Quantitative Single-Photon Emission CT