
Abstract
BACKGROUND AND PURPOSE: Despite the ubiquity of GM2 gangliosides accumulation in patients with late-onset GM2 gangliosidosis (GM2G), the only clinical MR imaging–apparent brain abnormality is profound cerebellar atrophy. The goal of this study was to detect the presence and assess the extent of neuroaxonal injury in the normal-appearing gray and white matter (NAGM and NAWM) of these patients.
METHODS: During a single imaging session, 9 patients with late-onset GM2G and 8 age-matched normal volunteers underwent the following protocol: (1) T1- and T2-weighted and fluid-attenuated inversion recovery MR images, as well as (2) multivoxel proton MR spectroscopy (1H-MR spectroscopy) to quantify the distribution of the n-acetylaspartate (NAA), creatine (Cr), and choline (Cho), were obtained.
RESULTS: The patients’ NAA levels in the thalamus (6.5 ± 1.9 mmol/L) and NAWM (5.8 ± 2.1 mmol/L) were ∼40% lower than the controls’ (P = .003 and P = .005), whereas the Cr and Cho reductions (∼30% and ∼26%) did not reach significance (P values of .06–.1). All cerebellar metabolites, especially NAA and Cr, were much (30%–90%) lower in the patients, which reflects the atrophy.
CONCLUSION: In late-onset GM2G, NAA decreases are detectable in NAGM and NAWM even absent morphologic (MR imaging) abnormalities. Because the accumulation of GM2 gangliosides can be reduced pharmacologically, 1H-MR spectroscopy might be a sensitive and specific for detecting and quantifying neuroaxonal injury and monitoring response to emerging treatments.
Late-onset GM2 gangliosidosis (GM2G) is a rare lysosomal storage disorder resulting from mutations of the α subunit of the lysosomal enzyme β-hexosaminidase A (βHex A), which catalyzes the degradation of GM2 ganglioside (1). The ensuing progressive accumulation of GM2 gangliosides within neurons has been associated with ectopic dendritogenesis, meganeurite formation, and apoptosis (2). βHex A gene mutations, most prevalent among Jews of Ashkenazi ancestry, may lead to either an infantile or the later-onset clinical subtypes, both of which are inherited autosomal recessive traits (3). Although the “classic” infantile form (Tay-Sachs disease) is a rapidly progressive neurodegeneration leading to death in the first few years of life, in the less common, late-onset form, the disease is delayed until childhood or early adulthood (4). This subtype exhibits a clinical picture characterized by dysarthria, dysmetria, ataxia, and various other signs of cerebellar and anterior motor neuron involvement (5). Most patients also suffer from psychiatric symptoms—eg, psychotic episodes and bipolar disorder (6). Genetic analysis reveals that most late-onset GM2G patients are compound heterozygotes, with one severe and one mild gene defect (usually the G269S mutation) associated with residual enzyme activity (1).
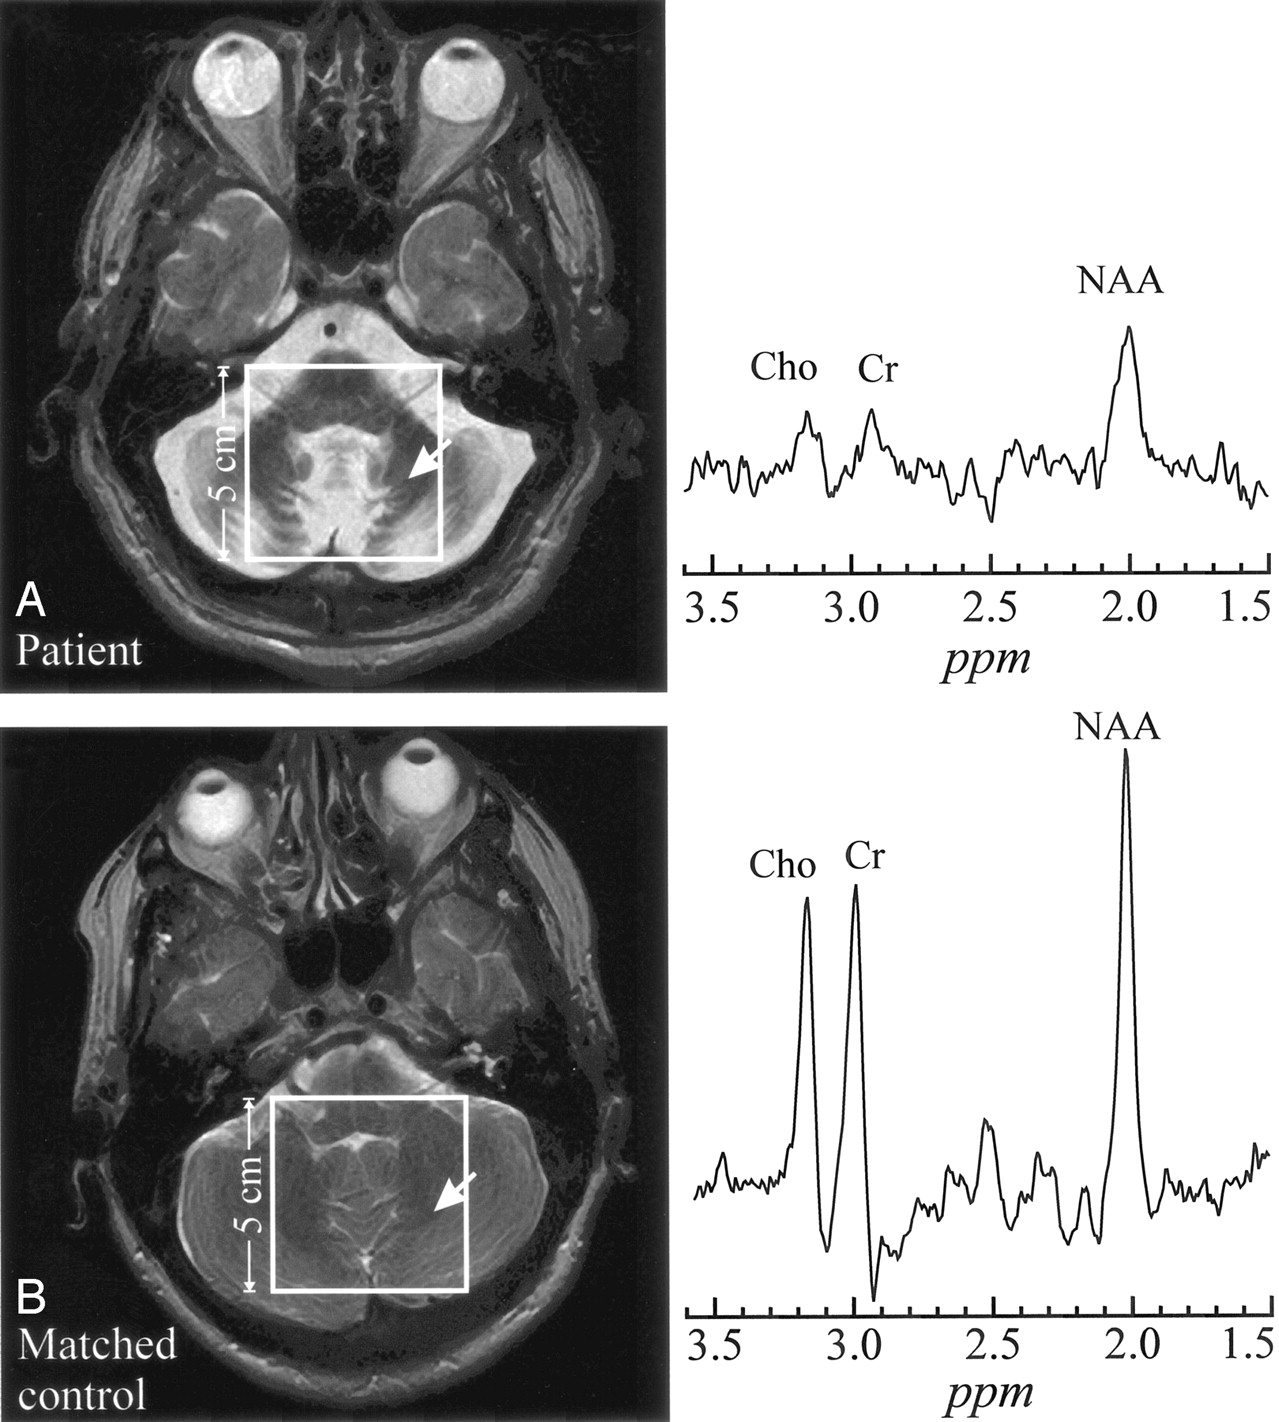
Unlike the infantile form, in late-onset GM2G, progressive cerebellar atrophy is the only abnormality on conventional MR imaging (compare Fig 1A); the supratentorial structures appear completely normal, as shown in Fig 2A (7–9). In postmortem examination, however, gangliosides are found not only in cerebellar neurons, but also throughout the neuroaxis, predominantly in deep cerebral nuclei, the hypothalamus, the substantia nigra, and other brain stem nuclei (10).

A, top left, Axial T2-weighted image from a 54-year-old late-onset GM2G patient superimposed with the 5 × 5 cm2 VOI. Right, 1H spectrum from the cerebellum (arrow).
B, bottom left, Corresponding section from a 52-year-old healthy control superimposed with the 5 × 5 cm2 VOI. Right, Arrow indicates analogous region for metabolite comparison. Both spectra are on the same scale. Note the dramatic atrophy of the cerebellar folia and vermis in the patient and consequent lower metabolites levels reflecting larger partial CSF volume contamination.

A, top left, T2-weighted image of a 54-year-old patient with late-onset GM2G, superimposed with the 8 × 8 cm2 1H-MR spectroscopy VOI. Right, Two spectra from thalamus and occipital white matter (arrows 1 and 2).
B, bottom left, Corresponding section from a matched control. The arrows indicate analogous regions to A for metabolite spectral comparisons. All spectra are on common intensity and chemical shift (parts per million) scales.
Note the characteristic lower NAA signal intensity in thalamus and NAWM in the patient (A) compared with the control (B), as well as decreased Cr and Cho.
Proton MR spectroscopy (1H-MR spectroscopy), a noninvasive assay of brain metabolism, has been applied to the study of CNS disorders, including the lysosomal storage diseases (11–14). The main detectable metabolites are (1) n-acetylaspartate (NAA), which is almost exclusively localized in neurons and their processes (11) and whose decrease, even beyond MR imaging abnormalities, has been associated with neuroaxonal injury or loss (15–20); (2) phosphocholine and glycerol phosphocholine (Cho), whose changes reflect membrane turnover; and (3) phosphocreatine and creatine (Cr), which act as reserves for high-energy phosphates in the cytosol of neurons and glial cells (21).
In this report, we compared MR imaging and metabolic characteristics of late-onset GM2G patients with age-matched controls to (1) assess the presence and the extent of neuro/axonal injury in regions of normal-appearing gray and white matter (NAGM and NAWM) and (2) identify potential metabolic markers of the disease and determine their impact on clinical manifestations.
Methods
Human Subjects
Nine late-onset GM2G patients (6 men and 3 women; mean age, 39 years; age range, 20–58 years; 6 patients of Ashkenazi Jewish ancestry) were studied. Their demographic, clinical, and genetic data are compiled in (Table 1). All showed different extent of cerebellar involvement. Specifically, 4 had mild, 4 moderate, and one severe tremor; 2 complained of mild, 4 moderate, and 2 severe dysarthria. In addition, 4 patients suffered mild, 4 moderate, and 2 severe weakness, and 4 patients were receiving psychotropic medication for treatment of psychiatric symptoms. Eight age- and sex-matched healthy controls (5 men and 3 women; mean age, 38 years; age range, 21–52 years) underwent the same MR imaging and MR spectroscopy procedures. The study was approved by our local institutional review board, and written informed consent was obtained from all subjects or their guardians.
Demographics, clinical and genetic information for the patients with late-onset GM2G
MR Imaging and MR Spectroscopy
MR imaging and 1H-MR spectroscopy were performed in a 1.5T whole-body imager and standard quadrature head-coil (Siemens, Erlangen, Germany). MR imaging comprised axial T2-weighted (TE/TR, 104/4500 ms; 210 × 210 mm2 field-of-view [FOV]; 208 × 256 matrix; 90° flip angle [FA)]), axial and sagittal fluid-attenuated inversion recovery (TE/TR/TI, 111/9000/2500 ms; 210 × 210 mm2 FOV; 256 × 256 matrix; 90° FA), and axial and sagittal T1-weighted (TE/TR, 4/1130 ms; 230 × 230 mm2 FOV; 512 × 512 matrix; 15° FA) images. All axial sequences imaged 20 5-mm-thick sections.
Multivoxel water-suppressed 1H-MR spectroscopy was performed by using point-resolved spectroscopic sequencing (TR/TE, 1500/144 ms) with 16 × 16 weighted k-space phase-encoding over a 16 × 16 cm2 FOV, leading to effective spatial resolution (voxel size) of 1.5-cm anterioposterior (AP) × 1.5-cm left-right (LR) × 1.5-cm craniocaudal (CC) = 3.4 cm3. For each subject, a 5-cm AP × 5-cm LR × 1.5-cm CC volume of interest (VOI) was positioned in a central cerebellar region, as shown in Fig 1A VOI: 8-cm AP × 8-cm LR × 1.5-cm CC VOI, was positioned on the inferior border of the lateral ventricles to include part of the genu and splenium of the corpus callosum, the thalami, and the NAWM, as shown in Fig 2. Automated shimming yielded consistent 3.0 ± 0.3 Hz voxel line widths in all VOIs.
Our postprocessing software removed residual water and broad signals from the MR spectroscopy data in the time domain (22, 23), apodized with a 3-Hz lorentzian, Fourier-transformed in the spectral and spatial directions, and automatically frequency 0- and 1st-order phase–corrected in reference to the NAA and Cho peaks in each voxel (24). The relative amounts of the NAA, Cr and Cho in every voxel of each subject were estimated from their spectral peak areas by using the parametric spectral modeling and least-squares optimization method of Soher et al (25). These relative quantities were converted into absolute concentrations against the signal intensity from a 3-L sphere of 0.033 mol of NAA in water (18). In this quantification process, we took into account the differences in relaxation longitudinal, T1, and transverse, T2, relaxation times between the phantom in vitro (NAA only, T1vitro = 1.4 seconds, T2vitro ≈ 0.5 seconds) and those reported in vivo by using (18)  Using the in vivo T1/T2 values reported in the literature, NAA = 1.4/0.43 seconds; Cr = 1.6/0.21 seconds; and Cho = 1.2/0.36 seconds (26, 27). Possible regional T1 or T2 variations were ignored, because similar anatomies were compared among all subjects. For quantification purposes in the cerebellum, because of the marked atrophy, we selected a voxel in the central white matter of the left hemisphere to include as much remaining tissue as possible. In the supratentorial brain, we selected a voxel in the center of the left thalamus and a voxel in the occipital white matter laterally to the occipital horn of the lateral ventricle.
Statistical Analyses
Nonparametric Kruskal-Wallis test of variance was used to compare MR spectroscopy data between patients and controls. Absolute levels of NAA, Cr, and Cho from the patients were correlated with their ambulation index and age at disease onset by using the nonparametric Spearman test. Results were declared significant at the 5% level (ie, P ≤ .05).
Results
Cerebellum
All late-onset GM2G patients exhibited the radiologic hallmark of severe cerebellar atrophy, as shown in Fig 1. 1H-MR spectroscopy was obtained from 8/9 patients. Cerebellar metabolites levels, not corrected for CSF fraction in the voxels, are compiled in (Table 2). Although all metabolites were 20%–90% lower than those of controls, only NAA (4.3 ± 2.7 vs 11.1 ± 1.1 mmol/L [mean ± SD] and Cr (2.9 ± 2.2 vs 8.7 ± 1.3 mmol/L) were significantly different (P = .02 in both cases), whereas Cho (1.1 ± 0.9 vs 2.4 ± 0.3 mmol/L) did not reach the level of statistical significance (P = .07).
1H-MR spectroscopy findings in patients with late-onset GM2G
Supratentorial Brain
None of the patients exhibited any supratentorial MR imaging abnormalities, as shown in Fig 2. The 1H-MR spectroscopy results reported in (Table 2), nevertheless, show significantly decreased NAA levels in the patients compared with the controls’ average in both the thalamus (6.49 ± 1.9 vs 11.0 ± 2.7 mmol/L [P = .003]) and the NAWM (5.75 ± 2.1 vs 9.92 ± 2.7 mmol/L [P = .005]). Patients’ thalamic Cr = 3.69 ± 0.8 versus 5.43 ± 1.2 mmol/L and Cho = 1.05 ± 0.3 versus 1.43 ± 0.4 mmol/L, as well as NAWM Cr = 3.70 ± 1.4 versus 5.20 ± 1.6 mmol/L and Cho = 1.03 ± 0.5 versus 1.40 ± 0.4 mmol/L, levels were also lower than controls’, but neither difference reached the level of statistical significance. No relationships were found between cerebral metabolite levels and ambulation index (AI) or age at disease onset.
Discussion
To the best of our knowledge, this is the first time that brain metabolism of late-onset GM2G has been investigated by using 1H-MR spectroscopy. The current study showed a diffuse pattern of neuronal/axonal involvement in these patients both infra- and supratentorial brain structures with and without MR imaging visible changes, respectively.
Because the most striking radiologic feature in this disease is cerebellar atrophy, we extracted and compared one voxel from the 2D array in each of the patients and the controls, as shown in Fig 1. Because we could not segment the CSF fraction in these voxels, we can only reason that, if it were partial CSF volume contamination, the same percentage level losses for all 3 metabolites should be seen. In the cerebellum of 4/8 patients, however—patients 1, 3, 5, and 6 in Table 1—the disproportionate loss of NAA and Cr compared with Cho could not be explained by such partial volume alone. Therefore, it probably reflects a greater neuronal loss in the remaining tissue. In the other 5 patients, proportional decline of all 3 metabolites reflects CSF partial volume (in contrast to Fig 1) from severe atrophy, which exceeded 75%. Such substantial tissue loss may make differential level change detection difficult by being at or below the sensitivity of the method. For example, looking for 15% change in the remaining 25% of cerebellar tissue in a voxel requires ∼3.5% sensitivity, below the ±5%–10% reported for 1H-MR spectroscopy (28). Because in GM2G demyelination is secondary to neuronal cell injury, this relatively lower Cho loss finding is in line with the known pathogenesis of this disease.
Supratentorial regions of these patients exhibited a diffuse pattern of neuronal/axonal involvement, reflected by a significant (∼40%) reduction of NAA in both the thalamus and occipital white matter, which were otherwise both unremarkable on MR imaging. Because the late-onset form of the disease is milder and the patients survive longer after diagnosis, only very few cases have been studied postmortem (5, 10, 29–32). Nevertheless, the neuropathologic features have consistently shown marked loss of both Purkinje and granul cells in the cerebellum, as well as widespread neuronal GM2 storage throughout the neuroaxis, which is usually more pronounced in the deep nuclear structures, thalamus, brain stem, and spinal anterior horn cells than in the cerebral cortex (5, 10, 29–32). These swollen storage neurons contain characteristic periodic acid-Schiff–positive GM2 inclusions, which are generally known as membranous cytoplasmic bodies (MCB). The progression of this neuronal GM2 storage leads to perikaryal enlargement, ectopic dendritogenesis, and the expansion of axon hillocks (meganeurites) (10). It has been speculated that (1) neuronal storage leads directly to cell death, because metabolites of the storage lipid are toxic to neurons, and (2) the abnormal ectopic dendrites and morphologic changes in storage neurons affect their function (33).
Although NAA is widely considered to be a marker of neuronal loss or degeneration, experimental and clinical studies suggest that it could also be a marker of damage. Its decrease, therefore, could also be due to subclinical metabolic neuronal dysfunction rather than loss (34, 35). These 2 pathologic processes (dysfunction and loss), however, are not mutually exclusive. Although the pathogenetic mechanism detrimental to neurons is largely unknown, it is likely that cell loss in supratentorial structures is milder and slower than in the cerebellum. Therefore, neuronal loss might be masked by the swelling of surviving neurons and by the proliferation of ectopic dendrites, thus resulting in the absence of macroscopic MR imaging–visible atrophy. The decrease of Cr (∼30%) and Cho (∼26%) in our patients seems to support the hypothesis of neuronal loss in addition to dysfunction. Because neurons also contain Cr and Cho, neuronal loss would be expected to lead to a decline in those 2 metabolites in addition to the decrease in NAA. Furthermore, the presence of MCBs in astrocytes (33) suggests that glial cells might be involved in the same pathologic process contributing to Cr and Cho decrease. The decrease of Cho is in line with the results of a recent study with 31phosphorus (31P) MR spectroscopy, which reported a decrease of phosphodiesters and membrane-bound phosphates in a patient with late-onset GM2G (36). Unlike our patients, the level of Cr was normal in their case. Because only phosphocreatine is detectable on the 31P spectrum, whereas the Cr peak of a proton spectrum comprises creatine plus phosphocreatine, we believe that the decrease of Cr in our patients is likely to be due to a decrease of creatine rather than phosphocreatine.
The metabolic decline in NAWM is not surprising if we consider that neurons and myelin sheaths are interdependent; loss of one will eventually lead to the destruction of the other. Therefore, axons of neurons undergoing ganglioside storage will not be spared, and focal swellings, “spheroids,” or neuroaxonal dystrophy will eventually lead to Wallerian degeneration (37). Furthermore, because 70% of the myelin dry weight consists of lipids (38) and because sequestering of GM2 gangliosides is accompanied by secondary trapping of other substrates, including phospholipids and cholesterol (37), the decrease of Cho in our patients might also reflect abnormalities in the myelin structure.
The lack of correlation between the metabolite levels and the AI is not entirely unexpected. First, the cohort was small, and the AI was the only clinical rating score available. It is of interest, however, that patients 5 and 6, whose MR imaging findings were relatively normal, presented very mild neurologic dysfunctions. Second, our spatial resolution and 2D coverage precluded probing more potentially informative anatomic structures, possibly limiting the strength of our clinical-metabolic correlations. Finally, the heterogeneity of causal mutation may have contributed to the lack of relationship between age of onset and disease severity as assessed by the functional ambulatory test. Nevertheless, our study suggests that in late-onset GM2G neuronal/axonal injury is both diffuse and widespread, with changes detectable beyond the MR imaging-visible cerebellar atrophy. This might partially explain the recent findings of risk of impairment in executive functioning and memory in late-onset GM2G patients (6). Although cognitive deficits were partially attributed to cerebellar atrophy, no relationship was found between this finding and the degree of cerebellar dysfunction.
The ability of 1H-MR spectroscopy to detect abnormalities that precede MR imaging changes also has a practical implication: to quantify objectively the extent of neuroaxonal degeneration in patients with signs of neurologic deterioration and supratentorial normal MR imaging. An early diagnosis for this disease is particularly important, because preclinical studies in a mouse model of Tay-Sachs disease has shown that substrate reduction therapy prevents ganglioside storage in the CNS, reducing neurologic deficits and slowing disease progression (39, 40). Because of residual catabolic enzyme activity, patients with late-onset GM2G are the best candidates to receive substrate reduction therapy, and therefore the NAA level might represent a useful surrogate marker to monitor responses to the treatment.
Conclusion
1H-MR spectroscopy is both sensitive and specific to neuroaxonal damage in late-onset GM2G patients, even in the absence of radiologic abnormalities on conventional MR imaging. Because ganglioside accumulation can be reduced by pharmacologic agents, 1H-MR spectroscopy might indeed be a sensitive and specific technique for detecting and quantifying the neuroaxonal injury status and monitoring the response to current and emerging treatments. Therefore, more extensive MR spectroscopy studies to explore larger brain regions, including subcortical frontal white matter and cortical gray matter, are necessary to elucidate the metabolic correlates of neurologic and cognitive deficits in GM2G patients.
Footnotes
This work was supported by National Institutes of Health grants EB01015, NS051623, NS39135, and NS050520, and by Celltech Group PLC, Berkshire, United Kingdom.
References
- Received December 3, 2004.
- Accepted after revision February 11, 2005.
- Copyright © American Society of Neuroradiology
In this issue


Jump to section
Related Articles
Cited By...
- Deep Learning Cerebellar Magnetic Resonance Imaging Segmentation in Late-Onset GM2 Gangliosidosis: Implications for Phenotype
- Tay-Sachs and Sandhoff Diseases: Diffusion tensor imaging and correlational fiber tractography findings differentiate late-onset GM2 Gangliosidosis
- The landscape of functional brain network impairments in late-onset GM2 gangliosidosis
- Relationship between neurochemical concentrations and neurofunctional measures in late-onset GM2 gangliosidosis