
Abstract
BACKGROUND AND PURPOSE: In subjects who are performing no prescribed cognitive task, functional connectivity mapped with MR imaging (fcMRI) shows regions with synchronous fluctuations of cerebral blood flow. When specific tasks are performed, functional MR imaging (fMRI) can map locations in which regional cerebral blood flow increases synchronously with the performance of the task. We tested the hypothesis that fcMRI maps, based on the synchrony of low-frequency blood flow fluctuations, identify brain regions that show activation on fMRI maps of sensorimotor, visual, language, and auditory tasks.
METHODS: In four volunteers, task-activation fMRI and functional connectivity (resting-state) fcMRI data were acquired. A small region of interest (in an area that showed maximal task activation) was chosen, and the correlation coefficient of the corresponding resting-state signal with the signal of all other voxels in the resting data set was calculated. The correlation coefficient was decomposed into frequency components and its distribution determined for each fcMRI map. The fcMRI maps were compared with the fMRI maps.
RESULTS: For each task, fcMRI maps based on one to four seed voxel(s) produced clusters of voxels in regions of eloquent cortex. For each fMRI map a closely corresponding fcMRI map was obtained. The frequencies that predominated in the cross-correlation coefficients for the functionally related regions were below 0.1 Hz.
CONCLUSION: Functionally related brain regions can be identified by means of their synchronous slow fluctuations in signal intensity. Such blood flow synchrony can be detected in sensorimotor areas, expressive and receptive language regions, and the visual cortex by fcMRI. Regions identified by the slow synchronous fluctuations are similar to those activated by motor, language, or visual tasks.
Slow fluctuations of regional cerebral blood flow characterize the normal mammalian brain when it is performing no prescribed task (1, 2). In functionally related regions of the brain, even in those regions separated by substantial distances, these fluctuations are synchronous. The synchrony of the blood flow fluctuations in functionally related brain regions implies the existence of neuronal connections that facilitate coordinated activity. To describe this interdependence of functionally related brain regions, the term functional connectivity has been used.
While functional connectivity has been studied by means of electrodes placed in the brain (3–10), by radioisotopes administered intravenously (11–13), and by EEG (14), functional connectivity can now be studied with functional MR imaging (fMRI). Functionally related regions of the brain have been identified by means of their synchronous fluctuations on fMRI studies (15–17). The highly correlated fluctuations in signal intensity in fMRI reflect synchronous changes in the blood oxygen–level dependent (BOLD) effect in functionally related brain regions. Studies with functional connectivity MR imaging (fcMRI) provide a new means of measuring the interdependency of brain regions.
fcMRI uses rapidly acquired images to map the location of changing signal intensity in the brain, as conventional fMRI uses the same technique to map the location of increased blood flow when a stimulus is applied or a cognitive task is performed. In fMRI, signal intensity changes temporally correlated with the performance of a task are identified to localize hemodynamic changes resulting from the task or the stimulus. In fcMRI, regions of synchronous blood flow change are detected to map functionally connected regions. Synchronous fluctuations in signal intensity in the brain are used to examine the strength of neural connections between different brain regions while they are not activated by a specific task. For the fcMRI study, the subject refrains from any cognitive activity as much as possible and receives no experimental stimuli from the investigator. Studies with fcMRI have been used to show connectivity in motor, auditory, and visual cortices in the brain (13, 15–18). Data acquisition using fcMRI provides a means to obtain functional connectivity noninvasively in the human brain.
While the feasibility of fcMRI has been demonstrated, methods are under investigation and their reliability is unknown. Functional connectivity measurements may be subject to artifacts resulting from bulk motion and fluctuations (or aliases) in signal intensity due to cardiac or respiratory cycles. Also, the resting state cannot be specifically defined or controlled during data acquisition and might be quite different during different scan sessions in the same subject.
The purpose of this study was to obtain fcMRI maps based on slow periodic fluctuation in signal intensity and compare them with fMRI maps of activation. For this purpose we derived an expression for the spectral distribution of the cross-correlation coefficient. The spectral decomposition of the correlation coefficient showed which frequencies contribute to interregional connectivity and that only frequencies less than 0.1 Hz contribute significantly to interregional functional connectivity. Although these results may have been assumed, they have not to our knowledge been reported for fcMRI. We compared functional connectivity MR imaging (fcMRI) maps with functional MR imaging (fMRI) activation maps for sensorimotor, language, auditory, and visual tasks in a series of volunteers.
Methods
Four volunteers between the ages of 20 and 40 years, claiming to be in good health with no history of neurologic illness, were enrolled after consent was obtained according to institutional regulations. Using a 1.5-T commercial MR scanner equipped with high-speed gradients, we obtained high-resolution whole-brain anatomic images with 2D multislice, spin-echo sequences in the coronal plane with the following parameters: 500/8 (TR/TE), 18 slices, 256 × 128 matrix, 24-cm field of view (FOV), 7-mm section thickness with a 2-mm gap. In addition, a 3D spoiled gradient-recalled whole-brain volume scan was acquired in the axial plane with the following parameters: 21/7, 124 slices, 256 × 128 matrix, 40° flip angle, 24-cm FOV, 1.2-mm section thickness with no gap. The subject's head was positioned within a prototype quadrature bird-cage coil specifically developed for functional imaging of the brain. Foam padding was provided for comfort and to minimize head movements. For fMRI, a series of 148 time frames was acquired with single-shot gradient-recalled echo-planar imaging in the coronal plane. For fcMRI, the number of time frames was increased to 260. In each series, the images belonging to the first four time frames were discarded because the MR signal was not stationary. Technical parameters for these acquisitions were as follows: 2000/50, 18 slices, 64 × 64 matrix, 90° flip angle, 24-cm FOV, 125-kHz receiver bandwidth, 7-mm section thickness with a 2-mm gap. Voxel dimensions were 3.75 × 3.75 × 7 mm (x,y,z). The cardiac and respiratory rates were monitored using a pulse oximeter and a flexible respiratory belt.
For task activation, the subject performed a specific task for four 32-second periods, each separated by 32 seconds of rest. Each volunteer performed each of four tasks: finger tapping, silent word generation, listening to text, and viewing of a screen with an alternating checkerboard pattern. These tasks have been described in detail elsewhere (19–24). In brief, the finger-tapping task was a self-paced apposition of the thumb and other fingers on cue from the investigator. For the word-generation task, the subject was instructed to think of as many words as possible that begin with a specific letter cued by the investigator. For the text-listening task, the subject listened to a recorded text. For visual cortex activation, the subject viewed a screen on which an alternating checkerboard pattern was presented with a frequency of 8 Hz. During fcMRI, the subject was instructed to rest, be as motionless as possible, keep the eyes closed, and perform no specific cognitive exercise during the entire acquisition (resting acquisition). fcMRI was performed after fMRI.
The echo-planar raw data were filtered in the spatial frequency domain with a low-pass Hanning filter to increase signal-to-noise ratio (25). Signal intensities for each acquired slice were time-corrected by using a three-point Hanning filter in the temporal domain (26). Images were checked for motion using a 3D registration program included in automated functional neuroimaging (AFNI; Robert Cox, Medical College of Wisconsin). The study was discarded and repeated if the detected motion gave a displacement larger than 0.4 mm in x, y, or z. Two studies were repeated because of motion.
For fMRI, the time course was analyzed with a locally developed program (27, 28). A least-squares fitting algorithm was used to compare the observed data on a voxel-by-voxel basis to a constant (baseline signal intensity), a ramp (signal drift), and a boxcar function (idealized expected response to the task or stimulus). The boxcar function had unit amplitude and a period matching the on/off cycles of the task or stimulus that was smoothed by convolution with a Poisson function with a 6-second mean to account for hemodynamic delay. The amplitude and the uncertainty of the fit to the boxcar reference function were calculated by least-squares minimization. A t-score was calculated and converted to a z-score. An overall adjusted P value was determined to address levels of significance. All voxels with P less than .05 were merged with coregistered anatomic images.
For fcMRI, “seed” voxels were selected in the rolandic cortex, primary auditory cortex, Broca's area, and striate cortex by referring to the maximum activation seen on the fMRI study. For comparison, several other seed voxels were selected in other regions where the cardiac and respiratory effects were expected to be different. These regions were in the CSF (left lateral ventricle), in a branch of the middle cerebral artery (left sylvian fissure), and in the left jugular vein. The correlation coefficients of the seed voxels and every other voxel in the brain were calculated.
To compute the statistical significance of fcMRI maps, a nonparametric multiple comparisons procedure (29, 30) was designed. This procedure maintained strong control over type 1 errors. To arrive at a null statistic for resting-state data, the time course of the seed voxel or cluster was altered by randomization of the phase of its complex Fourier components, an approach that does not change the power spectrum. The null distribution of correlation coefficients for a particular seed voxel or cluster was then obtained by calculating all possible cross-correlation coefficients between the seed voxel after phase randomization and all other voxels in the brain. This approach gave an assignment of overall adjusted P values to each cross-correlation value when carried out for each seed voxel or cluster. All fcMRI maps were then thresholded at the P = .05 level. The corresponding cross-correlation coefficients (using 256 time frames) were in the range of .35 to .55, depending on the seed voxel or cluster. The degrees of freedom of the seed voxel or cluster as computed by Friston's method (31) were in the range of 10 to 120. Voxels correlating significantly were merged with anatomic images. The locations of the voxels on the fcMRI maps were compared with the location of task activation on the fMRI maps.
The average frequency spectrum of the correlation coefficients was computed for each fcMRI map according to Equation 17 in the Appendix. Briefly, Equation 17 was derived by expressing the voxel time courses in terms of their inverse Fourier transforms and calculating the cross-correlation coefficient in frequency (ie, Fourier) space. The resulting expression defines the average magnitude of each frequency component in an fcMRI map. The so-defined spectral distribution of the correlation coefficient has the property that the sum over all frequencies will yield the average correlation coefficient in an fcMRI map.
Results
Technically adequate task-activation maps were obtained for all volunteers. Activation was identified in the sensorimotor cortices, the supplementary motor areas, the dentate nucleus (finger tapping), the superior temporal lobe (text listening), the left inferior frontal gyrus (word generation), and the striate cortex (screen viewing). Other regions of activation were identified in some subjects.
In each subject, the fcMRI maps based on a seed voxel from each of four eloquent brain locations resembled the task-activation maps for the region. On average, the number of voxels showing functional connectivity in the resting acquisition was more than the number of voxels showing task activation at the P = .05 significance threshold. In general, more slices had voxels that passed the threshold on the fcMRI maps than on the fMRI maps. Some voxels passing threshold on the fcMRI maps were imperfectly correlated with task-activation fMRI maps, but similar regions were denoted by both methods.
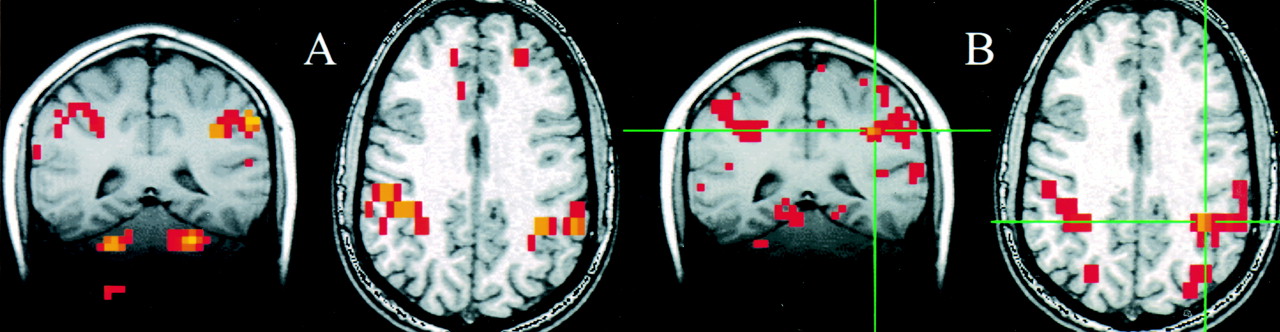
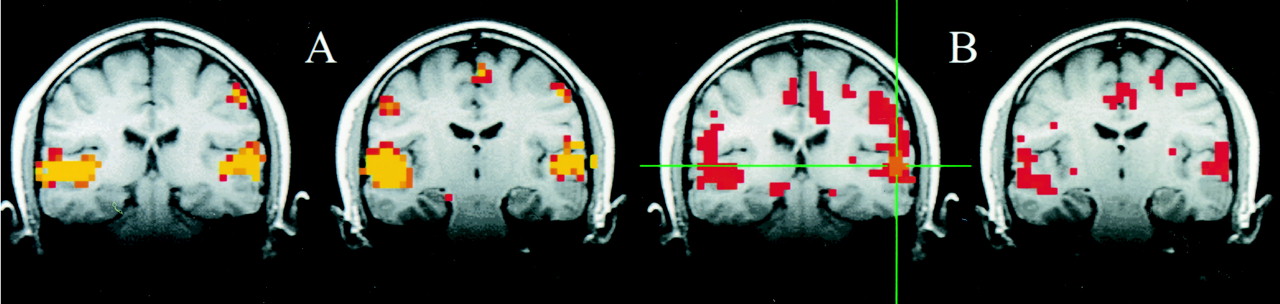
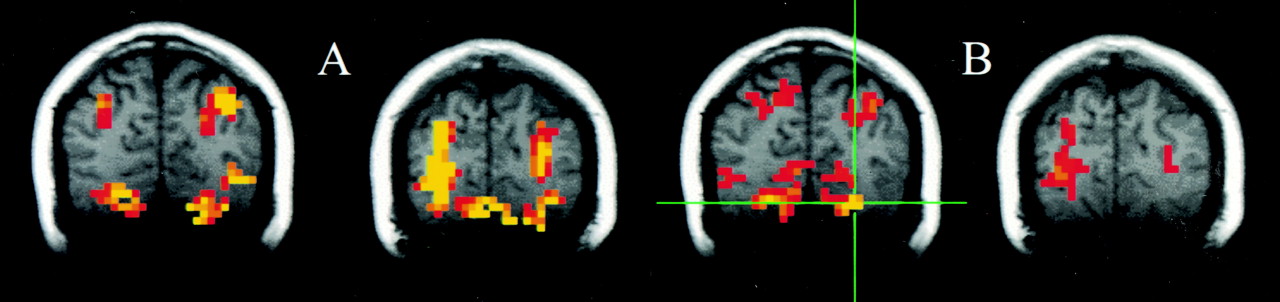
For the seed voxels selected in the sensorimotor cortex, significantly correlated voxels were found in the contralateral and ipsilateral sensorimotor cortex regions. For these regions, the fcMRI map in the resting acquisition resembled the fMRI map of activation produced by the finger-tapping task. Figure 1 shows a typical example of task activation and functional connectivity in the sensorimotor cortex. Functional connectivity with the dentate nucleus in the cerebellum was not observed on the fcMRI map. For a seed voxel selected in the superior temporal gyrus in the region of the auditory cortex, significantly correlated voxels were present in the resting acquisition in the ipsilateral and contralateral auditory cortex regions (Fig 2B), and the locations were similar to the regions activated by text listening (Fig 2A). Figure 3 shows frontal lobe activation in or near Broca's area in a subject performing the text-listening task. An fcMRI map based on a pixel from the activated regions produced a map of functional connectivity that resembled the task-activation map. An fMRI map showing activation in or near Broca's area in a subject performing the word-generation task is shown in Figure 4A. A seed voxel selected in the resting data set produced a functional connectivity map that resembled the task-activation map (Fig 4B). Task-activation and fcMRI maps of the visual cortices also compared well (Fig 5). The checkerboard viewing task produced activation in the striate cortex and related regions (Fig 5A). The fcMRI map, based on a pixel in the striate cortex, produced a similar map (Fig 5B).

A and B, Selected coronal and axial fMRI maps of voxels activated by the bilateral finger-tapping task (A) and of the voxels functionally connected to a seed voxel (crosshairs) in the sensorimotor cortex in a resting acquisition (B). The sensorimotor cortex is identified on both the fMRI and the fcMRI maps. Voxels within the dentate nucleus of the cerebellum were identified with fMRI but not with the functional connectivity study

A and B, Consecutive coronal fMRI maps of voxels activated by a text-listening task (A) and of the voxels functionally connected with a 2 × 2 seed voxel ROI (crosshairs) within the auditory cortex (B). Task activation was evident in the region of the primary and association auditory cortices in the superior temporal lobe. Many of the voxels functionally connected with the seed voxel in the left auditory cortex (crosshairs) have a similar distribution. A few other voxels with lower correlation coefficients (red) were identified outside the auditory cortices. For the connectivity study, data were collected without the patient performing a specific cognitive task

fig 3. A and B, A coronal image showing task activation for the text-listening task (A) and connectivity for a seed voxel (crosshairs) in the left frontal lobe in a resting data set (B). The task produces activation in the superior temporal gyral regions bilaterally and in the left frontal lobe in or near Broca's region. Activation is also identified in the right frontal lobe. The voxels with connectivity to the seed voxel (crosshairs) appear to lie in similar locations. fig 4. A and B, Coronal images showing task activation for the word-generation task (A) and connectivity for the left frontal cortex in the region that showed task activation (B). The task produced activation in the left frontal lobe in or near Broca's area and in the superior temporal lobes bilaterally. The voxels with connectivity to the seed voxel (crosshairs) appear to lie in similar locations to the task activation produced by word generation and to the locations with connectivity in figure 3

A and B, Consecutive coronal images showing task activation for the visual task (A) and connectivity for the visual cortex (B). The task produces activation in the striate cortex region and in the posterior parietal lobes bilaterally. The voxels with connectivity to the seed voxel (crosshairs) appear to lie in similar locations in the striate cortex region and in the posterior parietal lobe
Not every seed voxel selected in a region produced the same map. Some seed voxels, selected from voxels showing considerable activation, produced fcMRI maps with less resemblance to the task-activation map, whereas adjacent voxels produced maps closely resembling the activation map. In some cases, averaging several voxels to produce a time course for cross correlation slightly improved consistency. An fcMRI map closely resembling a task-activation map was obtained when the investigator selected among voxels in regions with maximum task activation. Voxels selected randomly outside regions that were activated by a task did not, in general, show significant correlation with voxels in the sensorimotor, auditory, language, and visual regions.
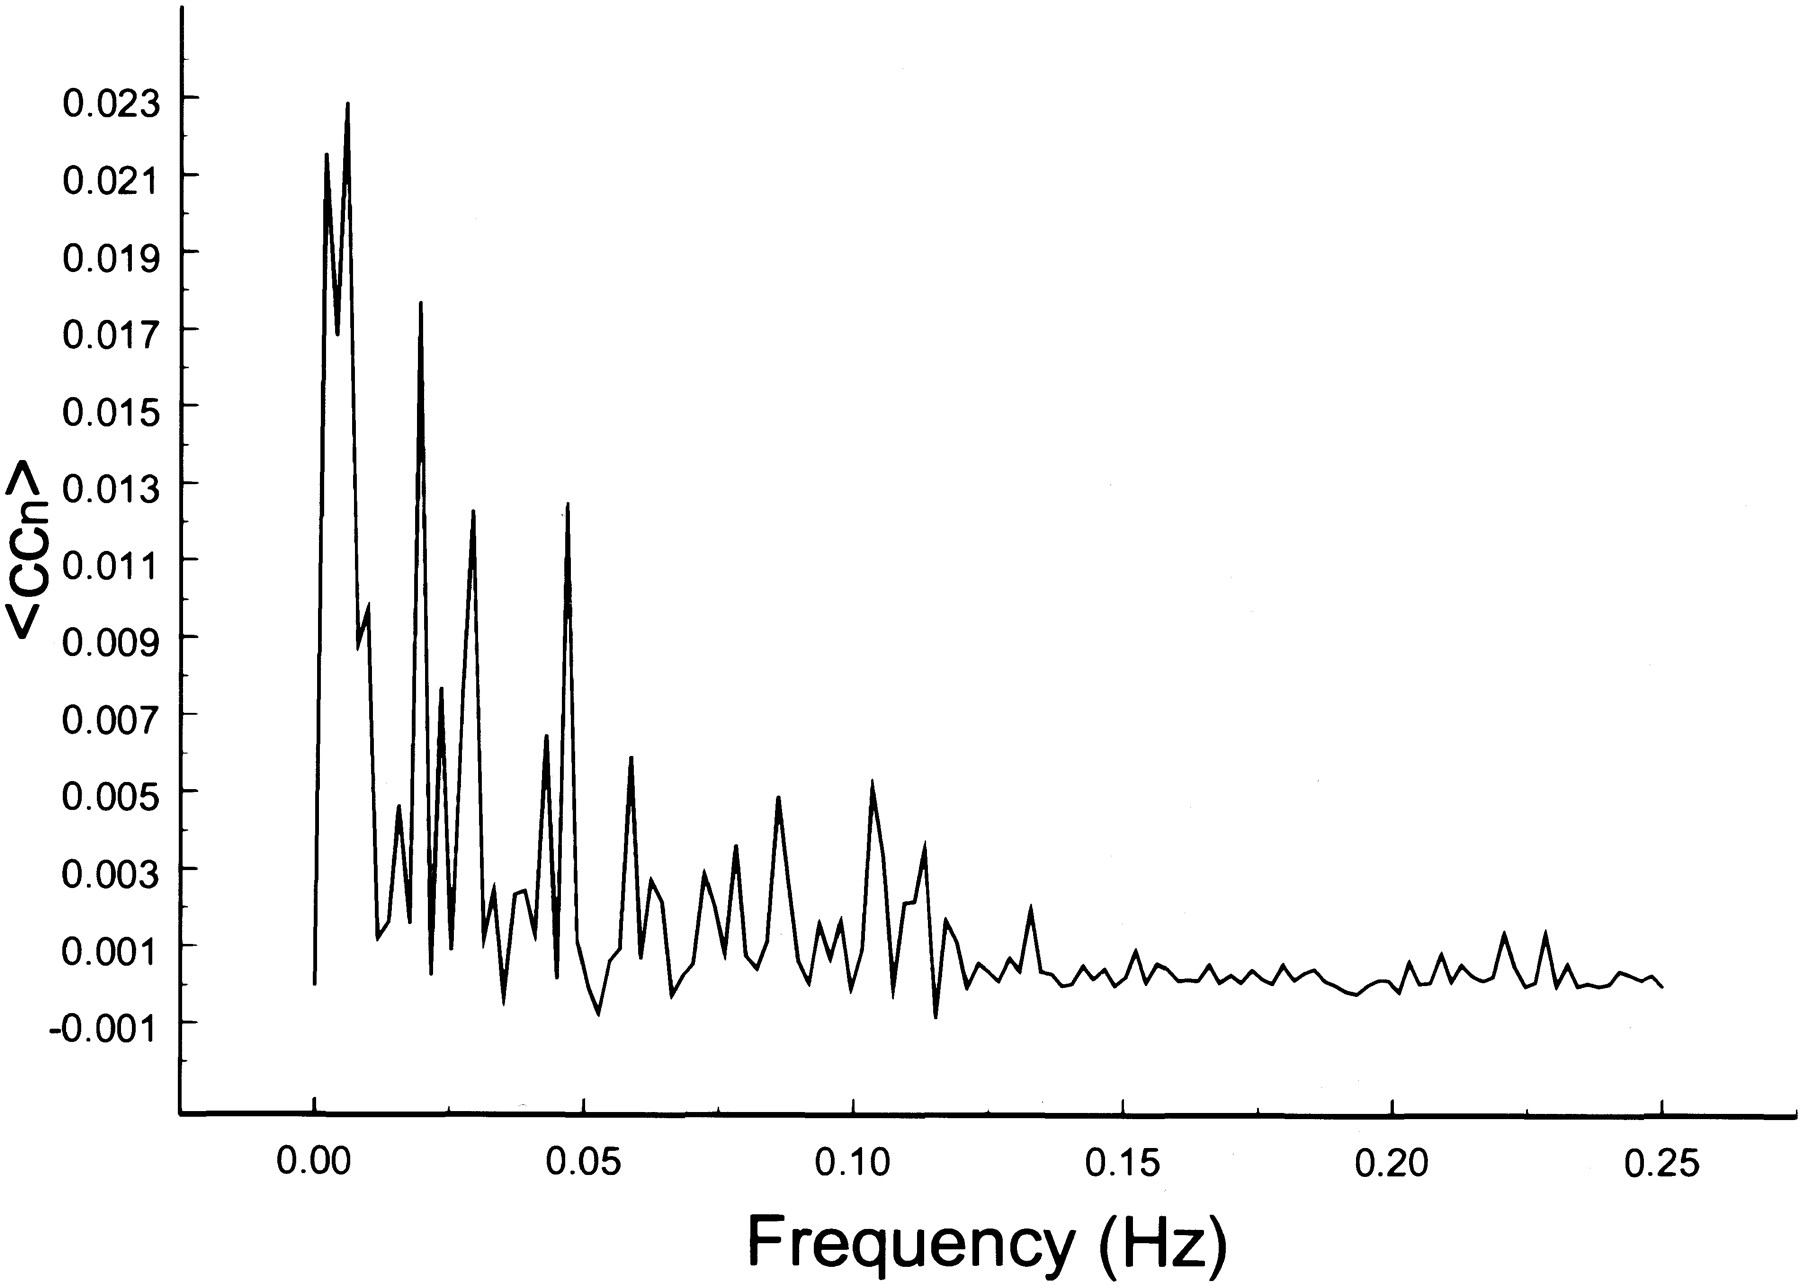
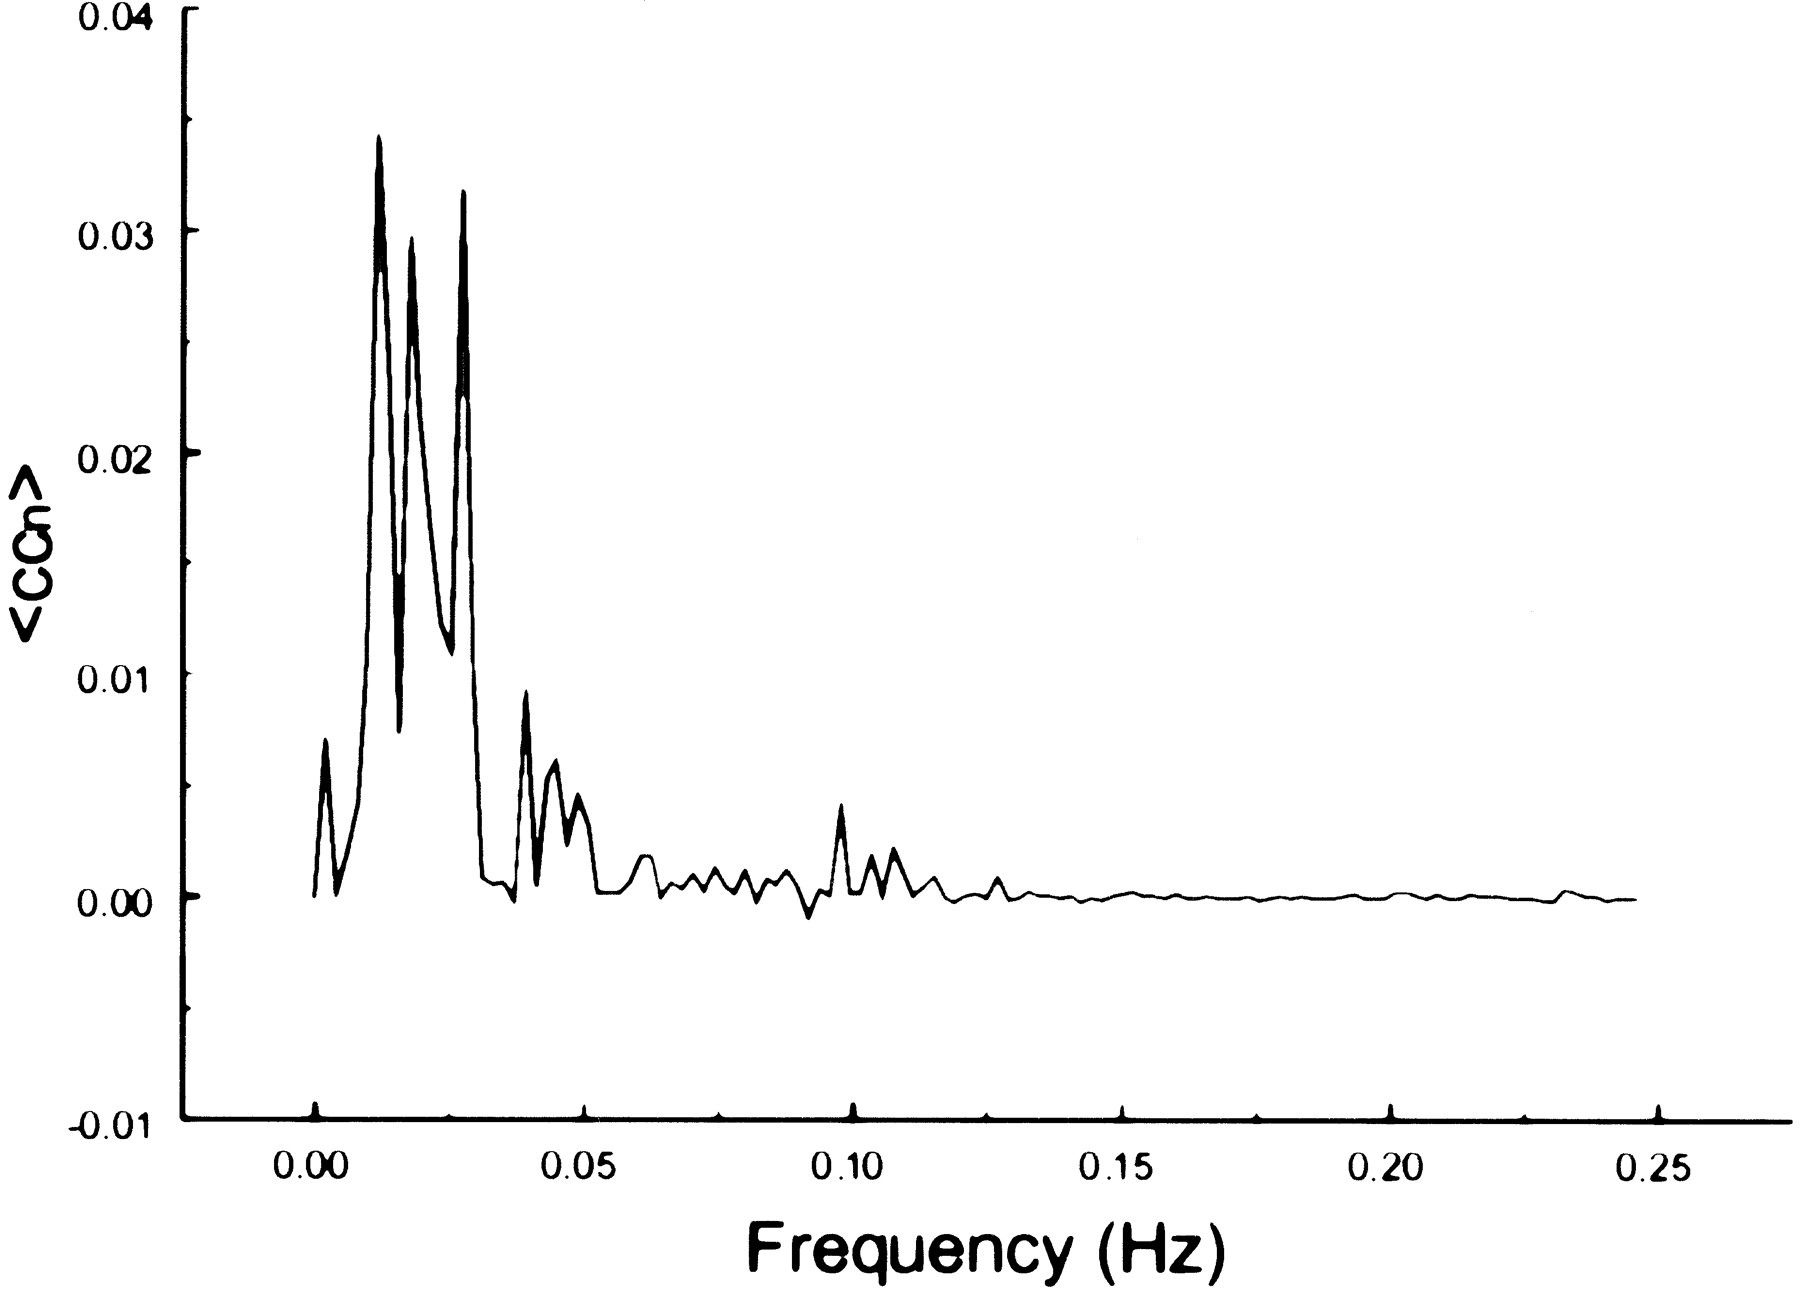
The spectral decomposition analysis for the functional connectivity showed predominantly low frequency contributing to the correlation coefficient in functionally related brain regions (Figs 6–10). The recorded respiratory rate for all volunteers (below 15 breaths per minute for the resting state study with an average of 12 breaths per minute) did not alias into the lower frequency range at TR = 2000. For seed voxels taken from regions containing a major blood vessel or CSF, the spectral distributions of the correlation maps did not display the same predominance of low frequencies. In general, tissue near arteries showed more power in frequencies related to the cardiac cycle whereas tissue near veins showed more evidence of frequencies related to the respiratory cycle (32). For example, a seed voxel in the jugular vein showed a large contribution at a frequency of 0.2 Hz; otherwise, the frequency distribution was about equal across the full range (Fig 11). For a seed voxel from the middle cerebral artery branch, several dominant peaks were present across the full range. In the low-frequency domain (<0.1 Hz), the major contribution came from a peak at 0.002 Hz, whereas in the respiratory frequency range (0.15–0.25 Hz), some contributions from bands centered at 0.19 and 0.24 Hz appeared (Fig 12). A seed voxel representing CSF in the lateral ventricle showed major contributions in the low-frequency range (<0.1 Hz) but also some contributions in the interval between 0.21 and 0.25 Hz (Fig 13).

Spectral decomposition of the average correlation coefficient for interregional connectivity in the motor cortex (same subject as in fig 1). Only frequency components between 0 and 0.05 Hz contribute significantly to the correlation coefficient

Spectral decomposition of the average correlation coefficient for interregional connectivity in the auditory cortex (same subject as in fig 2). Only frequency components less than 0.05 Hz contribute significantly to the correlation coefficient

Spectral decomposition of the average correlation coefficient for interregional connectivity in the prefrontal cortex (same subject as in fig 3). Only the same low frequency components contribute significantly to the correlation coefficient

Spectral decomposition of the average correlation coefficient for interregional connectivity in the prefrontal cortex (same subject as in fig 4). Only the same low-frequency components contribute significantly to the correlation coefficient

Spectral decomposition of the average correlation coefficient for interregional connectivity in the visual cortex (same subject as in fig 5). Only low-frequency components contribute significantly to the correlation coefficient

Spectral decomposition of the average correlation coefficient from a seed voxel in the left jugular vein. Note the relative paucity of frequencies in the 0 to 0.05 Hz range, the spread over many frequencies, and the peak at 0.2 Hz

Spectral decomposition of the average correlation coefficient using a seed voxel in the right middle cerebral artery. Low frequencies do not predominate. Peaks are present at multiple frequencies above 0.05 Hz

Spectral decomposition of the average correlation coefficient using a seed voxel in the left ventricle. Frequencies from 0.025 to 0.075 predominate. Since no BOLD effect can be invoked in CSF, these frequencies represent likely aliased cardiac cycle effects
Discussion
In previous studies, functional connectivity was detected in the sensorimotor cortex (15, 16, 18–20, 22), the auditory cortex/language regions (21), and the visual cortex (23). This study shows that by using only one voxel or a small region of interest (ROI) (four voxels or less) in a region of eloquent cortex, functionally related brain regions can be identified by means of their synchronous slow fluctuations in blood flow in the absence of a prescribed cognitive task. Such blood flow synchrony can be detected in sensorimotor areas, expressive language regions, receptive language regions, and visual cortex by fcMRI.
fcMRI is distinguished from fMRI, which depicts blood-flow changes (activation) temporally correlated with the performance of a task. Tasks such as finger tapping, text listening, word generation, or picture viewing typically produce activation in the sensorimotor cortices, auditory cortices, language cortex, and visual cortex, respectively. The regions identified with fMRI as activated correlate well with regions identified as having functional significance with intraoperative mapping or positron emission tomography. However, the fcMRI and fMRI maps do not correlate perfectly. The regions of brain that have functional connectivity are not necessarily the same as the regions activated by the performance of a task. fcMRI is not a replacement for fMRI. That fMRI and fcMRI identify similar regions of brain has both investigative and practical significance.
We applied a novel, nonparametric statistical method to the fcMRI data in order not to assume a specific probability distribution for the voxel values in the image. In particular, a null hypothesis is not as easily defined for fcMRI maps as for task-activation data. Parametric approaches based on gaussian random fields, which are valid for the analysis of task-activation data, cannot be applied to fcMRI maps, because each seed voxel chosen shows a large variability in autocorrelations of its signal time course. For example, the seed voxels in our study had 10 to 120 degrees of freedom, as calculated by the method of Friston (31), for a series of 256 time frames. To define a proper null hypothesis for fcMRI as a measure of signal randomness or signal nonsynchronicity, our approach was to construct first a function from each seed voxel time course by randomizing the phase of its complex Fourier components. The null distribution of correlation coefficients for a particular seed voxel or cluster was then obtained by calculating all possible cross-correlation coefficients between the seed voxel (or cluster) after phase randomization with all other voxels in the brain. This method retained the frequency content of the seed voxel, since varying only the phase of its complex Fourier components did not change the power spectrum. The obtained P values were very reasonable. Equally thresholded fcMRI and fMRI maps had similar intensity distributions. Our nonparametric method maintained strong control over type 1 errors, meaning that voxels that lacked functional connectivity were detected with a probability, at most, of P = .05 in any region of the brain, regardless of connectivity elsewhere.
The decomposition of the cross-correlation maps into frequency components reveals several interesting facts. Only frequencies less than 0.1 Hz contributed significantly to the correlation coefficient in functionally connected brain regions. This finding is consistent with other reports (15, 16) in which low-frequency fluctuations (<0.1 Hz) in functionally related brain regions showed a high degree of temporal correlation. Because our TR was 2000, it is uncertain how much the aliased cardiac rate contributed to the connectivity. A spectrum for CSF shows several dominant peaks in the low-frequency range, which are very likely due to the cardiac rate. Similarly, in the spectrum of the middle cerebral artery, there is some contribution from frequencies less than 0.1 Hz, possibly due to cardiac aliasing. However, to filter out the cardiac contribution is not trivial because of its bandlike appearance and unknown region of aliasing. The spread of the cardiac rate occurs as a result of normal changes in cardiac frequency during the scan and depends on the resting state of the volunteer. In our studies, the cardiac rate, monitored with a pulse oximeter, varied by approximately three beats per minute, leading to a frequency band rather than a single peak. To estimate the contribution of the cardiac rate to the correlation map, it is necessary to use a short TR so that the cardiac rate does not alias and can easily be identified. A short TR, however, limits the study to a single slice (or a few slices).
On the other hand, at TR = 2000, it is possible to rule out respiratory effects on interregional connectivity. The observed respiratory rate, limited to a narrow region around 0.2 Hz, did not alias in our study. Based on the calculated cross-correlation spectrum, only CSF and blood vessels showed contributions in the respiratory range. We did not find any significant amount of respiratory frequencies contributing to interregional connectivity of motor, language, and visual cortices. The application of finite impulse response filters to exclude respiratory contaminations in the frequency range above 0.1 Hz did not quantify the effect of respiratory aliasing on the correlation map. On the basis of our finding, the correlation map for interregional connectivity appears to be relatively insensitive to the respiratory cycle.
This preliminary result cannot be generalized without further studies. A weakness of the study is the selection bias in choosing a seed voxel. If the seed voxels partially overlap with CSF or a blood vessel, results can vary substantially between voxels selected from within a small region in eloquent cortex. In our study, the cross-correlation analysis was not tabulated for every voxel in the regions that showed significant activation on task-acquired fMRI maps. Whether functional connectivity can be measured consistently and routinely in patients with neurologic disorders is under investigation. Also, individual variation and the physiology of the functional connectivity in the human brain have not yet been determined. The significance of regions that are identified in one and not the other mapping technique needs more study.
Nevertheless, our method may be useful for evaluating the strength of particular neuronal connections in healthy individuals and in patients with neurologic disorders. The fluctuations in signal intensity, on which fcMRI maps are based, are affected by blood oxygen and carbon dioxide concentrations (33). Their application to neurologic disorders that are thought to stem from disconnection syndromes may be especially important (34).
Conclusion
We found a high degree of temporal correlation of physiological fluctuations between functionally related neuronal sites in subjects who were performing no specified cognitive task. Technically adequate correlation maps showing interregional connectivity in the motor cortex, the expressive and receptive language areas, and the visual cortex were found by selecting only a small ROI (one to four voxels) in eloquent cortex as a probe for functional connectivity. Our observations indicate that low-frequency fluctuations are a general phenomenon in eloquent cortex; therefore, fcMRI may be a useful method for evaluating the strength of neuronal connections in healthy individuals and in patients with neurologic disorders.
Appendix: Derivation of the Spectral Decomposition of the Correlation Coefficient
The correlation coefficient can be decomposed into frequency components by Fourier transformation of the voxel time courses. Let f(t) and g(t) represent the signal intensity of two voxels as a function of time, defined over the interval 0, N. Furthermore, the mean signal of each function has been subtracted. Using the inverse Fourier transform, we can write 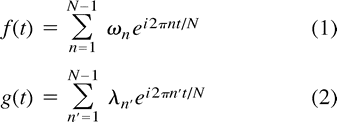 where N−1 refers to the number of frequency components and ωn, λn to the complex-valued frequencies of the Fourier transform of f(t) and g(t), respectively. Note, that ω0 = λ0 = 0 in our case. The correlation coefficient, cc, involving f(t) and g(t) is defined as
  where the denominator, D, is given by
Inserting Equations 1 and 2 into Equation 3 yields 
Rearranging the order of summation and combining terms gives  The sum over t simplifies owing to the orthogonality condition
 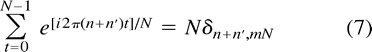 where δi,j is the Kronecker delta symbol and m can be any integer. Since in our case
  m = 1 is the only possibility in Equation 7 for a nonvanishing contribution. Hence, we can write Equation 6 as
 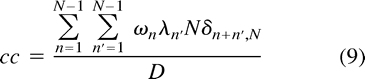 which simplifies to
 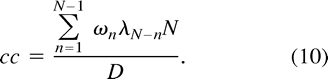 Since the original voxel-time courses are real-valued functions, the complex Fourier components ωn, λn satisfy the symmetry condition
 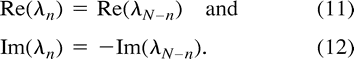 The expression for the correlation coefficient in Equation 10 becomes
  and hence
 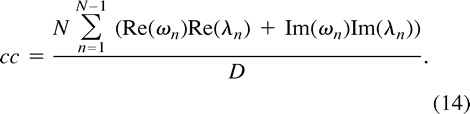 We are now able to define the spectral decomposition of the correlation coefficient by
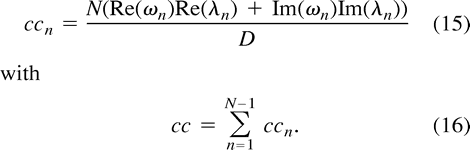
In the following we include superscripts to label the two voxels that are correlated. For an ROI, the average spectral decomposition of the correlation coefficient between a seed voxel, s, and all other voxels in the brain, j, can be defined by 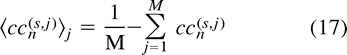 where the upper indexes s and j refer to the seed voxel and to all other voxels on the fcMRI map, respectively. The index j labels all voxels in the brain that have significant correlation; that is,
  for all j voxels on the fcMRI map. The term thr represents a threshold at the appropriate significance level.
Footnotes
↵1 Address reprint requests to Victor M. Haughton, MD, Department of Radiology, The University of Wisconsin Hospitals and Clinics, 600 Highland Ave, Madison, WI 53792.
References
- Received July 6, 1999.
- Accepted after revision April 11, 2000.
- Copyright © American Society of Neuroradiology
In this issue


Jump to section
Related Articles
Cited By...
- Dynamic fusion of structural and functional connectivity via joint connectivity matrix ICA
- Aging and the Spectral Properties of Brain Hemodynamics
- Prediction of dynamic balance state and recovery following stroke using fMRI graph analysis
- Unraveling the Neural Landscape of Mental Disorders using Double Functional Independent Primitives (dFIPs)
- Functional brain network dynamics of brooding in depression: insights from real-time fMRI neurofeedback
- Altered dynamic functional network connectivity in rheumatoid arthritis associated with peripheral inflammation and neuropsychiatric disorders
- Functional connectivity across the human subcortical auditory system using an autoregressive matrix-Gaussian copula graphical model approach with partial correlations
- Resting-state functional connectivity in children cooled for neonatal encephalopathy
- How can graph theory inform the dual-stream model of speech processing? a resting-state fMRI study of post-stroke aphasia
- Efficient estimation of time-dependent functional connectivity using Structural Connectivity constraints
- Single Ventricle Reconstruction III: Brain Connectome and Neurodevelopmental Outcomes: Design, Recruitment, and Technical Challenges of a Multicenter, Observational Neuroimaging Study
- Resting state networks of awake adolescent and adult squirrel monkeys using ultra-high field (9.4T) functional magnetic resonance imaging
- Efficient estimation of time-dependent functional connectivity using Structural Connectivity constraints
- Joint cmICA: auto-linking of structural and functional connectivity
- Acquisition and processing methods of whole-brain layer-fMRI VASO and BOLD: The Kenshu dataset
- A structure-function substrate of memory for spatial configurations in medial and lateral temporal cortices
- Resting-State Functional Networks of Different Topographic Representations in the Somatosensory Cortex of Macaque Monkeys and Humans
- A Paradigm for Measuring Resting State Functional Connectivity in Young Children Using fNIRS and Freeplay
- MOU-EC: model-based whole-brain effective connectivity to extract biomarkers for brain dynamics from fMRI data and study distributed cognition
- Trait-like variants in human functional brain networks
- Studying the precuneus reveals structure-function-affect correlation in long-term meditators
- The Relationship between BOLD and Neural Activity Arises from Temporally Sparse Events
- Large-scale intrinsic connectivity is consistent across varying task demands
- Extracting orthogonal subject- and behavior-specific signatures from fMRI data using whole-brain effective connectivity
- Analysis of fMRI data using noise-diffusion network models: a new covariance-coding perspective
- Stereotypical modulations in dynamic functional connectivity explained by changes in BOLD variance
- Effective connectivity inferred from fMRI transition dynamics during movie viewing points to a balanced reconfiguration of cortical interactions
- Resting State Networks in empirical and simulated dynamic functional connectivity
- Impact of gray matter signal regression in resting state and language task functional networks
- State-dependent modulation of functional connectivity in early blind individuals
- High spatial correspondence at a columnar level between activation and resting state fMRI signals and local field potentials
- Brain Age: A State-Of-Mind? On the Stability of Functional Connectivity across Behavioral States
- Functional connectivity arises from a slow rhythmic mechanism
- Imperceptible Somatosensory Stimulation Alters Sensorimotor Background Rhythm and Connectivity
- Noninvasive Functional and Anatomical Imaging of the Human Medial Temporal Lobe
- Intrinsically organized resting state networks in the human spinal cord
- Low-frequency calcium oscillations accompany deoxyhemoglobin oscillations in rat somatosensory cortex
- Time-varying functional network information extracted from brief instances of spontaneous brain activity
- Reorganization of Functional Connectivity of the Language Network in Patients with Brain Gliomas
- Unravelling the Intrinsic Functional Organization of the Human Lateral Frontal Cortex: A Parcellation Scheme Based on Resting State fMRI
- Functional Connectivity during Resting-State Functional MR Imaging: Study of the Correspondence between Independent Component Analysis and Region-of-Interest-Based Methods
- Prefrontal Transcranial Direct Current Stimulation Changes Connectivity of Resting-State Networks during fMRI
- Global Functional Connectivity Deficits in Schizophrenia Depend on Behavioral State
- Comparison of Hypothesis- and a Novel Hybrid Data/Hypothesis-Driven Method of Functional MR Imaging Analysis in Patients with Brain Gliomas
- Functional Connectivity MR Imaging of the Language Network in Patients with Drug-Resistant Epilepsy
- Growing Together and Growing Apart: Regional and Sex Differences in the Lifespan Developmental Trajectories of Functional Homotopy
- Neural basis of global resting-state fMRI activity
- Investigating the Functional Heterogeneity of the Default Mode Network Using Coordinate-Based Meta-Analytic Modeling
- Correspondence of the brain's functional architecture during activation and rest
- Decoupling of the brain's default mode network during deep sleep
- Distinct Cerebellar Contributions to Intrinsic Connectivity Networks
- The Blood Oxygen Level-Dependent Functional MR Imaging Signal Can Be Used to Identify Brain Tumors and Distinguish Them from Normal Tissue
- Regional Variation in Interhemispheric Coordination of Intrinsic Hemodynamic Fluctuations
- Resting-state networks in the infant brain
- Dissociable Intrinsic Connectivity Networks for Salience Processing and Executive Control
- Consistent resting-state networks across healthy subjects
- Spontaneous neuronal activity distinguishes human dorsal and ventral attention systems
- From The Cover: The human brain is intrinsically organized into dynamic, anticorrelated functional networks
- Frequencies Contributing to Functional Connectivity in the Cerebral Cortex in ""Resting-state"" Data