
Abstract
BACKGROUND AND PURPOSE: Biomarkers have been required for diagnosing early Alzheimer disease. We assessed the utility of hippocampal diffusion parameters for diagnosing Alzheimer disease pathology in mild cognitive impairment.
MATERIALS AND METHODS: Sixty-nine patients with mild cognitive impairment underwent both CSF measurement and multi-shell diffusion imaging at 3T. Based on the CSF biomarker level, patients were classified according to the presence (Alzheimer disease group, n = 35) or absence (non-Alzheimer disease group, n = 34) of Alzheimer disease pathology. Neurite orientation dispersion and density imaging and diffusion tensor imaging parametric maps were generated. Two observers independently created the hippocampal region of interest for calculating histogram features. Interobserver correlations were calculated. The statistical significance of intergroup differences was tested by using the Mann-Whitney U test. Logistic regression analyses, using both the clinical scale and the image data, were used to predict intergroup differences, after which group discriminations were performed.
RESULTS: Most intraclass correlation coefficient values were between 0.59 and 0.91. In the regions of interest of both observers, there were statistically significant intergroup differences for the left-side neurite orientation dispersion and density imaging–derived intracellular volume fraction, right-side diffusion tensor imaging-derived mean diffusivity, left-side diffusion tensor imaging–derived mean diffusivity, axial diffusivity, and radial diffusivity (P < .05). Logistic regression models revealed that diffusion parameters contributed the most to discriminating between the groups. The areas under the receiver operating characteristic curve for the regions of interest of observers A/B were 0.69/0.68, 0.69/0.68, 0.73/0.68, 0.71/0.68, and 0.68/0.68 for the left-side intracellular volume fraction (mean), right-side mean diffusivity (mean), left-side mean diffusivity (10th percentile), axial diffusivity (10th percentile), and radial diffusivity (mean).
CONCLUSIONS: Hippocampal diffusion parameters might be useful for the early diagnosis of Alzheimer disease.
ABBREVIATIONS:
- AD
- axial diffusivity
- AzD
- Alzheimer disease
- FA
- fractional anisotropy
- ICVF
- intracellular volume fraction
- MCI
- mild cognitive impairment
- MD
- mean diffusivity
- NODDI
- neurite orientation dispersion and density imaging
- ODI
- orientation dispersion index
- RD
- radial diffusivity
- Viso
- isotropic volume fraction
Identifying Alzheimer disease (AzD) at the earliest stage would offer better disease management and greater therapeutic opportunities. In this regard, great attention has been paid to the evaluation of mild cognitive impairment (MCI).1 Clinically, it is difficult to exclude the presence of AzD pathologic changes in cognitively normal subjects and also to discriminate AzD pathology that is associated with a risk of AzD development from non-AzD pathology that is related to other types of dementia in patients with MCI. Therefore, it is desirable to identify quantitative biologic markers that are specific to AzD.
Currently, the most promising biomarkers are CSF tau proteins and β-amyloid 42 (Aβ42) peptides. Of these, a tau pathology model in AzD has been suggested, and the utility of the CSF phosphorylated tau (P-tau) level has been reported as a predictor of disease progression in AzD with hippocampal atrophy.2 In addition, a decreased Aβ42 level with amyloid deposition in conjunction with an elevated tau level, especially P-tau, differentiates patients with AzD from normal subjects and from patients with other neurologic conditions with high accuracy.3 Previous studies have reported these changes in patients with MCI who later developed AzD.4,5 Accordingly, the CSF P-tau/Aβ42 ratio might be a useful biomarker of AzD pathologic changes in MCI and might predict both the occurrence and the timing of the conversion of MCI to AzD.6,7
Previous diffusion MR imaging studies of AzD-related pathologies have applied a tensor model, termed DTI, to investigate changes in neuronal cytoarchitecture.8,9 However, the common diffusion tensor model is based on the assumption of a simple underlying Gaussian diffusion process.10 In contrast, the neurite orientation dispersion and density imaging (NODDI) technique uses a non-Gaussian biophysical model that has a higher sensitivity to non-monoexponential diffusion in microstructural features of the brain, such as neurite density and dendritic structure.10,11 NODDI assumes a 3-compartment (intracellular, extracellular, and CSF) biophysical tissue model for each voxel, enables the detection of the microstructure of dendrites and axons, and offers greater specificity than that offered by DTI by separating the volume fraction of Gaussian isotropic diffusion, thereby representing the freely diffusing water, such as CSF, from the neural tissue.12
The greater focus on the medial temporal lobe of the brain with diffusion MR imaging improves the detection of the presence and progression of cognitive disorders, such as AzD. Functionally related regions in the medial temporal lobe, particularly the entorhinal cortex, perirhinal cortex, and parahippocampal cortex, are tightly interconnected with the hippocampus as parts of the medial temporal memory networks.13 The perirhinal and entorhinal cortices are among the earliest sites of neurodegeneration in AzD.13 Similarly, hippocampal subregions are variably affected by AzD pathology.14 Accordingly, we hypothesized that hippocampal analysis via diffusion MR imaging could provide indirect and highly sensitive measurements of AzD pathology in MCI. Therefore, our aim was to assess the clinical application of hippocampal histogram features of diffusion metrics as imaging biomarkers for the CSF-biomarker-aided diagnosis of early-stage AzD.
MATERIALS AND METHODS
Our Institutional Review Board approved this study, and all participants provided written informed consent.
Patients
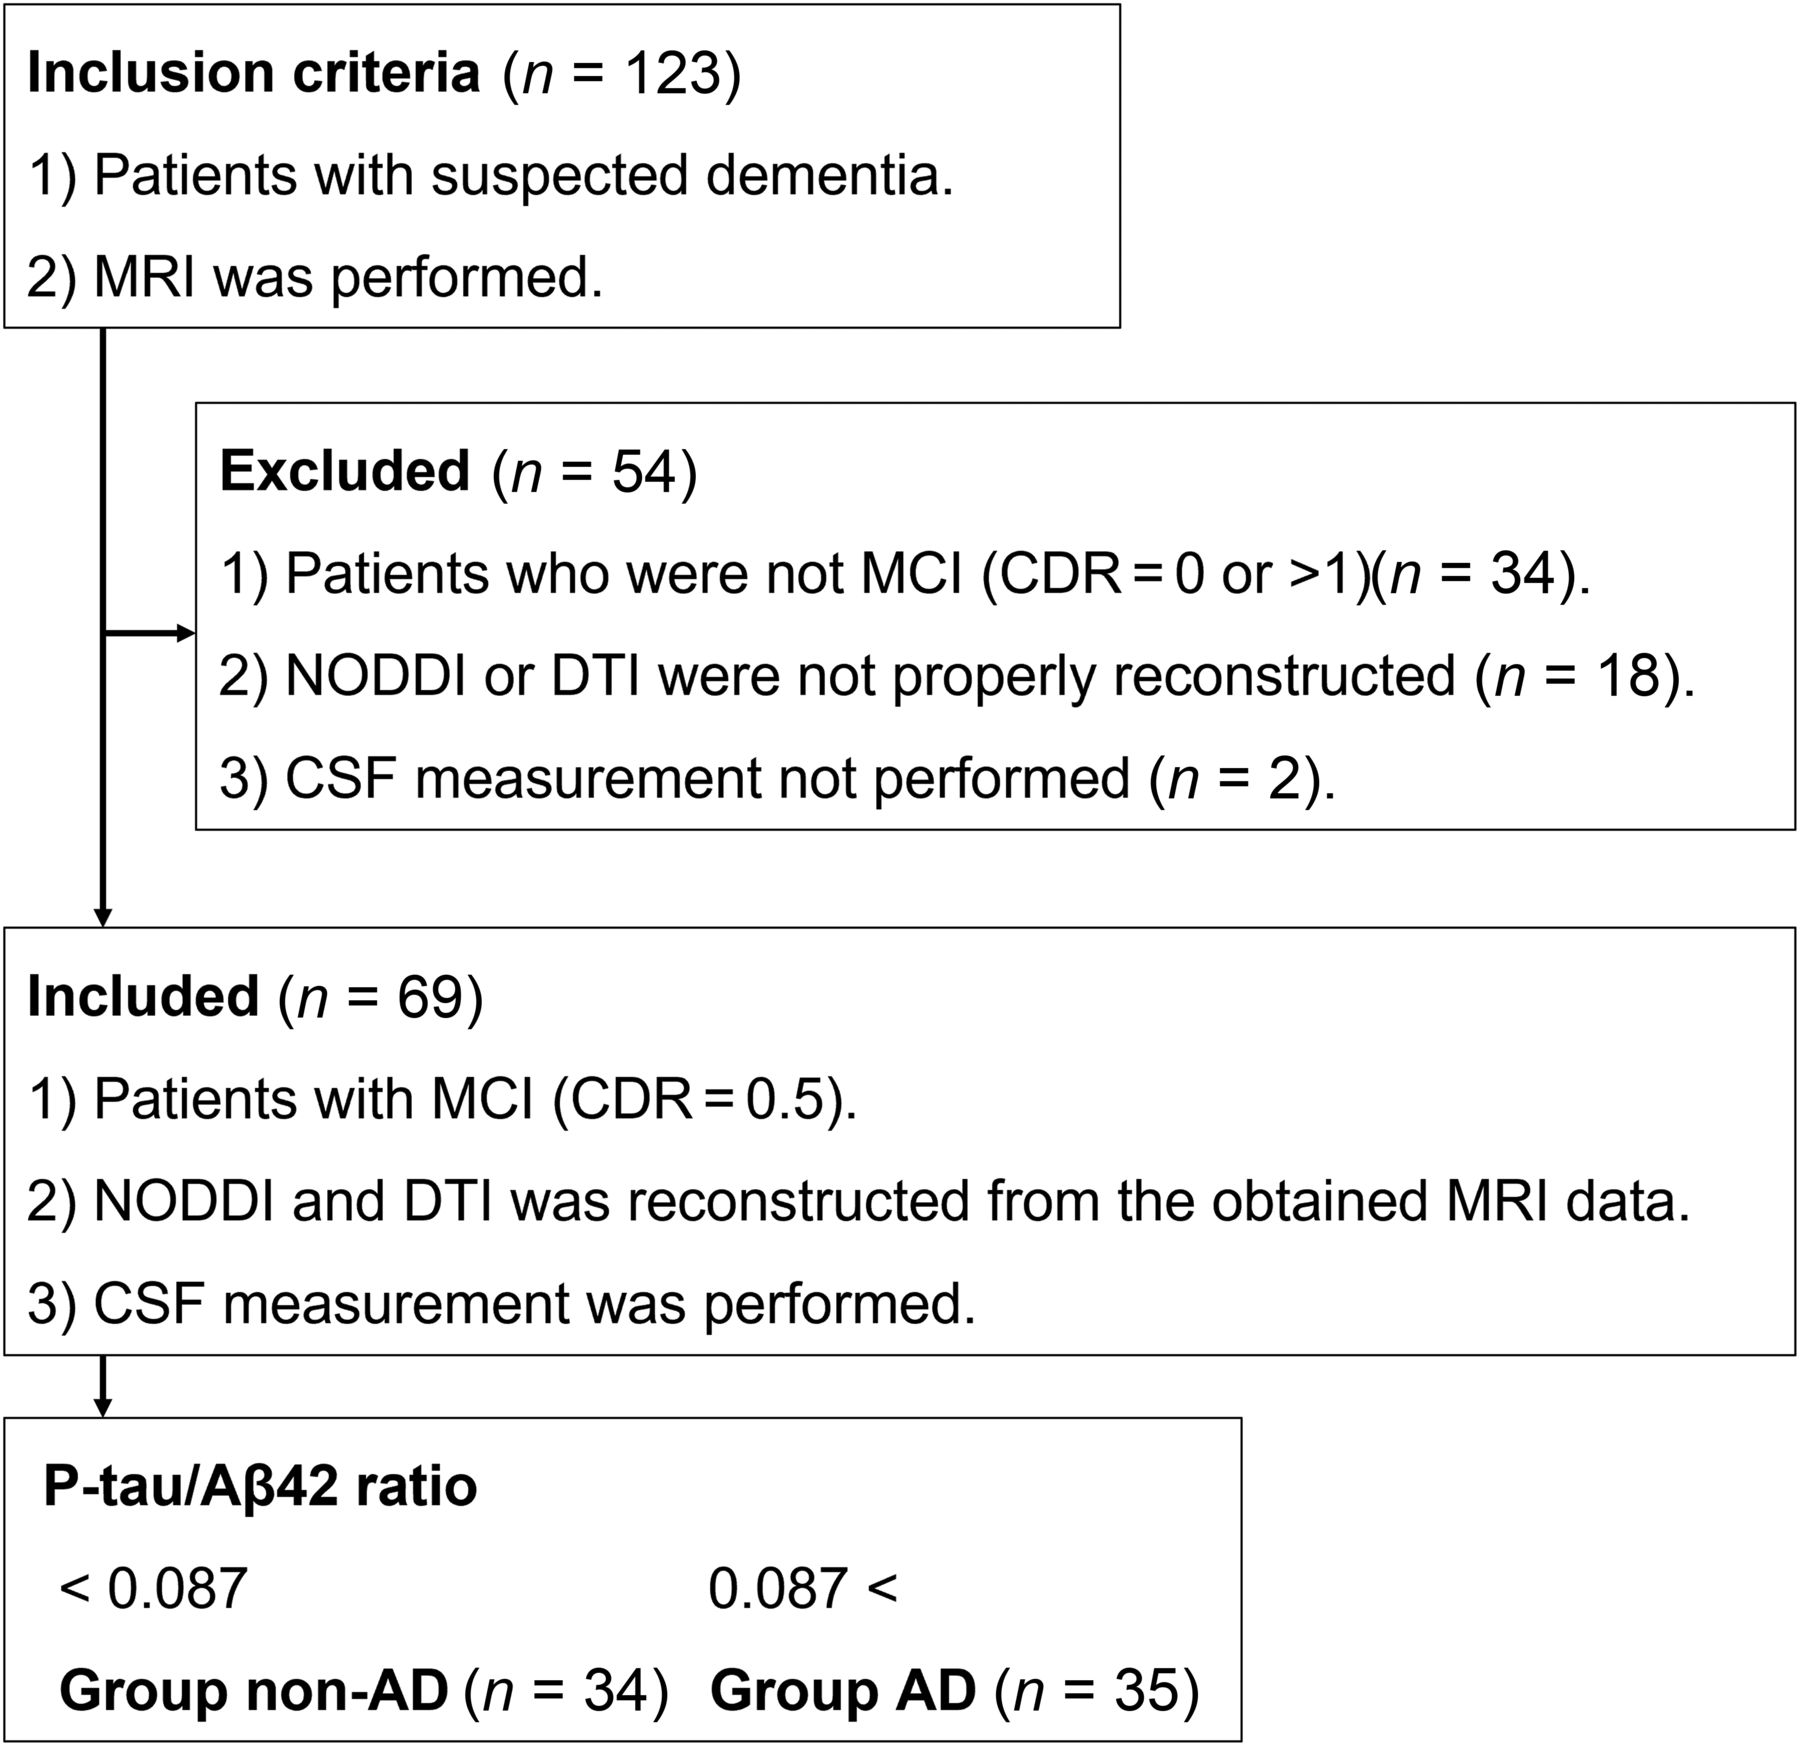
This study included 123 patients who were referred for an investigation of suspected dementia between February 2019 and November 2021. The patients were evaluated by neurologists by using the Diagnostic and Statistical Manual of Mental Disorders, Fifth Edition, and also by using the following clinical scales: the Mini-Mental State Examination, the Alzheimer’s Disease Assessment Scale–Cognitive Subscale, the Rivermead Behavioral Memory Test, and the Clinical Dementia Rating.15 The measurements of Aβ42 and P-tau in CSF and MR imaging examinations were performed within 5 days of the neurologic evaluations. After applying the inclusion and exclusion criteria (Fig 1), 69 patients (34 women, 35 men; age, 78 ± 7.90 years) were diagnosed with MCI (defined as the 0.5 point of the Clinical Dementia Rating scale) and were included in the analysis. Based on a previous report of CSF biomarkers,6 we adopted a CSF P-tau/Aβ42 ratio value of 0.087 as the cutoff value for discriminating AzD pathology from non-AzD pathology. On this basis, 34 patients were diagnosed with non-AzD pathology (< 0.087, non-AzD group), and 35 patients were diagnosed with AzD pathology (> 0.087, AzD group).

Inclusion and exclusion criteria.
Imaging Studies
All MR imaging studies were performed by using a 3T system (Achieva; Philips Healthcare). We adopted a 2-shell diffusion protocol for a reasonable acquisition time in routine clinical practice. Diffusion-weighted imaging was performed by using a spin-echo EPI sequence with the following parameters: TR, 9810 ms; TE, 100 ms; FOV, 256 × 256 mm; acquisition matrix, 126 × 128; section thickness, 2 mm; flip angle, 90°; 2 b-values (1000 and 2000 seconds/mm2) with diffusion encoding in 32 isotropic diffusion gradient directions for every b-value and 1 b-value of 0 sec/mm2; and acquisition time, 10 min.
Three-dimensional sections of a T1-weighted magnetization-prepared rapid acquisition gradient-echo sequence were obtained in the sagittal plane. The sequence parameters were as follows: TR, 6.68 ms; TE, 3.21 ms; FOV, 240 × 240 mm; acquisition matrix, 256 × 326; section thickness, 1.2 mm; and flip angle, 8° with no intersection gaps, thereby enabling volumetry. In addition to these imaging approaches, axial T2-weighted imaging was performed via fast spin-echo sequences for all subjects as part of their screening or routine clinical care to confirm that there were no other structural abnormalities. The sequence parameters were as follows: TR, 3000 ms; TE, 80 ms; FOV, 254 × 254 mm; acquisition matrix, 464 × 329; section thickness, 5 mm; and flip angle, 90°.
Diffusion Image Reconstruction
One neuroradiologist with 20 years of experience who was blinded to the clinical details performed all image reconstruction and analysis. All image data were exported to a computer as a DICOM file and were then converted into Neuroimaging Informatics Technology Initiative (NIfTI) format by using dcm2nii with MRIcron (https://www.nitrc.org/projects/mricron). All image data were corrected for distortions and eddy currents by the respective TOPUP and eddy current correction procedure implemented in FMRIB Software Library 4.1.5 (FSL, www.fmrib.ox.ac.uk/fsl).16 TOPUP estimates susceptibility-induced distortion by extracting 2 nondiffusion-weighted images with opposed phase-encoding polarities (http://fsl.fmrib.ox.ac.uk/fsl/fslwiki/TOPUP).17 The eddy current correction was then applied via the eddy_correct tool (EDDY) (http://fsl.fmrib.ox.ac.uk/fsl/fslwiki/EDDY),18 using the default settings. The resulting 2-shell diffusion-weighted data with b = 0, 1000, and 2000 seconds/mm2 were then fitted to the NODDI model19 by using the NODDI MATLAB Toolbox5 (http://www.nitrc.org/projects/noddi_toolbox). Maps of the intracellular volume fraction (ICVF), orientation dispersion index (ODI), and isotropic volume fraction (Viso) were generated. Only diffusion-weighted images with b = 0 and b = 1000 seconds/mm2 were used for DTI fitting because each of the DTI parameters of fractional anisotropy (FA), mean diffusivity (MD), axial diffusivity (AD), and radial diffusivity (RD) can be estimated by using a conventional monoexponential model.12 The maps of all DTI parameters for all subjects were calculated by using the DTIFIT tool (http://fsl.fmrib.ox.ac.uk/fsl/fsl-4.1.9/fdt/fdt_dtifit.html) implemented in FMRIB Software Library 4.1.5 to fit a tensor model to each voxel of the diffusion-weighted image data.
ROI Analysis
The hippocampal ROI for each side was created manually as a 3-section axial ROI drawn in the hippocampus on the b = 0 image by 2 neuroradiologist observers (observer A and observer B) with 10 and 15 years of experience, respectively, who were blinded to the research plan (Fig 2). An ROI was set, and diffusion parameter values were measured for both the left and right hippocampus by using commercially available software (NordicICE v3.3.12; Nordic Imaging Lab). The features from the histogram of the DTI-derived and NODDI-derived diffusion parameters were calculated from the ROI pixel values by using commercially available software (SPSS Statistics for Windows, version 27.0; IBM and Excel for Windows, version 2019, Microsoft). The histogram features were defined as minimum, maximum, mean, standard deviation, distribution, skewness, kurtosis, and the 10th and 90th percentiles.

A b0 image showing the 3-section axial ROI that was created manually for each side of the hippocampus.
Volumetry
The hippocampal volume of each side was calculated from 3D volume T1-weighted image data that were acquired via conventional volumetric imaging techniques. In a preprocessing step, the 3D volume images were exported as a DICOM file and were then converted into NIfTI format by using the dcm2nii tool with MRIcron (https://www.nitrc.org/projects/mricron). The automated reconstruction and estimation of the volume for the hippocampus were performed on the preprocessed 3D T1 volume image data by using the FreeSurfer image analysis suite, version 7.1.1 (http://surfer.nmr.mgh.harvard.edu).20
Statistical Analysis
All statistical analyses were performed by using commercially available software (SPSS Statistics for Windows, version 27.0). Two-sided P values of less than .05 were considered to be indicative of a statistically significant result. The statistical significance of intergroup differences in the clinical data was tested by using a 2-tailed Mann-Whitney U test. Correlations between the diffusion parameter values (mean) of the interobservers’ ROIs were calculated for the intraclass correlation coefficients. For the histogram features of the diffusion parameter values and volume, the statistical significance of the intergroup differences on each side of the hippocampus was tested by using a 2-tailed Mann-Whitney U test. Additionally, multiple comparisons with an analysis of variance were performed to assess the histogram features of the diffusion parameter values of 4 data sets, including the groups with each 2 observers’ ROIs, as an exploratory analysis. The histogram features that showed P values of less than .05 and that were the lowest among the features of each NODDI and DTI parameter for identifying the statistical significance of the intergroup differences were then selected to set up logistic regression models. The image data, age, sex, and clinical scale were used to assess performance for discriminating between the groups. The logistic regression model aimed to predict a transformation of the logit (p) of the response variable that was used. We assumed that P represented the probability that the diagnosis was AzD pathology and that 1 – P represented the probability that the diagnosis was non-AzD pathology. The logistic regression model enables the prediction of the probability of AzD pathology in relation to the clinical scale and the image data by using the following equation:
 where β0 is the intercept term and β1 and β2 are the coefficients in the model that are associated with the image data and the clinical scale. We assumed that these data were linearly related to the log odds of the response. The odds ratio for discriminating between the groups can be estimated as the exponentiation of the associated coefficient in the model. The performance of logit (p) for the group discrimination was assessed via a receiver operating characteristic analysis. Additionally, in both groups, the correlations between the diffusion parameter values (mean) in each observer’s ROIs and the volumes were assessed by using the Pearson correlation coefficient.
RESULTS
Participant Demographics
The detailed demographic and clinical data for each group are listed in Table 1. The diagnoses in the non-AzD group were vascular cognitive impairment (n = 6), normal pressure hydrocephalus (n = 5), frontotemporal degeneration (n = 1), and depression (n = 1). The diagnoses were not confirmed in 21 cases, including the suspicious cases: argyrophilic grain disease (n =1), dementia with Lewy bodies (n = 1), and frontotemporal degeneration (n =1).
Detailed demographic and clinical data of patients with MCI
There was no significant difference in Mini-Mental State Examination between the groups, whereas the Alzheimer’s Disease Assessment Scale–Cognitive Subscale scale was significantly higher in the AzD group than in the non-AzD group, and the Rivermead Behavioral Memory Test scale was significantly lower in the AzD group than in the non-AzD group.
Hippocampal Values
The intraclass correlation coefficients of the diffusion parameter values (mean) are shown in Table 2. The intraclass correlation coefficients of almost all diffusion parameter values were 0.59–0.91, besides the Viso values (0.12 and 0.07). Table 3 lists the diffusion parameter values that showed significant intergroup differences in both observers’ hippocampal ROIs and the volumes of each side of the hippocampus. All results are shown in the Online Supplemental Data. Compared with those in the non-AzD group, the ICVF values of the left hippocampus (mean and 90th percentile) were significantly lower, and the MD value of the right hippocampus (mean), the MD and AD values of the left hippocampus (mean, 10th and 90th percentiles), and the RD value of the left hippocampus (minimum, mean, and 90th percentile) were significantly higher in the AzD group. The hippocampal volumes were significantly lower bilaterally in the AzD group than in the non-AzD group. Multiple comparisons showed no statistically significant intergroup differences in both observers’ hippocampal ROIs, and the diffusion parameter values that showed statistically significant intergroup differences are shown in the Online Supplemental Data. The Online Supplemental Data lists the raw data of some representative diffusion parameters.
ICCsa of the left and right hippocampal ROI values
Statistically significant intergroup differences (P < .05) in the left and right hippocampal ROI values
Performance for the Diagnosis of the AzD Pathology in MCI
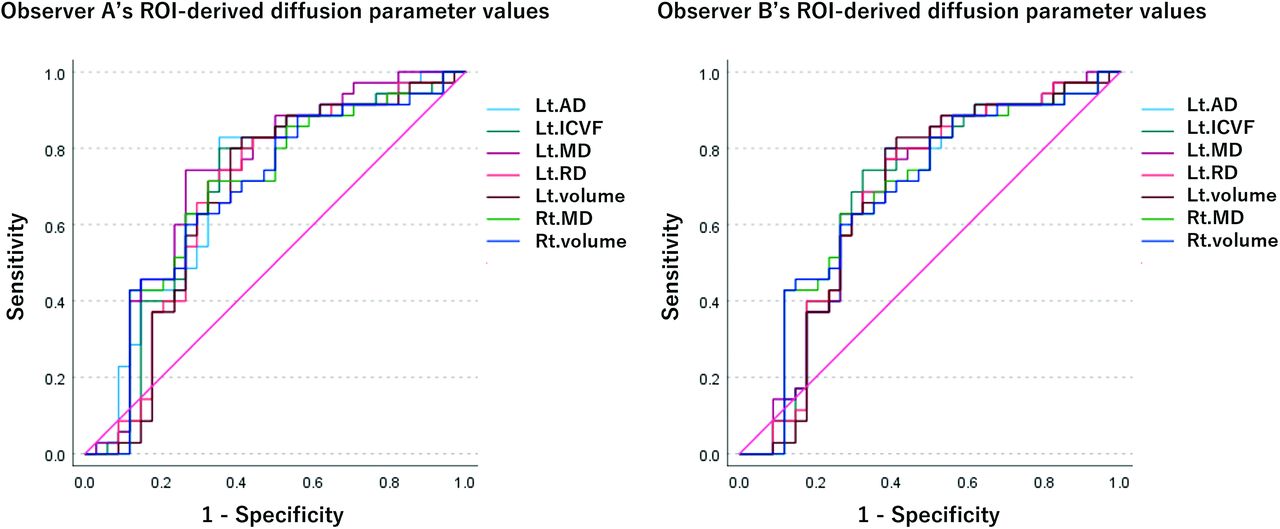
The receiver operating characteristic analysis quantified the performance of the logistic regression model, showing the statistically significant intergroup differences with the least P values among the histogram feature values of each parameter (Fig 3). The respective areas under the receiver operating characteristic curve of logit (p) and the odds ratios of the variables in each logistic regression model are listed in Table 4. In the respective ROIs made by observer A and observer B, the areas under the curve for ICVF (mean) of the left hippocampus were 0.69 and 0.68, those for the MD (mean) of the right hippocampus were 0.69 and 0.68, those for the MD (10th percentile) of the left hippocampus were 0.73 and 0.68, those for the AD (10th percentile) of the left hippocampus were 0.71 and 0.68, those for the RD (mean) of the left hippocampus were 0.68 and 0.68, and those for the volume of the left and right hippocampus were 0.67 and 0.68. Among the variables in the entire logistic regression model, the diffusion parameters contributed the most, whereas volume contributed the least, according to the odds ratio.

Receiver operating characteristic curve of each logistic regression model for each diffusion parameter and volumetry. The diffusion parameter values are from the ROIs of each of observer A and observer B.
The logistic regression model used in the prediction of the intergroup differences
Correlations between the Hippocampal Values
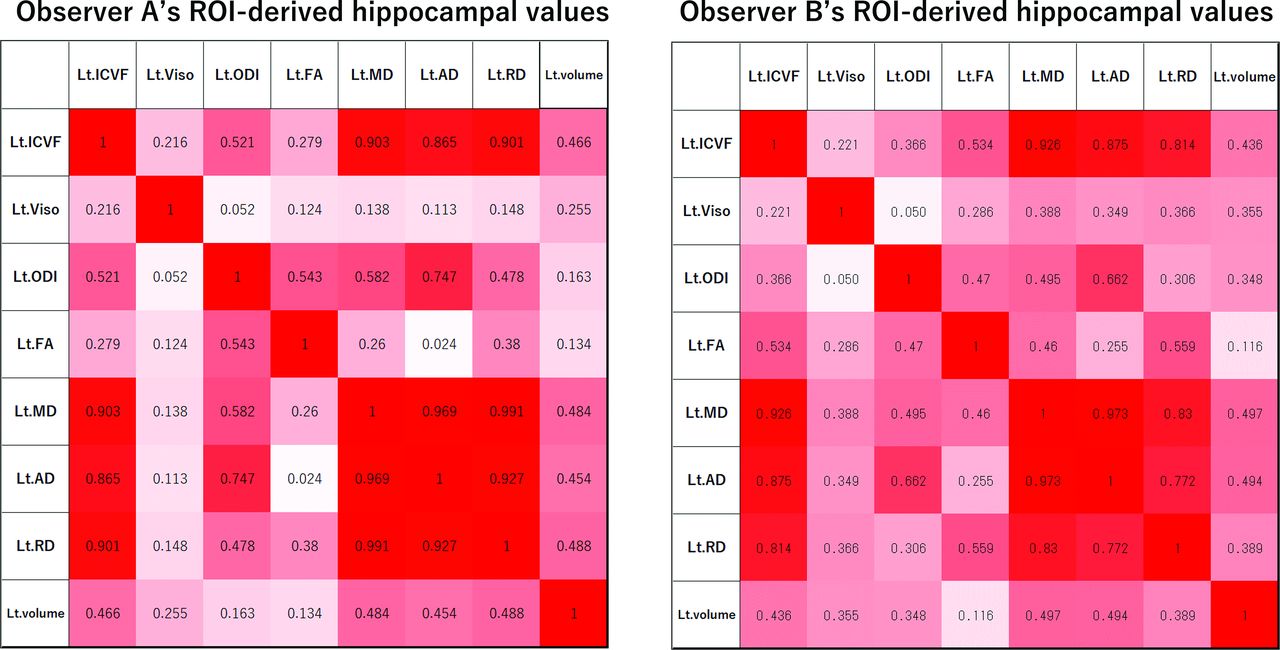
Heat maps of the correlations among the diffusion parameters and the volume of the left hippocampus in the AzD group are shown in Fig 4. Other heat maps are provided in the Online Supplemental Data. There were many significant correlations among the diffusion parameter values (mean) and volumes in both groups. In detail, the ICVF values were highly correlated with each of the MD, AD, and RD values (R absolute value greater than 0.55). The ODI value was highly correlated with the FA value (R absolute value greater than 0.45). Each of the ICVF, MD, AD, and RD values was significantly correlated with the volume (R absolute value greater than 0.35). The Viso value and the volume were weakly correlated (not statistically significant) in the AzD group (R absolute values mostly around 0.30), compared with those of the non-AzD group (R absolute values around 0.01–0.10).

R absolute value (|R|) of the left hippocampal values in the AzD group. Heat map of the correlations between the diffusion metrics and the volume. Values of 0.34 < |R| < 0.43 indicate a statistically significant difference with P < .05. Values of 0.43 < |R| indicate a statistically significant difference with P < .01.
DISCUSSION
The present findings indicate that, in addition to the clinical scale, quantitative biomarkers are needed for diagnosing AzD pathology in MCI. In terms of cognitive symptoms, the Mini-Mental State Examination score showed no statistically significant difference between the MCI groups, whereas both the Alzheimer’s Disease Assessment Scale–Cognitive Subscale and Rivermead Behavioral Memory Test scores showed statistically significant intergroup differences. However, in both groups, neither the Mini-Mental State Examination score nor the Rivermead Behavioral Memory Test score met the cutoff value for cognitive decline. Alzheimer’s Disease Assessment Scale–Cognitive Subscale is commonly used for follow-up studies.21
The diffusion metrics showed that hippocampal neurodegeneration was more frequent in patients with MCI with AzD pathology than in patients without AzD pathology. Our results revealed leftward lateralization in hippocampal neurodegeneration. Tau positron emission tomography studies showed leftward uptake in the medial temporal region, which is consistent with the Braak stage.22,23 However, subject selection bias might have affected our results. Subjects with cognitive symptoms were recruited to the study, and leftward hippocampal neurodegeneration tends to induce cognitive symptoms.24
The present findings revealed a statistically significant intergroup difference in hippocampal neuron microstructure. In detail, in the left hippocampus, the ICVF values were statistically significantly lower, whereas the MD, AD, and RD values were statistically significantly higher, in the AzD group than in the non-AzD group. Only the MD value was statistically significantly higher in the right hippocampus. In contrast, the ODI and FA values showed little intergroup difference in the bilateral hippocampus. A previous diffusion MR imaging study reported that the NODDI model was sensitive to neurodegeneration, displaying higher ODI and lower ICVF values in patients with MCI compared with healthy controls; however, the DTI model was more sensitive.25 In the DTI model, FA is limited in estimating pathologic changes because of its nonspecific changes.26 The NODDI model helps to interpret changes in FA; in particular, it allows for the assessment of neurite density, using the ODI and ICVF values of nerve fibers as 2 key variables.12 In contrast, our results revealed that ODI highly correlates with FA and that ODI and FA showed almost the same values between the AzD and non-AzD pathologies. These results indicate that there is a greater change in neurite density than in neurite projections in the hippocampi of patients with AzD pathology, compared with patients with non-AzD pathology. As the hippocampal structure atrophies with neurodegeneration, the space generally becomes occupied by CSF. The ability of NODDI to remove the effect of neurodegeneration-derived CSF contamination increases its specificity for cytoarchitecture.27 The present finding of no statistically significant difference in Viso between the AzD and non-AzD groups indicates only a small effect of hippocampal neurodegeneration-derived CSF contamination on the performance of diffusion metrics. Meanwhile, there was a stronger negative correlation between the hippocampal volume and the Viso value in the AzD group than in the non-AzD group, which indicates that hippocampal neurodegeneration is greater in patients with AzD pathology. Accordingly, we consider that NODDI-derived neuronal density and DTI-derived diffusivity are similar and that both play an important role in the diagnosis of AzD pathology in MCI.
Both amyloid burden with a decreased CSF Aβ42 level and neurofibrillary tangle burden with an elevated CSF P-tau level might affect the measurements of diffusion metrics in patients with AzD pathology. During the preclinical progression of amyloid deposition, a weaker diffusion restriction at a higher burden has been reported in both gray matter and white matter.28,29 A previous study using a tau pathology mouse model reported both a positive correlation between increased MD and tau density in gray matter regions, indicating disruption to the cytoarchitecture, and a negative correlation between the hippocampal volume and neurofibrillary tangle density, indicating a strong link between neurofibrillary tangle formation and hippocampal atrophy.30 Accordingly, measuring neuronal density and volume can be sensitive to neurodegeneration in patients with AzD pathology. Meanwhile, based on the logistic regression model, we consider that diffusion metrics contribute considerably to the diagnostic process for AzD pathology in patients with MCI. Previous studies have reported that hippocampal diffusivity changes were better than the hippocampal volume for diagnosing MCI or predicting conversion from MCI to AzD, which is consistent with our outcome.31
There are some limitations to the present study. First, the group of non-AzD pathology included cases of MCI that were not clinically confirmed. However, the group discrimination based on the CSF biomarker level was performed mainly for the diagnosis of AzD pathology in MCI. Second, the hippocampal ROIs were drawn on b0 maps, which are inherently low resolution. Therefore, it is unclear whether the average ROI pixel value was contaminated by adjacent CSF pixel values in the diffusion metrics. According to the high interobserver correlation in the ROI values of the diffusion metrics for quantifying neuronal structures, we believe that the effect of free water diffusion in the CSF space within each ROI was small. Meanwhile, we consider that the increase of the diffusion image resolution can reduce the CSF contamination in the hippocampal ROI and thereby improve the ability to quantify neuronal structure changes. Finally, given the small sample size, the present study is relatively underpowered to produce strong statistics; therefore, multiple comparisons were performed as an exploratory analysis.
CONCLUSIONS
Logistic regression analysis, by using both clinical information and the hippocampal image data, revealed that diffusion parameters contributed the most to the CSF-biomarker-aided diagnosis of AzD pathology in MCI, and hippocampal histogram analysis of diffusion metrics might provide additional suitable biomarkers for the diagnosis of early-stage AzD.
Footnotes
This work was supported by the Japan Society for the Promotion of Science (JSPS) KAKENHI Grant Number JP17K16436.
Disclosure forms provided by the authors are available with the full text and PDF of this article at www.ajnr.org.
References
- Received June 1, 2023.
- Accepted after revision November 17, 2023.
- © 2024 by American Journal of Neuroradiology


Jump to section
Related Articles
Cited By...
- No citing articles found.