
Article Figures & Data
Figures
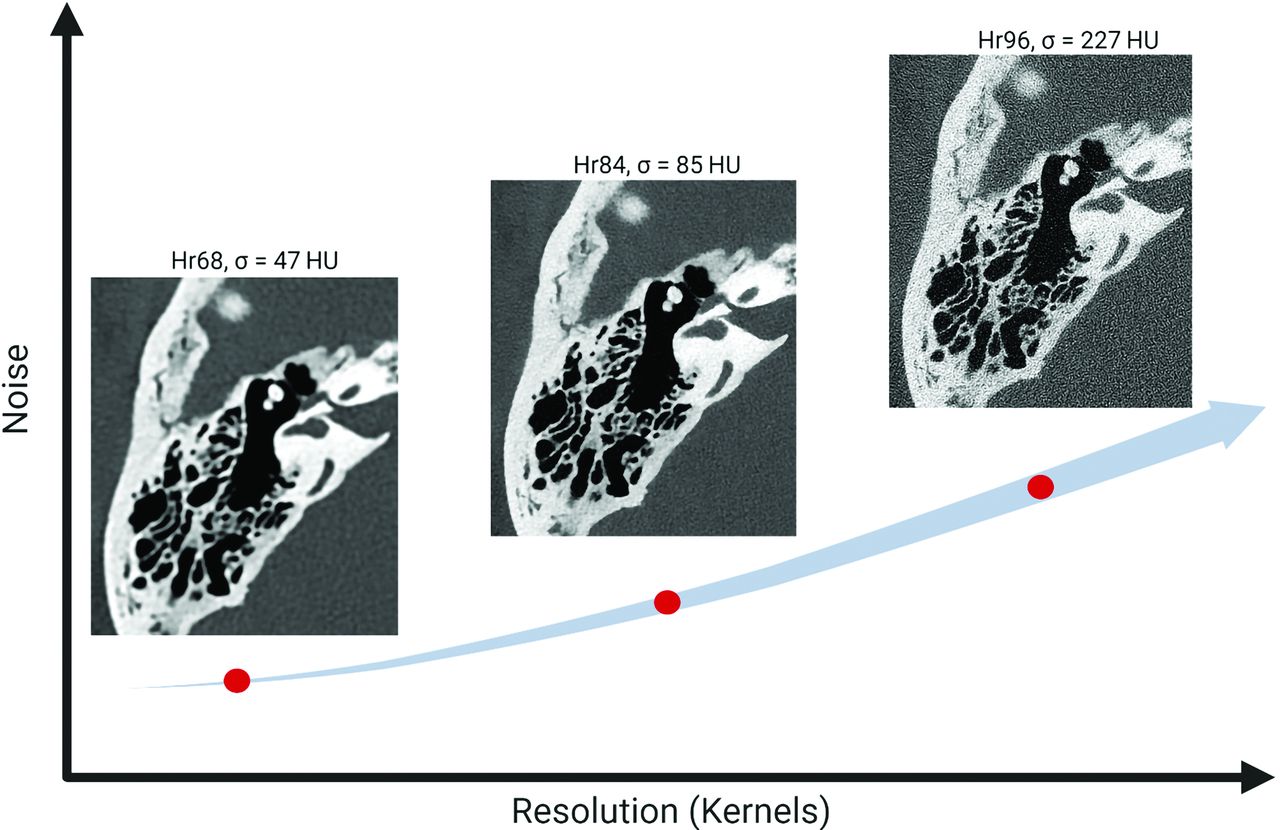
- FIG 1.
Image resolution versus noise in PCD-CT. As image resolution increases, image noise also increases, which can limit the utility of high-resolution settings in PCD-CT.
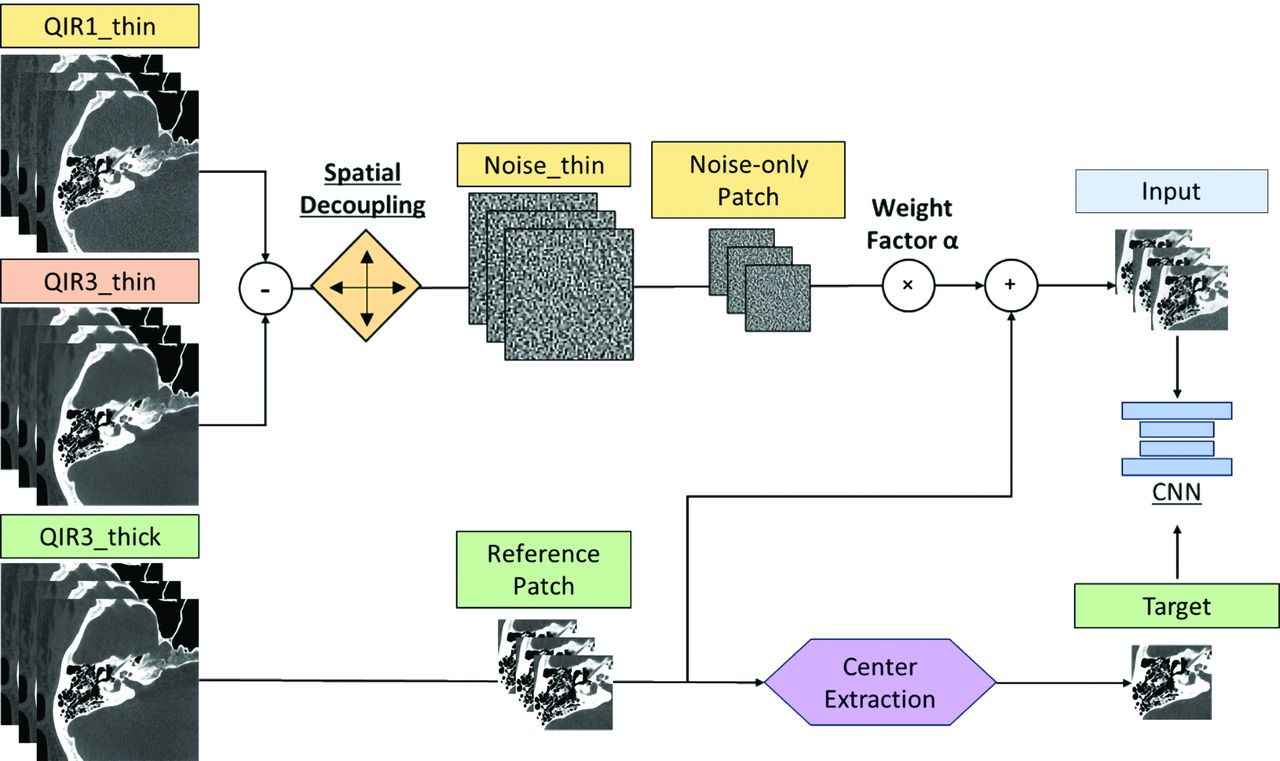
- FIG 2.
The overall workflow of the proposed deep CNN denoising method. All training data originated from patient image series reconstructed using 2 iterative reconstruction strengths, QIR1 and QIR3, with thin-slice (0.2-mm) and thick-slice (0.4-mm) thicknesses, respectively. A multiple-slice input strategy was implemented to enhance the performance of the CNN.
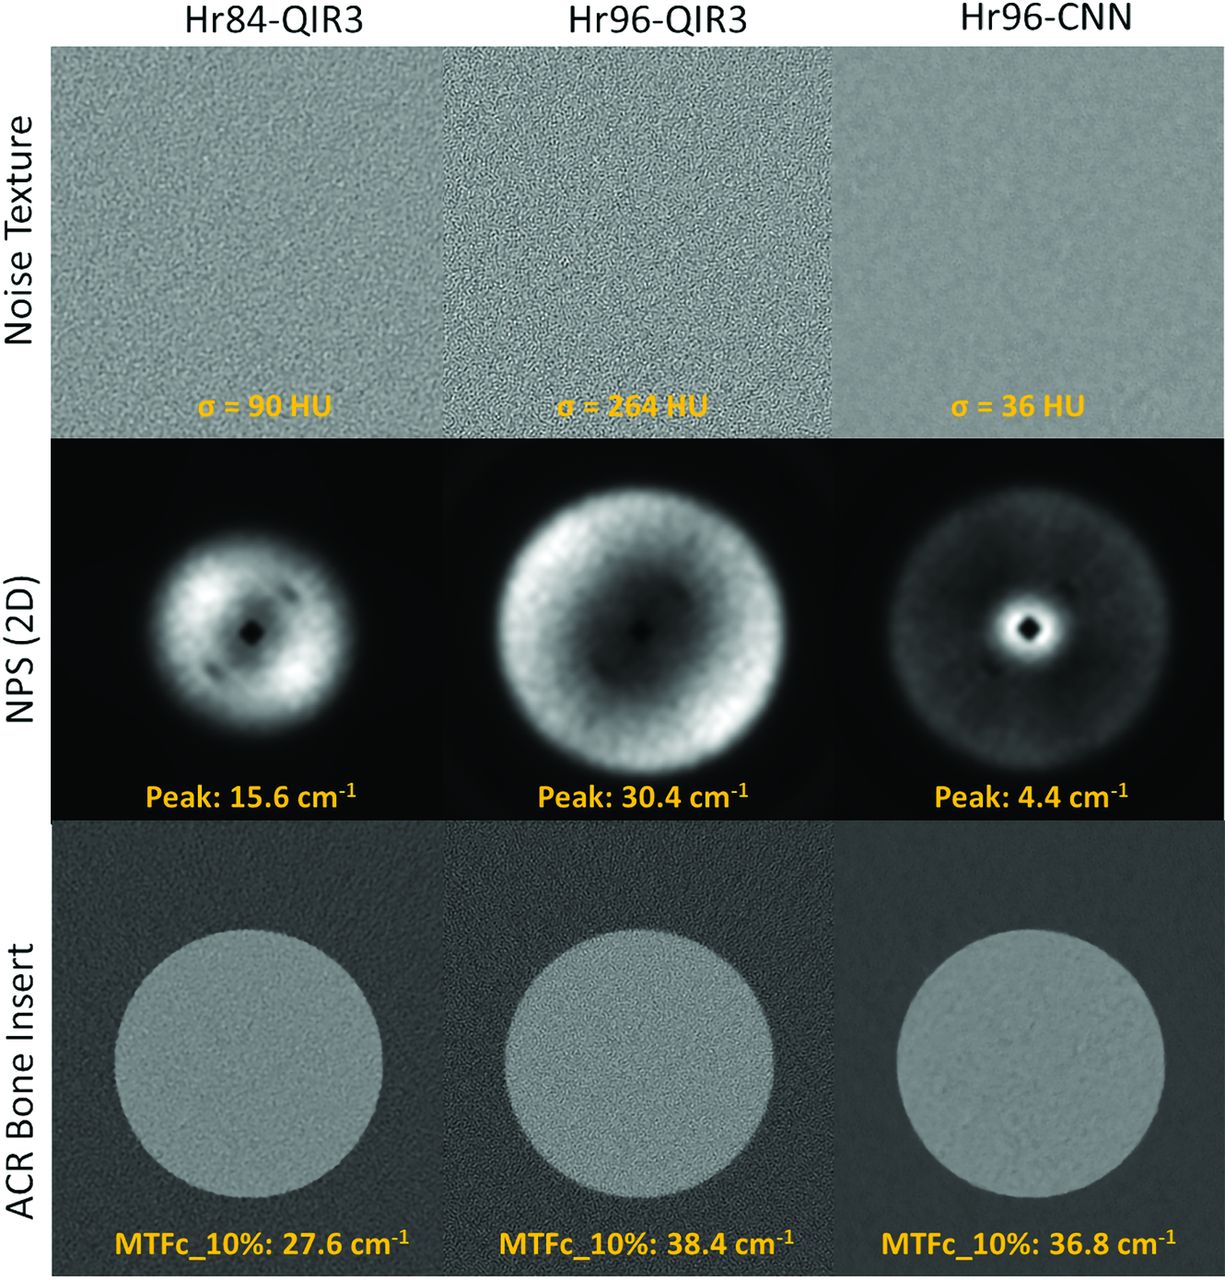
- FIG 3.
Noise textures, NPS, and MTFc for the bone insert from axial slices of the ACR phantom for Hr84-QIR3, Hr96-QIR3, and Hr96-CNN, displayed under a fixed window and level.
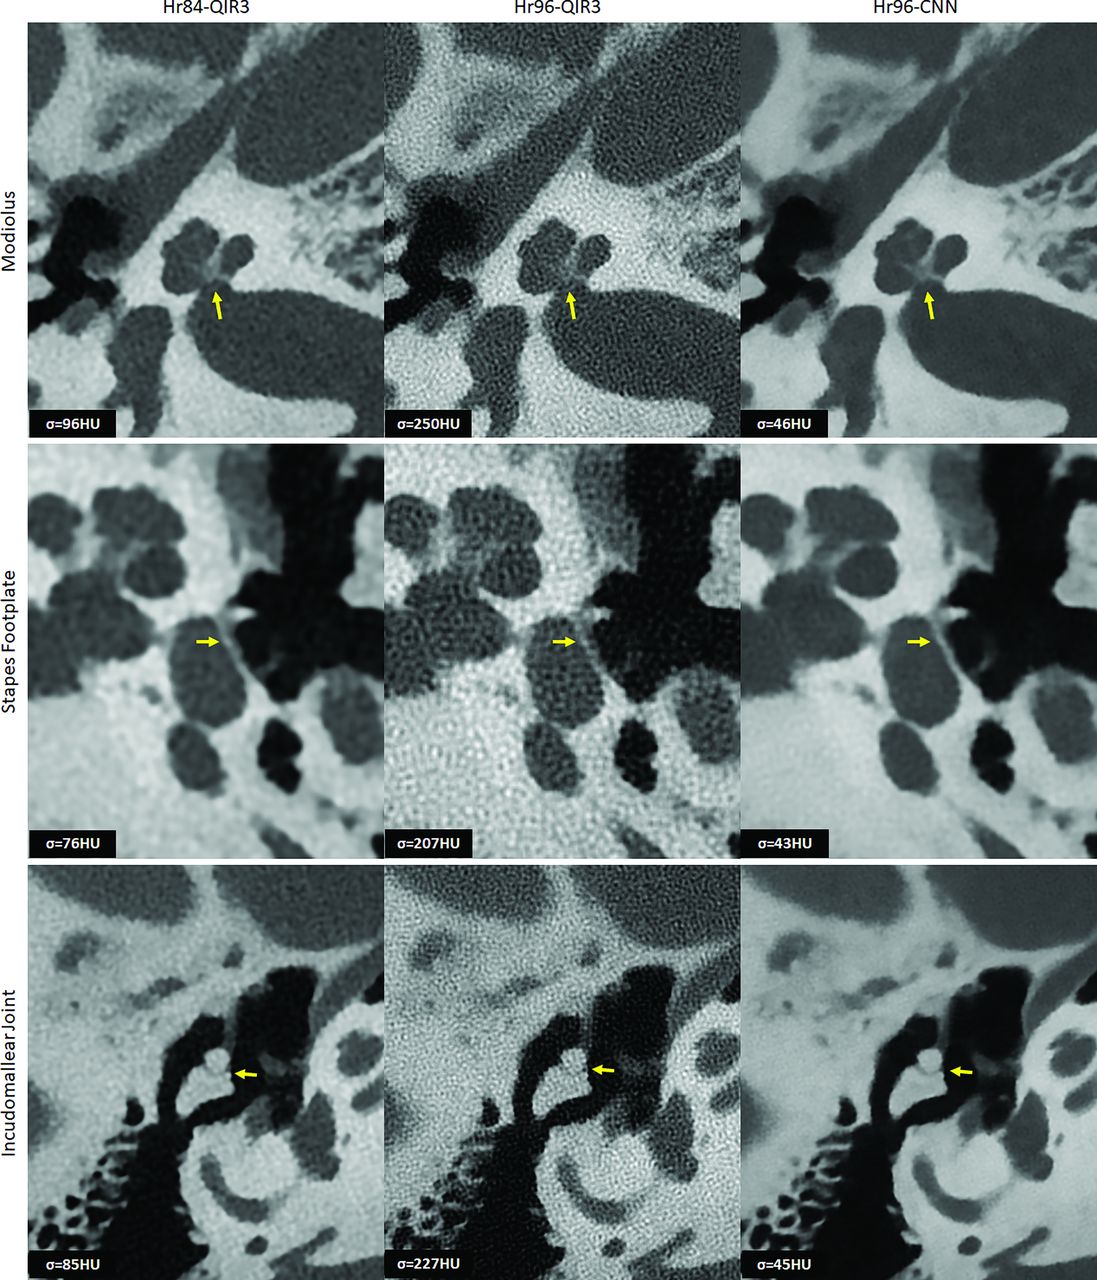
- FIG 4.
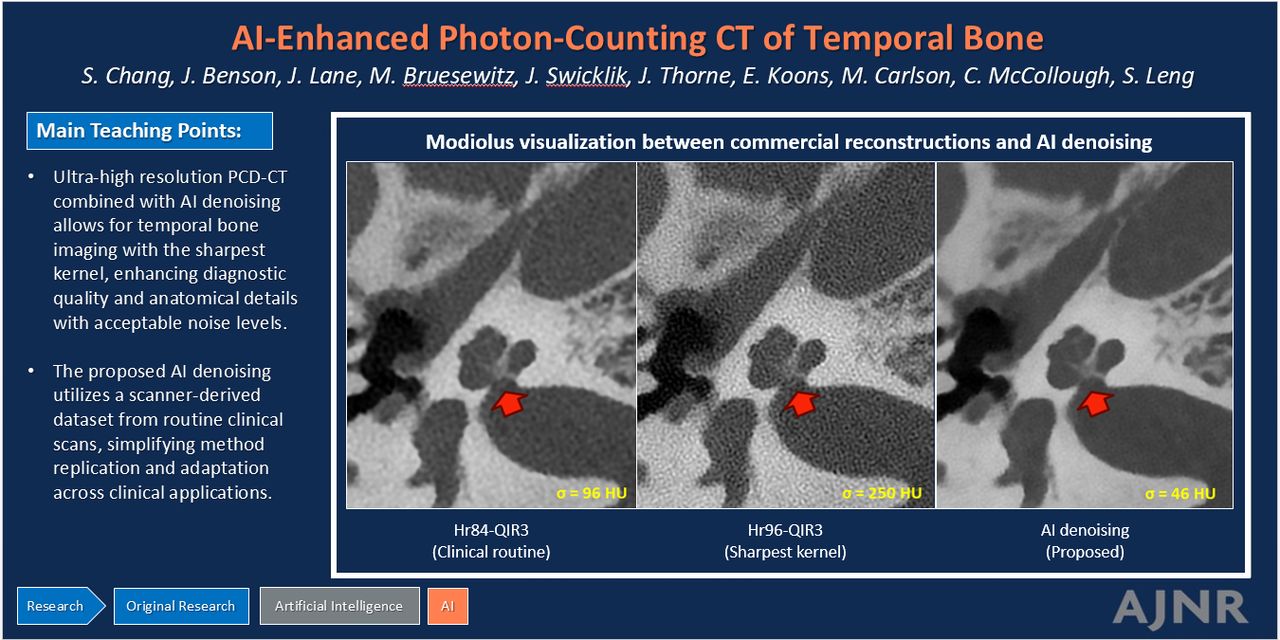
Representative images of the modiolus, stapes footplate, and incudomallear joint using 3 different reconstructions: Hr84-QIR3, Hr96-QIR3, and Hr96-CNN (W/L: 4000/1000 HU). Enhanced visualization with improved resolution and reduced noise is demonstrated, as indicated by the yellow arrows, the Hr96-CNN provides improved delineation of three key anatomic structures. Image noise was quantified by measuring the SD of CT numbers within a circular ROI placed in a uniform soft-tissue area, with values recorded in the lower left corner of each image.
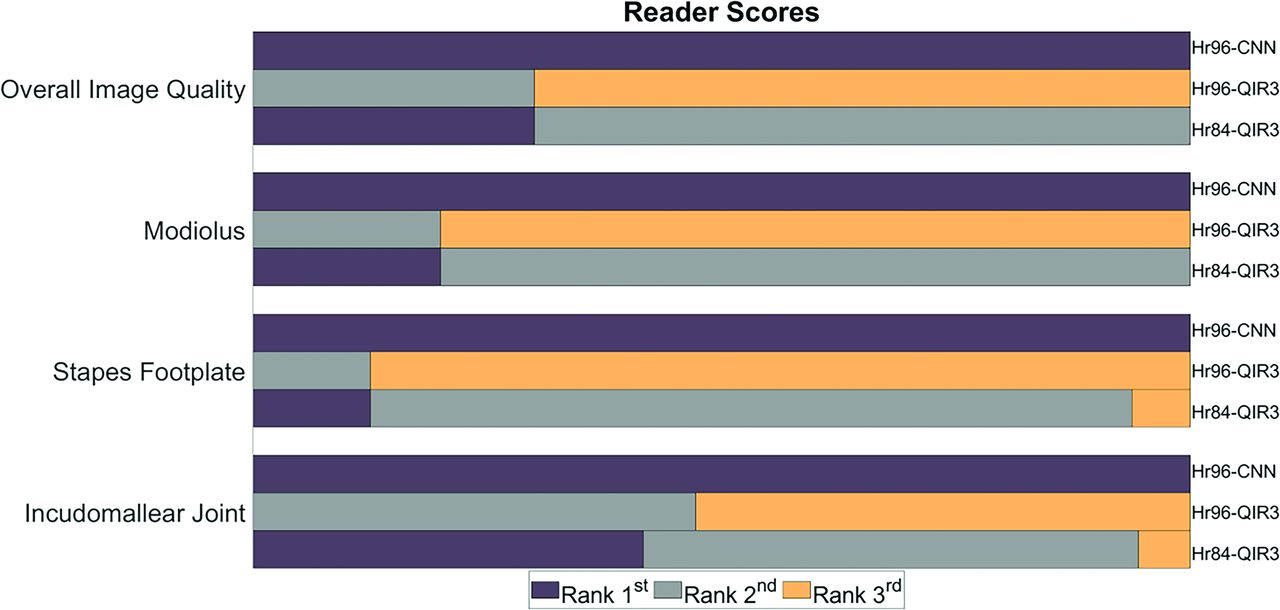
- FIG 5.
Rankings from 2 readers regarding overall image quality and delineation of 3 key anatomic structures. For all 3 structures and overall image quality, CNN-Hr96 images rank the highest. Dull purple indicates the first rank; medium gray, the second rank; gold, the third rank.
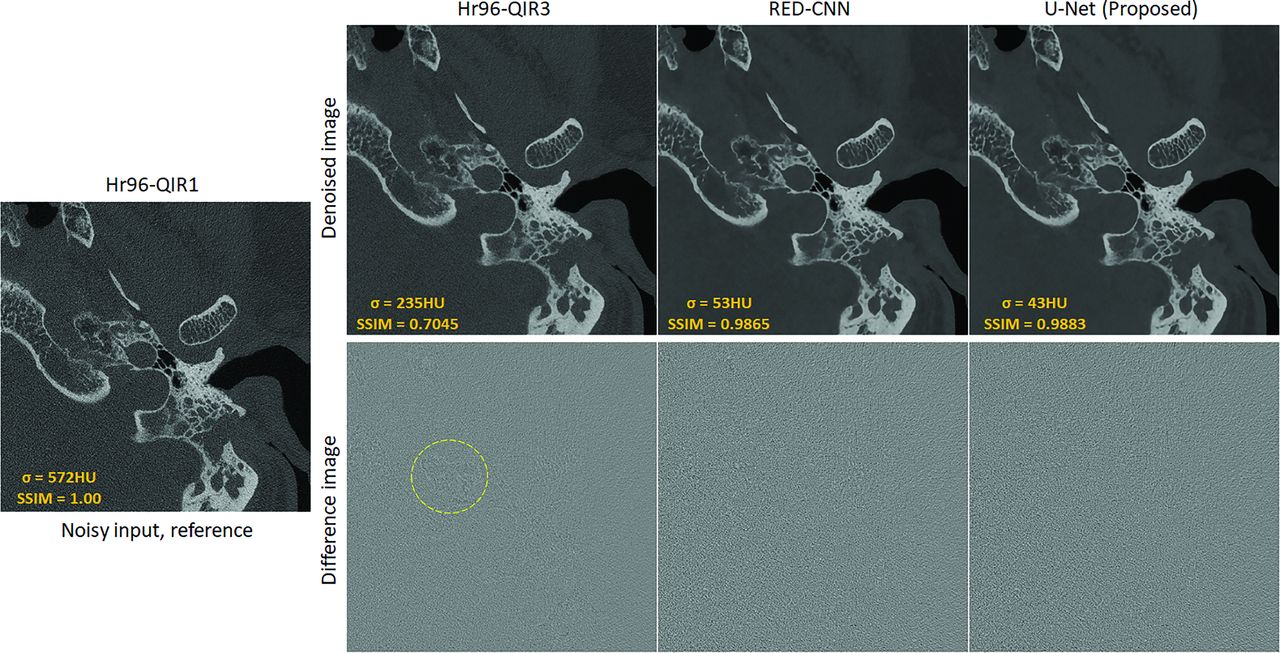
- FIG 6.
Sample slice from the test data set processed with Hr96-QIR3, RED-CNN, and the proposed U-Net, alongside their corresponding difference images compared with the reference input. The CNN-based methods (RED-CNN and U-Net) primarily reduce noise, while the conventional Hr96-QIR3 also removes subtle anatomic structures (indicated by the yellow dashed circle). The display window is W/L: 4000/1000 HU for patient images and 3000/1000 HU for difference images.


Tables
Quantitative comparison (mean) at the patient level across the conventional method (Hr96-QIR3), RED-CNN, and U-Net
Quality Metrics Hr96-QIR1 Hr96-QIR3 RED-CNN U-Net (Proposed) Image noise 500.15 (SD, 52.38) 204.63 (SD, 21.70) 52.8 (SD, 1.17) 47.35 (SD, 2.62) SSIM 1.00 (SD, 0.00) 0.72 (SD, 0.05) 0.98 (SD, 0.02) 0.99 (SD, 0.01)


Jump to section
Related Articles
Cited By...
- No citing articles found.