Graphical Abstract

Abstract
BACKGROUND AND PURPOSE: Ultra-high-resolution (UHR) photon-counting-detector (PCD) CT improves image resolution but increases noise, necessitating the use of smoother reconstruction kernels that reduce resolution below the 0.125-mm maximum spatial resolution. A denoising convolutional neural network (CNN) was developed to reduce noise in images reconstructed with the available sharpest reconstruction kernel while preserving resolution for enhanced temporal bone visualization to address this issue.
MATERIALS AND METHODS: With institutional review board approval, the CNN was trained on 6 patient cases of clinical temporal bone imaging (1885 images) and tested on 20 independent cases using a dual-source PCD-CT (NAEOTOM Alpha). Images were reconstructed using quantum iterative reconstruction at strength 3 (QIR3) with both a clinical routine kernel (Hr84) and the sharpest available head kernel (Hr96). The CNN was applied to images reconstructed with Hr96 and QIR1 kernel. For each case, three series of images (Hr84-QIR3, Hr96-QIR3, and Hr96-CNN) were randomized for review by 2 neuroradiologists assessing the overall quality and delineating the modiolus, stapes footplate, and incudomallear joint.
RESULTS: The CNN reduced noise by 80% compared with Hr96-QIR3 and by 50% relative to Hr84-QIR3, while maintaining high resolution. Compared with the conventional method at the same kernel (Hr96-QIR3), Hr96-CNN significantly decreased image noise (from 204.63 to 47.35 HU) and improved its structural similarity index (from 0.72 to 0.99). Hr96-CNN images ranked higher than Hr84-QIR3 and Hr96-QIR3 in overall quality (P < .001). Readers preferred Hr96-CNN for all 3 structures.
CONCLUSIONS: The proposed CNN significantly reduced image noise in UHR PCD-CT, enabling the use of the sharpest kernel. This combination greatly enhanced diagnostic image quality and anatomic visualization.
ABBREVIATIONS:
- ACR
- American College of Radiology
- CNN
- convolutional neural network
- IR
- iterative reconstruction
- MTFc
- contrast-dependent modulation transfer function
- NPS
- noise power spectrum
- PCD
- photon-counting-detector
- QIR
- quantum iterative reconstruction
- RED-CNN
- residual encoder-decoder convolutional neural network
- SSIM
- structural similarity index
- UHR
- ultra-high-resolution
SUMMARY
PREVIOUS LITERATURE:
UHR PCD-CT can enhance image resolution and improve visualization of temporal bone structures. However, the maximum spatial resolution of the system has not been fully explored in previous studies due to the associated increase in noise.
KEY FINDINGS:
A dedicated CNN enhanced high-resolution temporal bone imaging using the sharpest available kernel in PCD-CT, outperforms conventional methods, and significantly improves diagnostic quality and visualization of critical anatomic structures.
KNOWLEDGE ADVANCEMENT:
The resulting high-resolution images feature acceptable noise levels that not only improve anatomic delineation but also more precisely define the interfaces between metal prostheses and surrounding structures, enhancing temporal bone visualization.
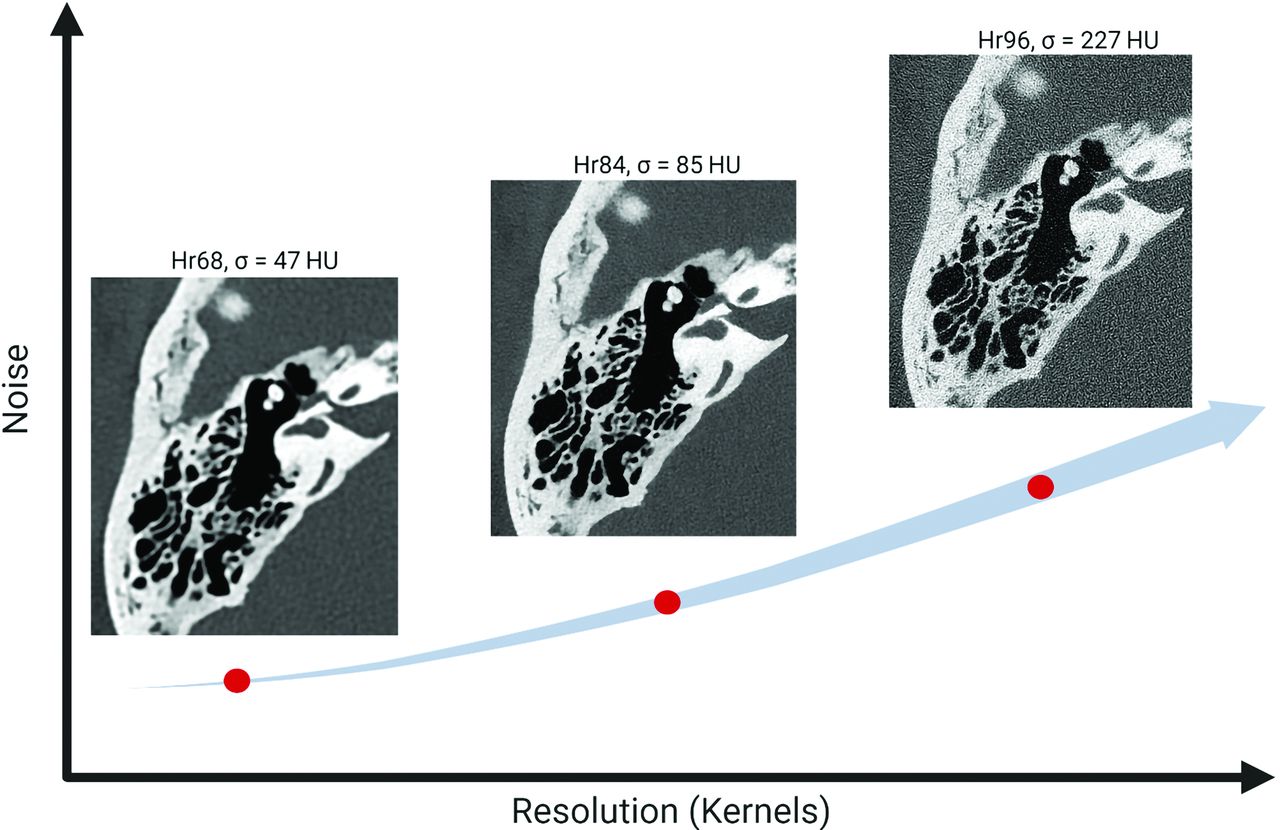
Temporal bone structures, including the facial nerve and labyrinth, are submillimeter in scale and require high-spatial-resolution imaging.1⇓⇓-4 Recently, photon-counting-detector (PCD) CT systems have demonstrated the ability to provide ultra-high-resolution (UHR) images, with in-plane resolutions reaching 0.125 mm.5⇓⇓⇓-9 However, using this level of spatial resolution is challenging clinically because images at the highest resolution exhibit excessive noise as demonstrated in Fig 1. Therefore, it is crucial to maintain acceptable noise levels while preserving detailed structures, particularly in high-resolution imaging at clinical dose levels.

Image resolution versus noise in PCD-CT. As image resolution increases, image noise also increases, which can limit the utility of high-resolution settings in PCD-CT.
In practice, PCD-CT temporal bone examinations typically use smoother kernels (eg, Hr84) instead of the sharpest available kernel (eg, Hr96) to keep the noise at acceptable levels. The choice of the kernel determines the final image resolution, with higher numbers indicating greater spatial resolution.10,11 For instance, the Hr84 kernel results in an in-plane resolution of 0.154 mm, which is inferior to the maximum resolution (0.110 mm) of the system.12 Noise reduction is an important topic in CT imaging, and various methods have been investigated such as traditional iterative reconstruction (IR)13 and deep learning–based methods.14,15 As highlighted by Niu et al,16 deep learning approaches, which train a neural network to remove noise from a noisy image, demonstrate superior denoising performance compared with IR methods. However, these approaches often require extensive collections of spatially aligned low- and routine-dose patient images, which are challenging to obtain.
In this study, we developed a dedicated denoising convolutional neural network (CNN) to significantly reduce image noise in UHR PCD-CT, enabling the use of the sharpest kernel with acceptable noise levels for enhanced temporal bone visualization. Our approach uses a training data set from the scanner, comprising both thin-slice and thick-slice IR images. All images were obtained from the routine clinical scan, without the need for images at different dose levels. This strategy not only ensures high-quality training data but also simplifies the replication of our methods by other researchers and facilitates adaptation to various clinical applications.
MATERIALS AND METHODS
Data Collection
This retrospective study was approved by our institutional review board and was Health Insurance Portability and Accountability Act–compliant, with informed consent waived. The methodology proposed in the Checklist for Artificial Intelligence in Medical Imaging (CLAIM; https://pubs.rsna.org/page/ai/claim) (Supplemental Data) was followed. Data from 6 adult clinical temporal bone PCD-CT scans were used for CNN training and validation, while 20 independent patient cases were used for testing. All examinations were conducted in UHR mode (120 × 0.2 mm collimation, 120 kV) on a dual-source PCD-CT (NAEOTOM Alpha; Siemens), with 1-second rotation time, 0.5 helical pitch, and automatic exposure control with 220 CARE (Siemens) kiloelectron volt Image Quality (IQ) level, resulting in a volume CT dose index of 34 mGy for standard size patients. The training and validation data set included 1885 CT images, reconstructed using both thin-slice (0.2-mm slice thickness with an 0.1-mm increment) and thick-slice (0.4-mm slice thickness with an 0.2-mm increment) settings. Quantum iterative reconstruction was applied at strength 1 (QIR1) for thin slices and strength 3 (QIR3) for both thin and thick slices. All images used the sharpest available head-regular reconstruction kernel (Hr96) and were processed with a 1024 × 1024 matrix size within an 80-mm clinical standard field of view. The trained CNN was then applied to test cases, using images reconstructed at 0.2-mm thickness with the Hr96 kernel and QIR1. For reference, images reconstructed with the clinical routine kernel (Hr84) at a 0.2-mm slice thickness and QIR3 were also collected.
Dedicated Denoising CNN Training Workflow
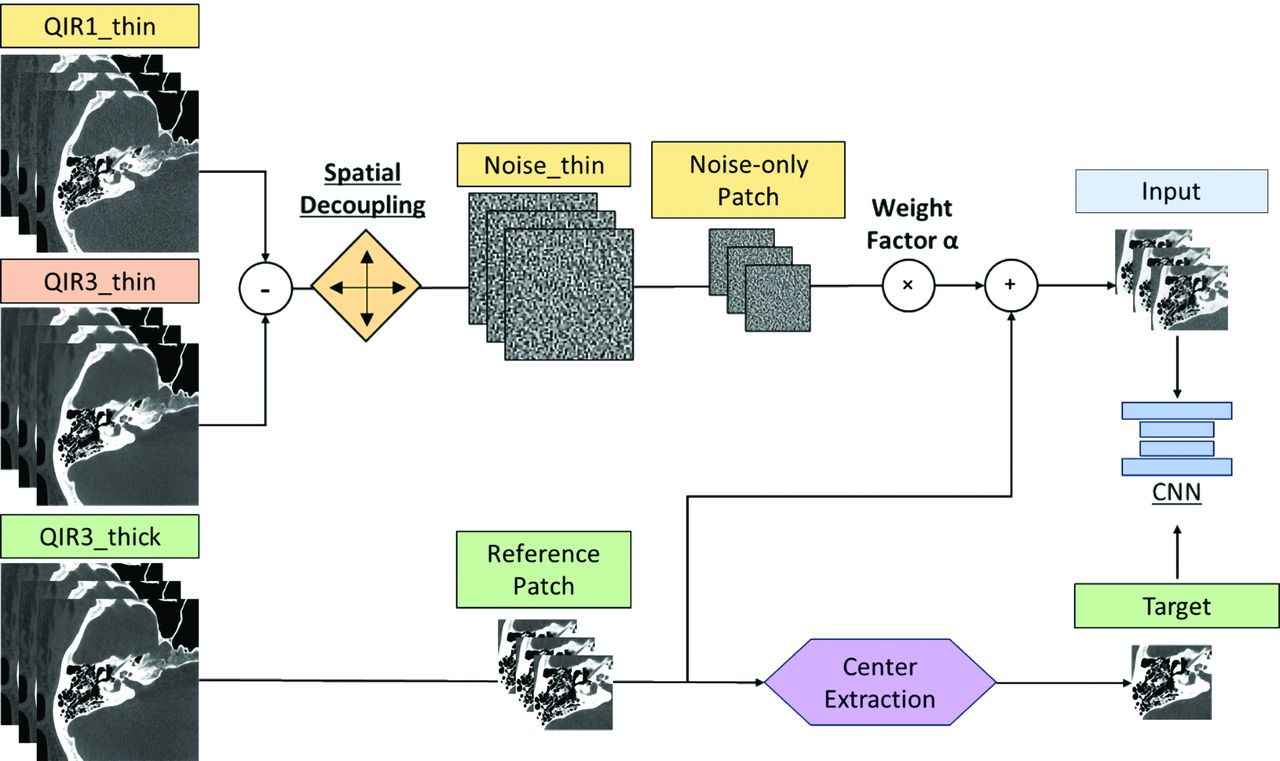
Figure 2 outlines our denoising CNN training workflow that begins by creating “Noise thin” images. These are generated by subtracting thin-slice iterative reconstructions with strengths 1_(QIR1_thin) and 3 (QIR3_thin), both set at a 0.2-mm slice thickness and increment, at the same anatomic location (higher strength settings perform more aggressive denoising). To prevent overfitting and introduce variability, we applied spatial decoupling techniques to Noise thin images through random translations (ranging from 1 to 16 pixels) and inversions (using multipliers of +1 or −1) to create a set of randomized noise images.

The overall workflow of the proposed deep CNN denoising method. All training data originated from patient image series reconstructed using 2 iterative reconstruction strengths, QIR1 and QIR3, with thin-slice (0.2-mm) and thick-slice (0.4-mm) thicknesses, respectively. A multiple-slice input strategy was implemented to enhance the performance of the CNN.
Additionally, a set of thicker-slice images (0.4-mm thickness, 0.2-mm increment), referred to as “QIR3_thick,” was reconstructed as a low-noise reference. CNN inputs were formed by combining noise-only and reference patches (QIR3_thick + α × Noise_thin) from 7 adjacent slices, with α empirically set at 2.0 to balance noise reduction and detail preservation.15 The central slice patch of QIR3_thick was the training target. As demonstrated in a previous study,14 training the CNN with thick reference images results in significantly improved noise reduction compared with using single-slice reference images. Moreover, the performance of the CNN remains consistent when applied to single-slice images, even though it was trained on thick images. This outcome is because the network focuses on learning noise patterns rather than the underlying tissue structures. Finally, the trained denoising efficacy of the CNN was then tested on thin QIR1 images.
Network Architecture and Training Details
We used a simplified U-Net architecture17 with 9 modules for our study. Each module sequentially performs convolution, batch normalization, and exponential linear unit activation operations. The architecture includes max pooling layers, convolution transpose operators, and concatenation to maintain input-output similarity. The mean-squared-error loss function was optimized during training. Our final training set comprised 18,864 patches of 128 × 128 pixels from the training data and 2096 from validation data, at a 9:1 ratio. Training began with an initial learning rate of 0.001, progressively reduced to 0.00001, using the Adam optimizer (https://www.geeksforgeeks.org/adam-optimizer/)18 to minimize the mean-squared-error loss function. We set the training for 100 epochs to ensure model convergence.
Phantom Experiments to Evaluate Noise and Spatial Resolution
A 20-cm-diameter American College of Radiology (ACR) CT accreditation phantom (Gammex; Sun Nuclear) was scanned to evaluate the noise power spectrum (NPS) and the contrast-dependent modulation transfer function (MTFc). All acquisitions and reconstructions were performed according to the clinical protocol settings used in this study. MTFc and NPS were calculated with data from Hr84-QIR3, Hr96-QIR3, and Hr96-CNN, using the online platform (https://www.ctpro.net) to illustrate the noise and resolution changes across different methods. In this study, NPS was computed by placing 10 square ROIs in the uniform section (module 3) of the ACR phantom. MTFc was calculated using bone cylindrical inserts (25-mm diameter, 4-cm depth) in module 1 of the phantom, on the basis of 40 consecutive axial slices, to assess in-plane spatial resolution under high-contrast conditions. A circular ROI was placed around the insert, and a circular-edge technique was used to measure the edge spread function by plotting the Hounsfield unit value of each pixel as a function of the distance from the center of the insert. The line spread function was then derived from the edge spread function. After zero padding, a fast Fourier transform was applied to the line spread function to compute the in-plane MTFc.
Objective Image-Quality Assessment
For image-quality evaluation, noise was measured in the axial images as the SD of CT numbers in a circular ROI drawn in a uniform soft-tissue area for each data set. The size and location of ROIs were matched among 3 image sets (Hr84-QIR3, Hr96-QIR3, and Hr96-CNN).
Reader Evaluation
Two fellowship-trained neuroradiologists (with >10 years’ experience each) assessed the overall image quality and delineation of 3 key anatomic structures—modiolus, stapes footplate, and incudomallear joint—for each of the 20 test cases. They assessed 3 image series per case (Hr84-QIR3, Hr96-QIR3, and Hr96-CNN), which were displayed side-by-side in a randomized and blinded manner. Images were ranked on a scale from 1 to 3, with 1 as the most preferred and 3 as the least preferred. Equal ranking was permitted.
Statistical Analyses
Statistical analyses were conducted using the statistical package scikit-posthocs in Python (https://scikit-posthocs.readthedocs.io/en/latest/). Pair-wise comparisons were performed with the Conover post hoc test, applying a Bonferroni correction, to evaluate differences between the 2 variables: the average rankings from 2 readers on overall image quality and diagnostic confidence for discerning 3 anatomic structures across Hr84-QIR3, Hr96-QIR3, and Hr96-CNN. A P value < .05 was considered statistically significant.
Denoising Performance Comparison
The residual encoder-decoder convolutional neural network (RED-CNN) and U-Net are 2 of the most widely used models for CT image denoising.19 Using our proposed data set preparation workflow, we conducted a comparative analysis of the denoising performance between RED-CNN and the U-Net model we developed. Hr96-QIR1 was used as the input reference, while Hr96-QIR3 served as the conventional denoised reconstruction. We compared the difference images generated by subtracting the reference noisy input image from the conventional method, RED-CNN, and U-Net denoised images. Image quality was objectively assessed using the structural similarity index (SSIM) and image noise measurements for each image set. This analysis was repeated at the patient level, with the mean (SD) of these metrics reported.
RESULTS
NPS and MTFc Performance on the ACR Phantom
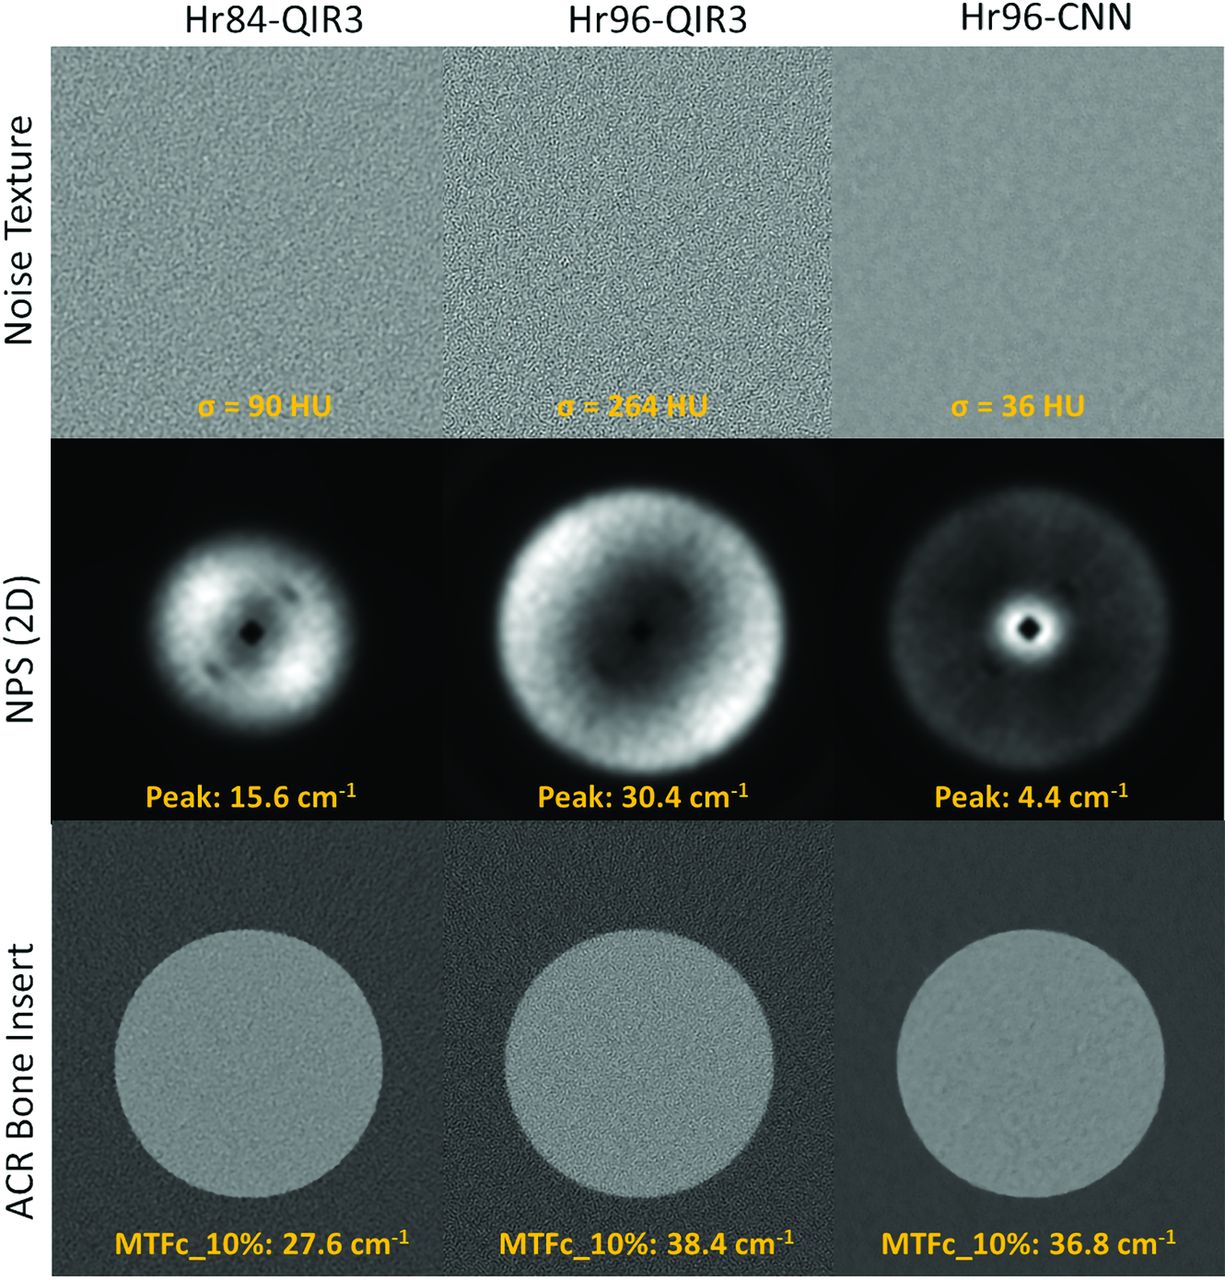
Figure 3 illustrates the noise textures, NPS, and MTFc for the bone insert from axial slices of the ACR phantom across 3 configurations: Hr84-QIR3, Hr96-QIR3, and Hr96-CNN. The noise levels in Hr84-QIR3 (σ = 90 HU) and Hr96-QIR3 (σ = 264 HU) are higher than those in Hr96-CNN (σ = 36 HU), with the noise in these images exhibiting higher spatial frequency components. This feature is consistent with the NPS measurements shown in the middle panel of Fig 3. The NPS peak for Hr96 decreases from 30.4 to 4.4 cm−1 after applying CNN denoising, whereas the NPS peak for Hr84-QIR3 is at 15.6 cm−1. The MTFc results for the bone insert are displayed in the bottom panel of Figure 3. The spatial frequencies at 10% indicate that both Hr96-QIR3 and Hr96-CNN, using the sharp kernel, offer better MTFc performance than the clinical routine Hr84-QIR3. The CNN denoising method preserved resolution in the Hr96 sharp kernel, with the 10% MTFc at 36.8 and 38.4 cm−1 for the CNN and QIR3, respectively.

Noise textures, NPS, and MTFc for the bone insert from axial slices of the ACR phantom for Hr84-QIR3, Hr96-QIR3, and Hr96-CNN, displayed under a fixed window and level.
Sample Images
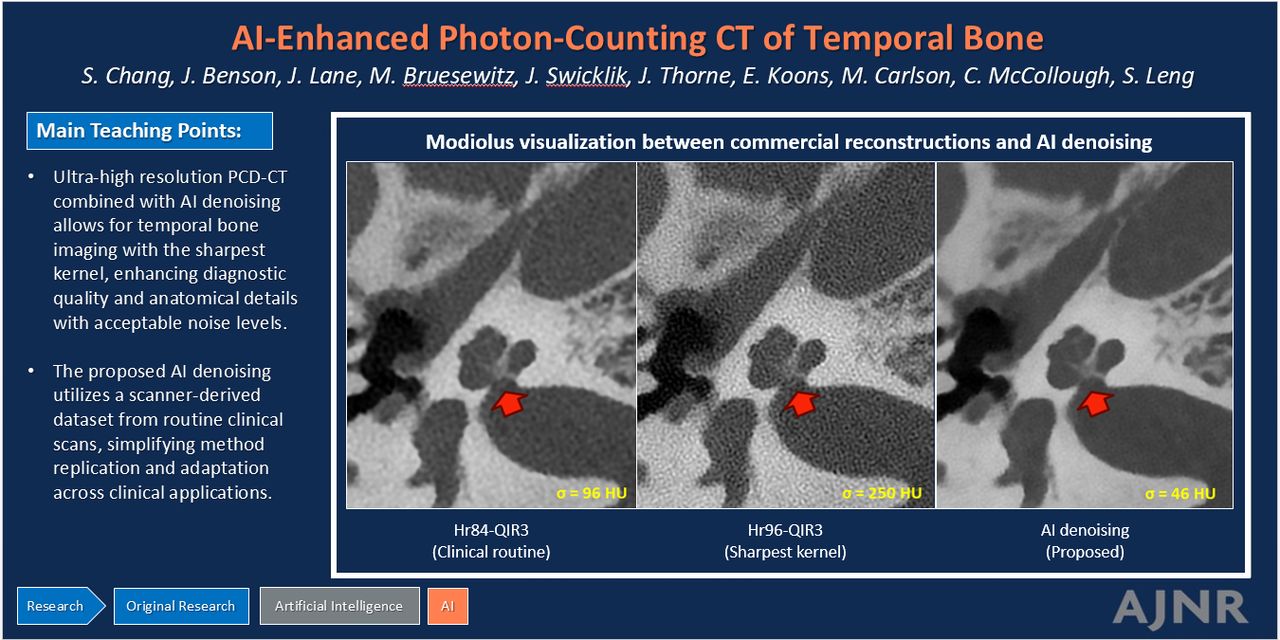
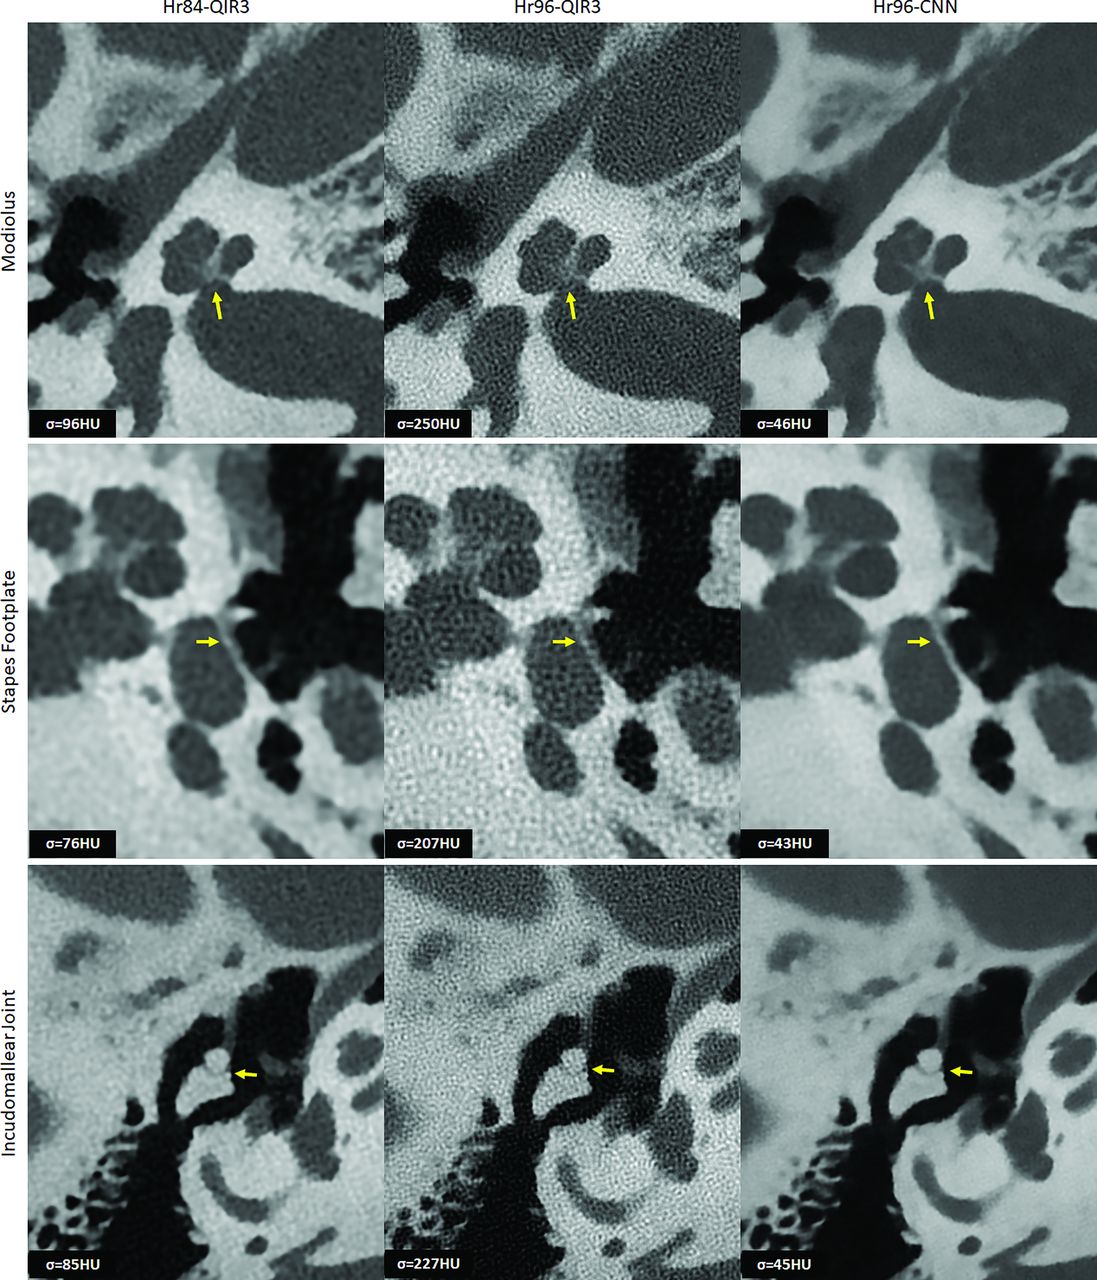
Figure 4 displays representative images of the modiolus, stapes footplate, and the incudomallear joint using Hr84-QIR3, Hr96-QIR3, and Hr96-CNN and highlights the enhanced capability of CNN denoising at the highest resolution (Hr96) to clearly delineate each evaluated structure with acceptable noise levels. The CNN effectively reduced image noise by approximately 80% compared with the highest-resolution commercial images (Hr96-QIR3) and by 50% relative to clinical routine images (Hr84-QIR3), while demonstrating UHR (as assessed visually). Compared with the routine images (Hr84-QIR3), CNN-denoised UHR images (Hr96-CNN) show substantially improved spatial resolution and better delineation of key anatomic structures.

Representative images of the modiolus, stapes footplate, and incudomallear joint using 3 different reconstructions: Hr84-QIR3, Hr96-QIR3, and Hr96-CNN (W/L: 4000/1000 HU). Enhanced visualization with improved resolution and reduced noise is demonstrated, as indicated by the yellow arrows, the Hr96-CNN provides improved delineation of three key anatomic structures. Image noise was quantified by measuring the SD of CT numbers within a circular ROI placed in a uniform soft-tissue area, with values recorded in the lower left corner of each image.
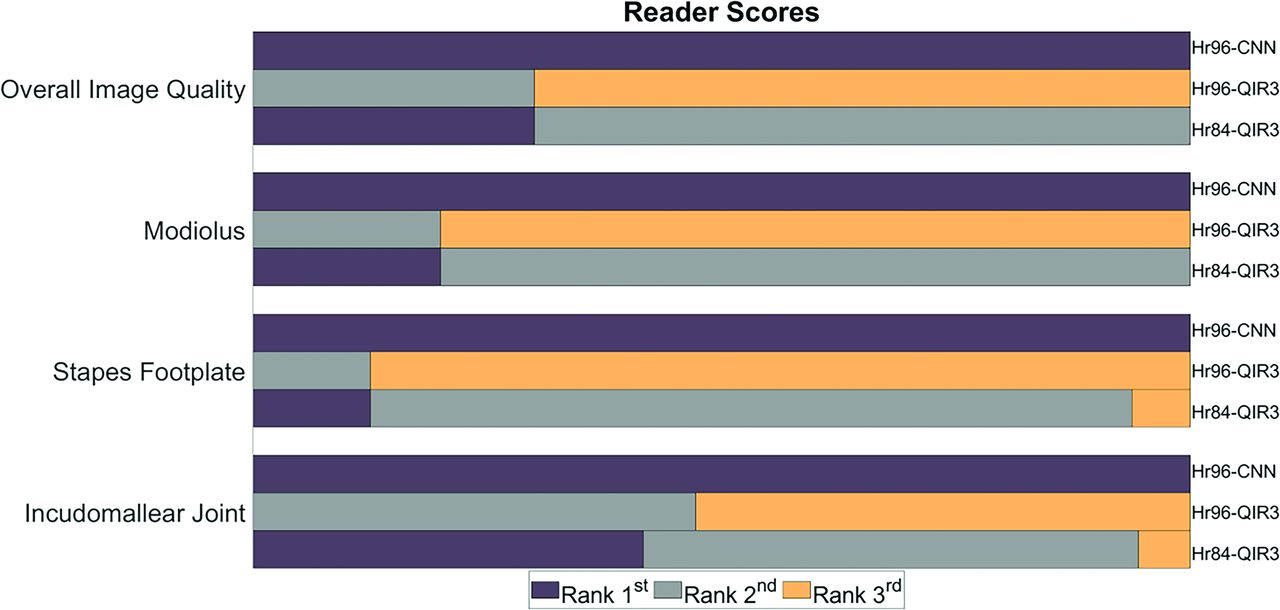
Reader Evaluation
Figure 5 shows the results of the reader study. For overall image quality, Hr96-CNN images were ranked significantly higher than both Hr84-QIR3 (P < .001) and Hr96-QIR3 (P < .001). Both readers preferred CNN denoising images for visualization of all 3 anatomic structures: the modiolus (Hr96-CNN/Hr84-QIR3/HR96-QIR3: 1/1.8/2.8, P < .001), the stapes footplates (Hr96-CNN/Hr84-QIR3/HR96-QIR3: 1/1.94/2.88, P < .001), and the incudomallear joint (Hr96-CNN/Hr84-QIR3/HR96-QIR3: 1/1.64/2.53, P < .001). In both evaluations, equal ranking was allowed.

Rankings from 2 readers regarding overall image quality and delineation of 3 key anatomic structures. For all 3 structures and overall image quality, CNN-Hr96 images rank the highest. Dull purple indicates the first rank; medium gray, the second rank; gold, the third rank.
Denoising Performance Comparison
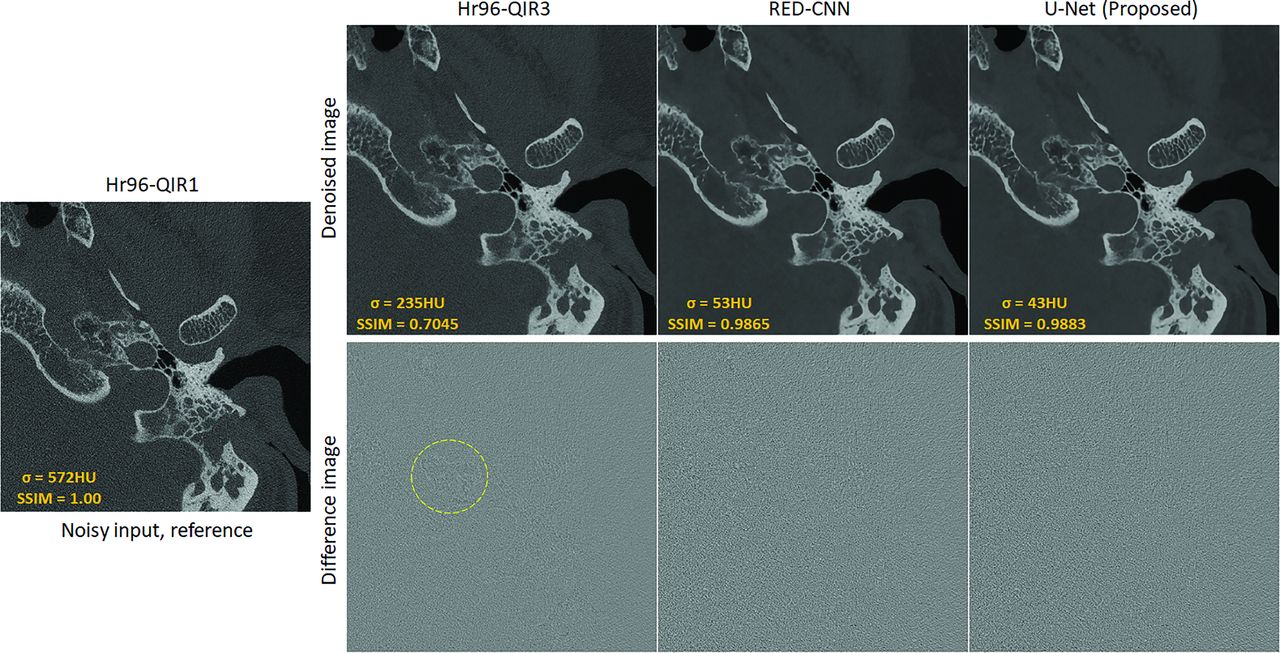
Figure 6 presents a sample slice from 1 subject in the test data set, processed using the conventional Hr96-QIR3, RED-CNN, and the proposed U-Net, along with their corresponding difference images compared with the reference input. Both the conventional and CNN-based denoising methods successfully reduce noise relative to the reference. Specifically, noise levels were reduced from 572 to 235 HU, 53 HU, and 43 HU using Hr96-QIR3, RED-CNN, and the proposed U-Net, respectively. As demonstrated in the difference images, the CNN-based denoising methods primarily remove noise, whereas the conventional method (Hr96-QIR3) also removes subtle structures, as indicated by the yellow dashed circle. This observation is further supported by the SSIM values of 0.7045, 0.9865, and 0.9883 for Hr96-QIR3, RED-CNN, and U-Net, respectively. Moreover, the comparison between the RED-CNN and U-Net indicates that the proposed data-preparation workflow performs effectively across different network architectures, achieving satisfactory denoising performance while preserving fine structural details. At the patient-level comparison, shown in the Table, the proposed U-Net notably improves image quality. Compared with the conventional method (Hr96-QIR3), the U-Net significantly reduces image noise (from 204.63 to 47.35 HU) and enhances the SSIM (from 0.72 to 0.99).

Sample slice from the test data set processed with Hr96-QIR3, RED-CNN, and the proposed U-Net, alongside their corresponding difference images compared with the reference input. The CNN-based methods (RED-CNN and U-Net) primarily reduce noise, while the conventional Hr96-QIR3 also removes subtle anatomic structures (indicated by the yellow dashed circle). The display window is W/L: 4000/1000 HU for patient images and 3000/1000 HU for difference images.
| Quality Metrics | Hr96-QIR1 | Hr96-QIR3 | RED-CNN | U-Net (Proposed) |
|---|---|---|---|---|
| Image noise | 500.15 (SD, 52.38) | 204.63 (SD, 21.70) | 52.8 (SD, 1.17) | 47.35 (SD, 2.62) |
| SSIM | 1.00 (SD, 0.00) | 0.72 (SD, 0.05) | 0.98 (SD, 0.02) | 0.99 (SD, 0.01) |
Quantitative comparison (mean) at the patient level across the conventional method (Hr96-QIR3), RED-CNN, and U-Net
DISCUSSION
In this work, the proposed CNN significantly reduced image noise in UHR PCD-CT, allowing the use of the sharpest kernel with acceptable noise levels, unlocking the full potential of the UHR PCD-CT system. This combination of CNN denoising and UHR PCD-CT substantially enhanced the diagnostic image quality and improved visualization of critical anatomic structures.
Previous research20,21 demonstrated that the spatial resolution of PCD-CT was not fully used in routine practice. Graafen et al10 investigated the impact of kernel sharpness on image quality and concluded that soft reconstruction kernels yielded the best overall quality for the evaluation of hepatocellular carcinoma in PCD-CT. The primary reason is the extensive noise associated with sharper kernels, which can compromise diagnostic clarity. Although some studies have used noise-reduction techniques, including deep learning methods, to denoise UHR PCD-CT images, these efforts have not maximized the use of the sharpest available kernels. Our approach using CNN denoising allows the use of the sharpest kernel in the UHR PCD-CT, maintaining acceptable noise levels and broadening its clinical applicability. The proposed method is fully based on images from patients’ routine clinical examinations, without the need for additional low-dose images or any proprietary information. This flexibility allows the method to be adapted to any scanner. Furthermore, noise-only images in the workflow were generated from the same kernel reconstructions at different strengths, making it a kernel-based approach that can be applied to both smooth and sharp kernels for various imaging tasks, such as coronary and abdominal imaging. Additionally, the weight factor in the workflow allows control over the level of noise reduction, accommodating the reader’s preference for noise acceptability.
This proof-of-concept study has several limitations. First, the sample size of 20 testing patient cases was relatively small. Future research will expand the sample size for more robust statistical analysis and validation of findings. Second, the study focused solely on demonstrating image-quality improvement without targeting specific diagnostic tasks. This focus represents the initial step in demonstrating the feasibility and potential of the algorithm. Future studies on diagnostic performance and clinical significance are warranted, including assessing how denoising affects the visibility of pathologies. Furthermore, the proposed CNN denoising offers significant potential for radiation dose reduction while maintaining clinically acceptable image quality. Because spatial resolution, image noise, and radiation dose are interrelated, the CNN denoising can be used to either improve spatial resolution, reduce image noise, or reduce the radiation dose, or a combination.
CONCLUSIONS
We developed and evaluated a dedicated deep learning–based denoising method for UHR PCD-CT. This method uses a training data set sourced from commercially available images, requiring no additional data preparation. The application of this algorithm in temporal bone imaging shows high-resolution and low-noise images with improved anatomic delineation. This advancement significantly enhances temporal bone visualization by fully using the spatial resolution capabilities of PCD-CT.
Footnotes
Research reported in this work was supported by the National Institutes of Health under award No. R01 EB028590.
The content is solely the responsibility of the authors and does not necessarily represent the official views of the National Institutes of Health.
Disclosure forms provided by the authors are available with the full text and PDF of this article at www.ajnr.org.
References
- 1.
- 2.
- 3.
- 4.
- 5.
- 6.
- 7.
- 8.
- 9.
- 10.
- 11.
- 12.
- 13.
- 14.
- 15.
- 16.
- 17.
- 18.
- 19.
- 20.
- 21.
- Received August 5, 2024.
- Accepted after revision November 7, 2024.
- © 2025 by American Journal of Neuroradiology