Advertisement

Main menu

  • Home
  • Content
    • Current Issue
    • Accepted Manuscripts
    • Article Preview
    • Past Issue Archive
    • Video Articles
    • AJNR Case Collection
    • Case of the Week Archive
    • Case of the Month Archive
    • Classic Case Archive
  • Special Collections
    • AJNR Awards
    • Low-Field MRI
    • Alzheimer Disease
    • ASNR Foundation Special Collection
    • Photon-Counting CT
    • View All
  • Multimedia
    • AJNR Podcasts
    • AJNR SCANtastic
    • Trainee Corner
    • MRI Safety Corner
    • Imaging Protocols
  • For Authors
    • Submit a Manuscript
    • Submit a Video Article
    • Submit an eLetter to the Editor/Response
    • Manuscript Submission Guidelines
    • Statistical Tips
    • Fast Publishing of Accepted Manuscripts
    • Graphical Abstract Preparation
    • Imaging Protocol Submission
    • Author Policies
  • About Us
    • About AJNR
    • Editorial Board
    • Editorial Board Alumni
  • More
    • Become a Reviewer/Academy of Reviewers
    • Subscribers
    • Permissions
    • Alerts
    • Feedback
    • Advertisers
    • ASNR Home

User menu

  • Alerts
  • Log in

Search

  • Advanced search
American Journal of Neuroradiology

American Journal of Neuroradiology

ASHNR American Society of Functional Neuroradiology ASHNR American Society of Pediatric Neuroradiology ASSR
  • Alerts
  • Log in

Advanced Search

  • Home
  • Content
    • Current Issue
    • Accepted Manuscripts
    • Article Preview
    • Past Issue Archive
    • Video Articles
    • AJNR Case Collection
    • Case of the Week Archive
    • Case of the Month Archive
    • Classic Case Archive
  • Special Collections
    • AJNR Awards
    • Low-Field MRI
    • Alzheimer Disease
    • ASNR Foundation Special Collection
    • Photon-Counting CT
    • View All
  • Multimedia
    • AJNR Podcasts
    • AJNR SCANtastic
    • Trainee Corner
    • MRI Safety Corner
    • Imaging Protocols
  • For Authors
    • Submit a Manuscript
    • Submit a Video Article
    • Submit an eLetter to the Editor/Response
    • Manuscript Submission Guidelines
    • Statistical Tips
    • Fast Publishing of Accepted Manuscripts
    • Graphical Abstract Preparation
    • Imaging Protocol Submission
    • Author Policies
  • About Us
    • About AJNR
    • Editorial Board
    • Editorial Board Alumni
  • More
    • Become a Reviewer/Academy of Reviewers
    • Subscribers
    • Permissions
    • Alerts
    • Feedback
    • Advertisers
    • ASNR Home
  • Follow AJNR on Twitter
  • Visit AJNR on Facebook
  • Follow AJNR on Instagram
  • Join AJNR on LinkedIn
  • RSS Feeds

AJNR Awards, New Junior Editors, and more. Read the latest AJNR updates

Research ArticleAdult Brain
Open Access

Cellular Density in Adult Glioma, Estimated with MR Imaging Data and a Machine Learning Algorithm, Has Prognostic Power Approaching World Health Organization Histologic Grading in a Cohort of 1181 Patients

E.D.H. Gates, D. Suki, A. Celaya, J.S. Weinberg, S.S. Prabhu, R. Sawaya, J.T. Huse, J.P. Long, D. Fuentes and D. Schellingerhout
American Journal of Neuroradiology September 2022, DOI: https://doi.org/10.3174/ajnr.A7620
E.D.H. Gates
aFrom the Departments of Imaging Physics (E.D.H.G., A.C., D.F.)
fUniversity of Texas MD Anderson Cancer Center UTHealth Houston Graduate School of Biomedical Sciences (E.D.H.G.), Houston, Texas
  • Find this author on Google Scholar
  • Find this author on PubMed
  • Search for this author on this site
  • ORCID record for E.D.H. Gates
D. Suki
bNeurosurgery (D. Suki, J.S.W., S.S.P., R.S.)
  • Find this author on Google Scholar
  • Find this author on PubMed
  • Search for this author on this site
  • ORCID record for D. Suki
A. Celaya
aFrom the Departments of Imaging Physics (E.D.H.G., A.C., D.F.)
  • Find this author on Google Scholar
  • Find this author on PubMed
  • Search for this author on this site
  • ORCID record for A. Celaya
J.S. Weinberg
bNeurosurgery (D. Suki, J.S.W., S.S.P., R.S.)
  • Find this author on Google Scholar
  • Find this author on PubMed
  • Search for this author on this site
  • ORCID record for J.S. Weinberg
S.S. Prabhu
bNeurosurgery (D. Suki, J.S.W., S.S.P., R.S.)
  • Find this author on Google Scholar
  • Find this author on PubMed
  • Search for this author on this site
  • ORCID record for S.S. Prabhu
R. Sawaya
bNeurosurgery (D. Suki, J.S.W., S.S.P., R.S.)
  • Find this author on Google Scholar
  • Find this author on PubMed
  • Search for this author on this site
  • ORCID record for R. Sawaya
J.T. Huse
cTranslational Molecular Pathology (J.T.H.)
  • Find this author on Google Scholar
  • Find this author on PubMed
  • Search for this author on this site
  • ORCID record for J.T. Huse
J.P. Long
dBiostatistics (J.P.L.)
  • Find this author on Google Scholar
  • Find this author on PubMed
  • Search for this author on this site
  • ORCID record for J.P. Long
D. Fuentes
aFrom the Departments of Imaging Physics (E.D.H.G., A.C., D.F.)
  • Find this author on Google Scholar
  • Find this author on PubMed
  • Search for this author on this site
  • ORCID record for D. Fuentes
D. Schellingerhout
eNeuroradiology and Imaging Physics (D. Schellingerhout)
  • Find this author on Google Scholar
  • Find this author on PubMed
  • Search for this author on this site
  • ORCID record for D. Schellingerhout
  • Article
  • Figures & Data
  • Info & Metrics
  • Responses
  • References
  • PDF
Loading

Article Figures & Data

Figures

  • Tables
  • FIG 1.
    • Download figure
    • Open in new tab
    • Download powerpoint
    FIG 1.

    Flow chart for patient selection in the retrospective data. Ambiguous imaging time means the imaging and operation were on the same day. A complete study includes at least one of each of the following: T1-weighted precontrast, T1-weighted postcontrast, T2-weighted, and FLAIR images.

  • FIG 2.
    • Download figure
    • Open in new tab
    • Download powerpoint
    FIG 2.

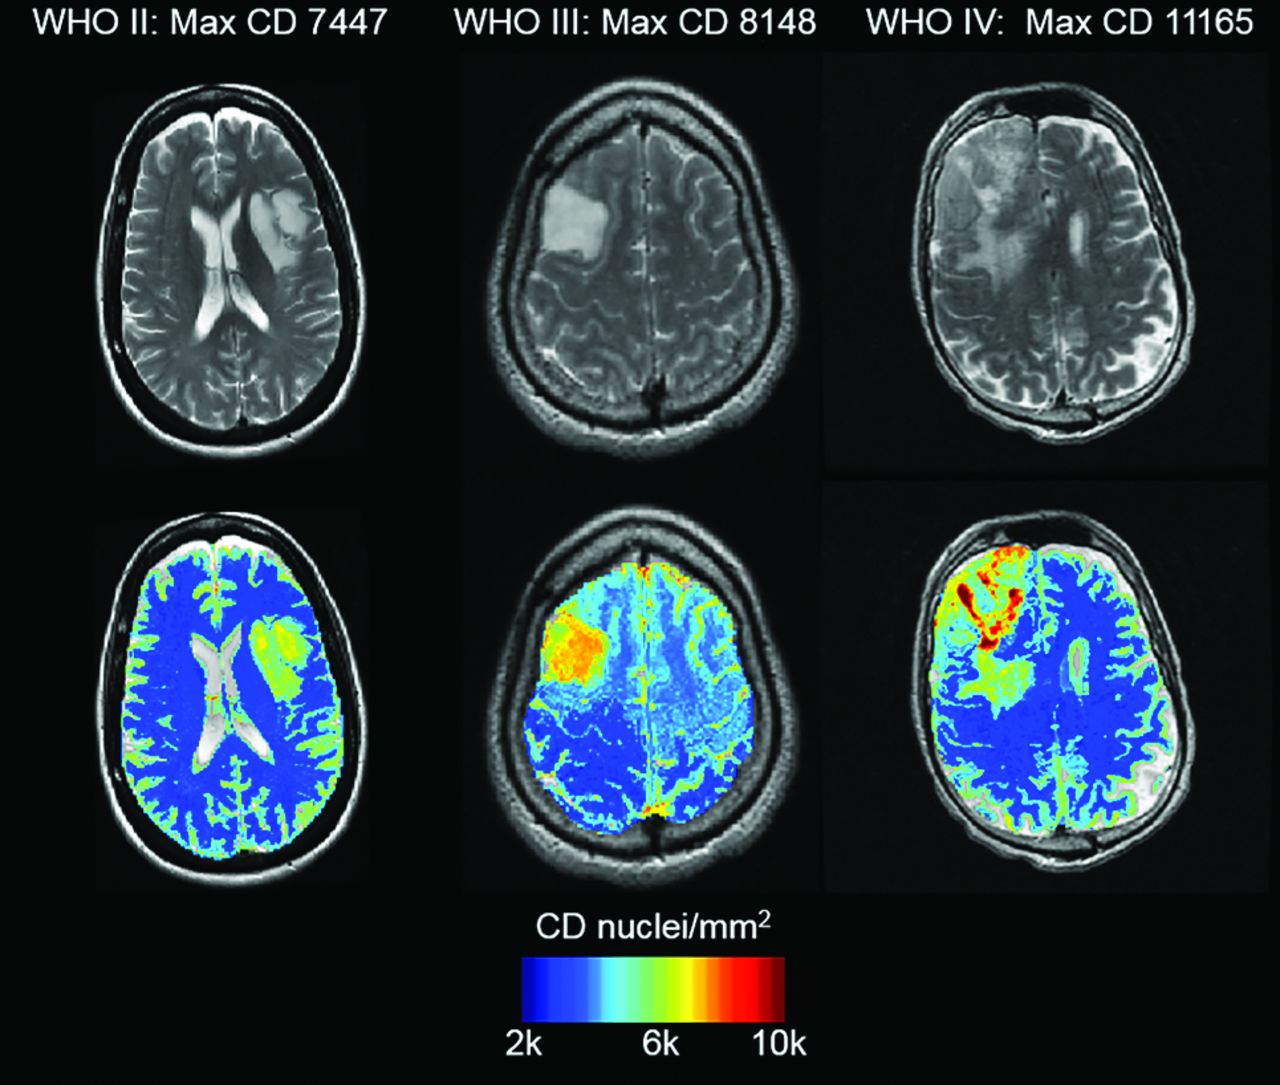
    Maps of estimated CD for gliomas of known WHO grades. T2-weighted images are shown in the upper row for reference. Note the graphic nature of CD estimates and how CD maps can be used for image-guided therapy.

  • FIG 3.
    • Download figure
    • Open in new tab
    • Download powerpoint
    FIG 3.

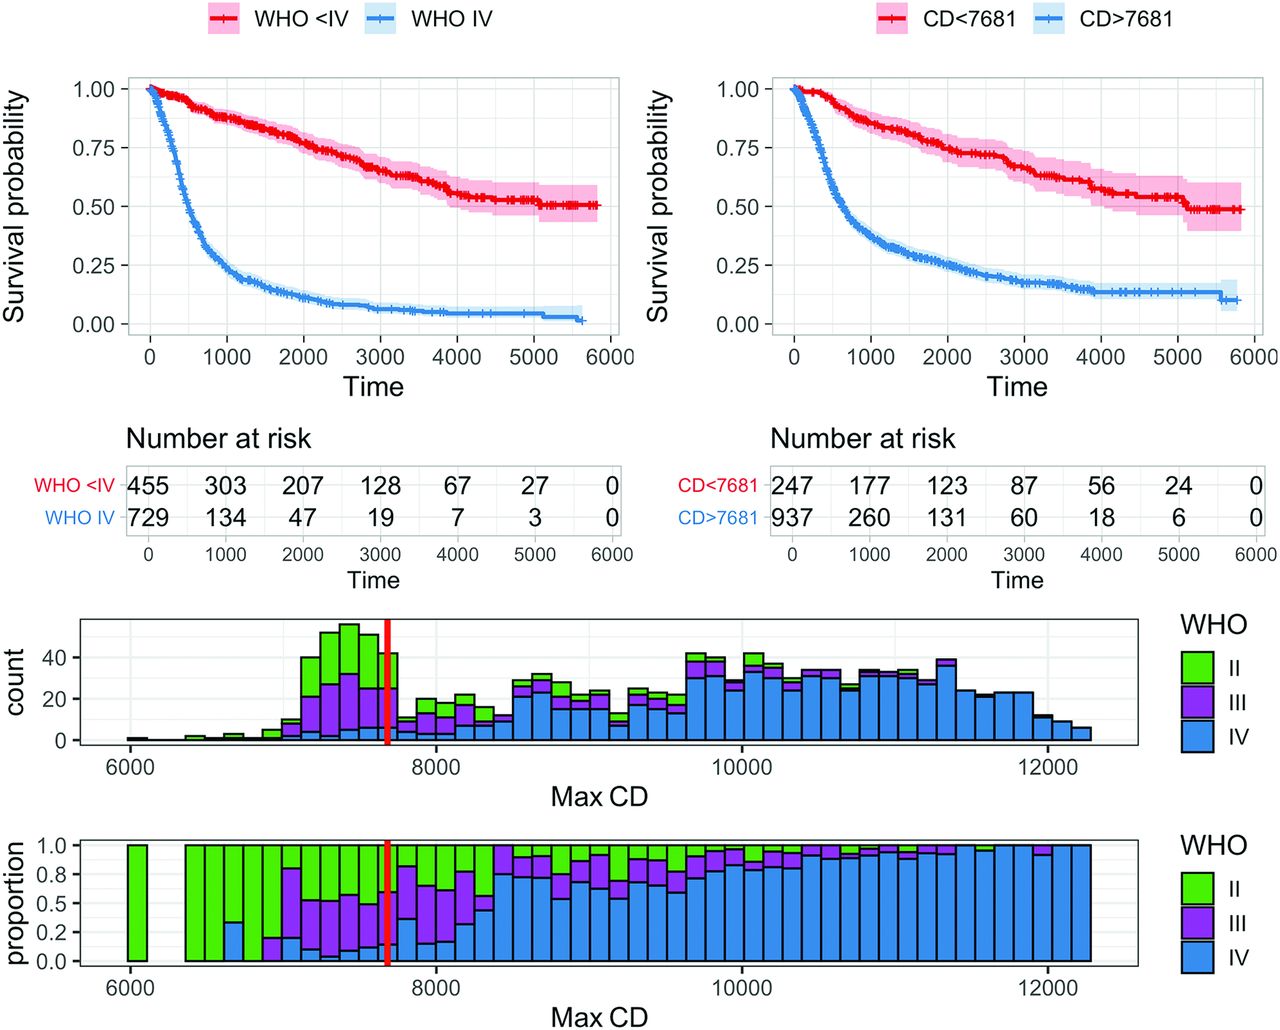
    The best CD (in nuclei/square millimeters) measure for dichotomizing survival in adult gliomas is a max CD (stabilized with 0.01-cm3 volume constraint) of 7681 nuclei/mm2. Upper left: Patients with WHO grade IV gliomas have much worse overall survival (median, 497 days) than patients with WHO II or III gliomas (median unreached, 75% survival at 2131 days). Upper right: An optimal cutoff (maximizing hazard ratio) of 7681 nuclei/mm2 divides the glioma population into groups with median survivals of 630 and 5120 days, respectively (log-rank, P < .001). Lower row: A histogram of all cases (bin size = 123 nuclei/mm2) demonstrates stabilized max CD values ranging from 6089 to 12,260 with an interquartile range of 7632–10,717 and a mean of 9175. WHO grade II, III, and IV cases are color-coded, and the optimized cutoff value used in the upper right panel (7681 nuclei/mm2) is shown with a solid red line. The lower histogram has all bins scaled to height 1 to show the relative proportion of each WHO grade in each bin.

  • FIG 4.
    • Download figure
    • Open in new tab
    • Download powerpoint
    FIG 4.

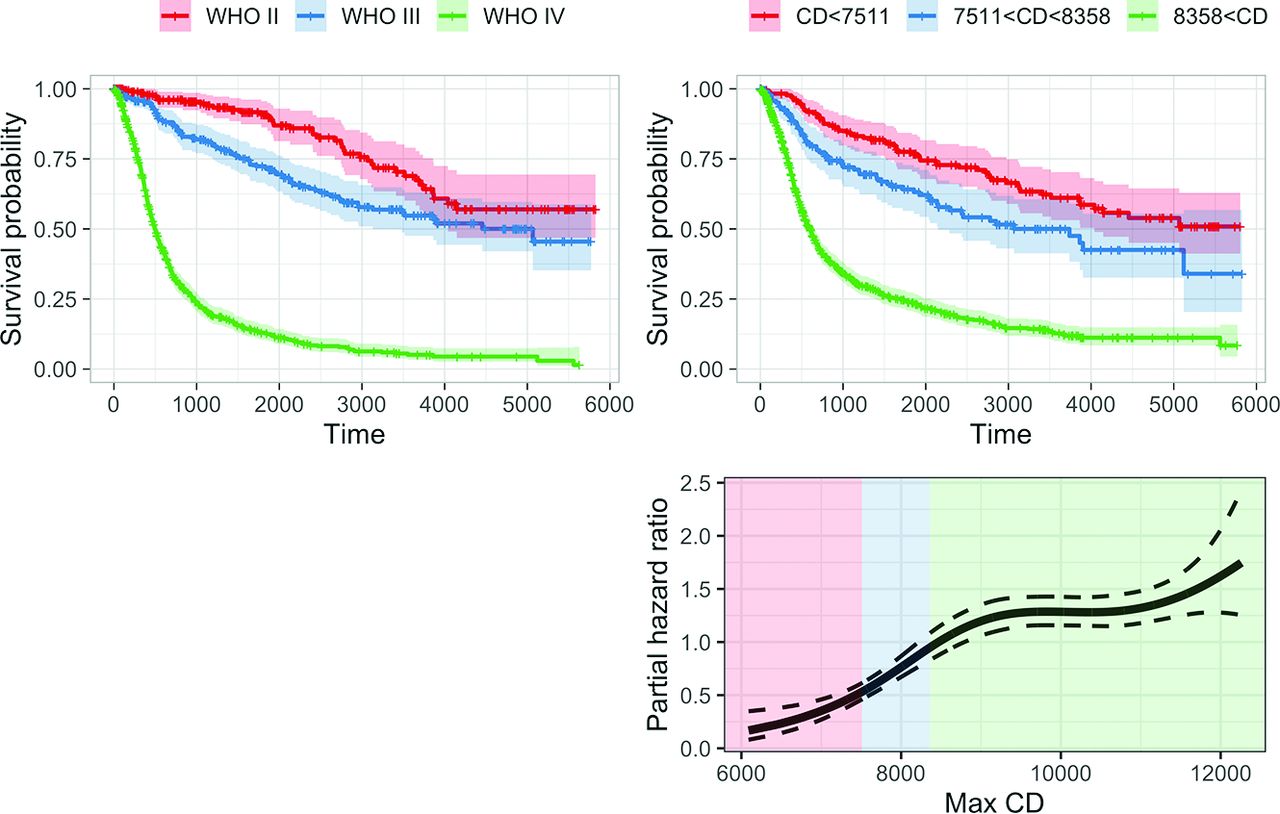
    Upper left: Survival curves stratified by WHO grade. Median survival for WHO grades II, III, and IV: unreached, 3486 days, 497 days, respectively. Upper right: CD thresholds at 7443 and 8358 nuclei separate patients into 3 survival groups that are similar to the WHO II, III, and IV groups (median survival unreached, 3738 days, and 603 days, respectively). There is a significant difference in the red and blue survival curves (log-rank, P = .004). Lower right: P-spline fit (3 degrees of freedom) for nonlinear estimation of the hazard ratio with respect to CD for constant age and KPS. The reference point, hazard ratio 1, is arbitrary. The shaded background corresponds to the three groupings based on CD shown in the upper right panel. Dashed lines are 95% confidence intervals. Relative risk increases with increasing CD up to a max CD of about 9000 nuclei/mm2, after which it plateaus. Max CD allows a continuous estimate of risk, unlike the categoric WHO grade.

Tables

  • Figures
    • View popup
    Table 1:

    Clinical data summary of the 1181 cases analyzeda

    WHO GradeNo.Age (yr)Sex (Male/Female)Median KPS ScoreMedian Tumor Volume (mL)Max CD (Nuclei/mm2)Median OS (Days)
     II20740 (SD, 12)121/869037.168059 (SD, 1048)NAb
     III24643 (SD, 14)135/1119047.258401 (SD, 1198)5066
     IV72859 (SD, 13)446/2829072.6410,218 (SD, 1167)495
    • Note:—NA indicates not achieved; OS, overall survival.

    • ↵a Tumor volume measurements were extracted from records collected before this study. Age and max CD are listed as means.

    • ↵b Median survival was not reached for the WHO II group; the lowest fraction was 58% survival reached at 4147 days.

    • View popup
    Table 2:

    Survival modeling for patients with all WHO grades (II, III, IV)a

    UnivariateMultivariate
    HR95% CIPHR95% CIP
    Model A: C = 0.761
     Age older than 55 yr3.69(3.16–4.31)<.0012.05(1.74–2 .42)<.001
     KPS <903.05(2.61–3.57)<.0011.68(1.43–1.98)<.001
     WHO grade IV7.57(6.18–9.27)<.0015.25(4.23–6.53)<.001
    Model B: C = 0.734
     Age older than 55 yr3.69(3.16–4.31)<.0012.74(2.33–3.22)<.001
     KPS <903.05(2.61–3.57)<.0012.02(1.72–2.38)<.001
     Max CD >76814.21(3.05–4.42)<.0012.91(2.28–3.71)<.001
    Model C: C = 0.764
     Age >older than 55 yr3.69(3.16–4.31)<.0012.02(1.72–2.39)<.001
     KPS <903.05(2.61–3.57)<.0011.67(1.42–1.96)<.001
     WHO grade IV7.57(6.18–9.27)<.0014.60(3.60–5.87)<.001
     Max CD >76814.21(3.05–4.42)<.0011.36(1.03–1.80).03
    • Note:—HR indicates hazard ratio; C, C-index.

    • ↵a The univariate P values for max CD are corrected for multiple comparisons. The multivariate HRs are for models using only the factors listed in the specific panel. A) HRs for clinical factors and high WHO grade. B) HR for clinical factors and max CD (nuclei/square millimeter). C) HR for clinical factors, high WHO grade, and max CD. HRs for WHO grading are higher than those for max CD, but max CD retains a predictive value even when WHO grading is included in model C.

    • View popup
    Table 3:

    Patient numbers by max CD ranges (nuclei/square millimeter) and WHO gradea

    Cellular Density Cutoff RangesWHO IIMedian OS: NA95% CI, 4040 to NAWHO IIIMedian OS: 5066 95% CI, 3486 to NAWHO IVMedian OS: 49595% CI, 463–538
    CD, <7443Median OS: NA95% CI, 4444 to NA656913
    7443 < CD < 8358Median OS: 373895% CI, 2452 to NA848035
    8358 < CDMedian OS: 60395% CI, 535–6585797679
    • Note:—NA indicates not achieved; OS, overall survival.

    • ↵a The cutoff values for CD were calibrated to separate WHO IV cases from WHO II and III cases and WHO II and III cases from each other using ROC analysis. The off-diagonal values in this matrix speak to the nonredundancy of information captured by CD and WHO grading, respectively.

PreviousNext
Back to top
Advertisement
Print
Download PDF
Email Article

Thank you for your interest in spreading the word on American Journal of Neuroradiology.

NOTE: We only request your email address so that the person you are recommending the page to knows that you wanted them to see it, and that it is not junk mail. We do not capture any email address.

Enter multiple addresses on separate lines or separate them with commas.
Cellular Density in Adult Glioma, Estimated with MR Imaging Data and a Machine Learning Algorithm, Has Prognostic Power Approaching World Health Organization Histologic Grading in a Cohort of 1181 Patients
(Your Name) has sent you a message from American Journal of Neuroradiology
(Your Name) thought you would like to see the American Journal of Neuroradiology web site.
CAPTCHA
This question is for testing whether or not you are a human visitor and to prevent automated spam submissions.
Cite this article
E.D.H. Gates, D. Suki, A. Celaya, J.S. Weinberg, S.S. Prabhu, R. Sawaya, J.T. Huse, J.P. Long, D. Fuentes, D. Schellingerhout
Cellular Density in Adult Glioma, Estimated with MR Imaging Data and a Machine Learning Algorithm, Has Prognostic Power Approaching World Health Organization Histologic Grading in a Cohort of 1181 Patients
American Journal of Neuroradiology Sep 2022, DOI: 10.3174/ajnr.A7620

Citation Manager Formats

  • BibTeX
  • Bookends
  • EasyBib
  • EndNote (tagged)
  • EndNote 8 (xml)
  • Medlars
  • Mendeley
  • Papers
  • RefWorks Tagged
  • Ref Manager
  • RIS
  • Zotero
0 Responses
Respond to this article
Share
Bookmark this article
Cellular Density in Adult Glioma, Estimated with MR Imaging Data and a Machine Learning Algorithm, Has Prognostic Power Approaching World Health Organization Histologic Grading in a Cohort of 1181 Patients
E.D.H. Gates, D. Suki, A. Celaya, J.S. Weinberg, S.S. Prabhu, R. Sawaya, J.T. Huse, J.P. Long, D. Fuentes, D. Schellingerhout
American Journal of Neuroradiology Sep 2022, DOI: 10.3174/ajnr.A7620
del.icio.us logo Twitter logo Facebook logo Mendeley logo
  • Tweet Widget
  • Facebook Like
  • Google Plus One
Purchase

Jump to section

  • Article
    • Abstract
    • ABBREVIATIONS:
    • MATERIALS AND METHODS
    • RESULTS
    • DISCUSSION
    • CONCLUSIONS
    • Footnotes
    • References
  • Figures & Data
  • Info & Metrics
  • Responses
  • References
  • PDF

Related Articles

  • No related articles found.
  • PubMed
  • Google Scholar

Cited By...

  • No citing articles found.
  • Crossref (1)
  • Google Scholar

This article has been cited by the following articles in journals that are participating in Crossref Cited-by Linking.

  • Klassifikation von Gliomen anhand der Zelldichte: fast so gut wie WHO-Gradierung
    Neuroradiologie Scan 2023 13 02

More in this TOC Section

  • Diagnostic Neuroradiology of Monoclonal Antibodies
  • Clinical Outcomes After Chiari I Decompression
  • Segmentation of Brain Metastases with BLAST
Show more Adult Brain

Similar Articles

Advertisement

Indexed Content

  • Current Issue
  • Accepted Manuscripts
  • Article Preview
  • Past Issues
  • Editorials
  • Editor's Choice
  • Fellows' Journal Club
  • Letters to the Editor
  • Video Articles

Cases

  • Case Collection
  • Archive - Case of the Week
  • Archive - Case of the Month
  • Archive - Classic Case

More from AJNR

  • Trainee Corner
  • Imaging Protocols
  • MRI Safety Corner
  • Book Reviews

Multimedia

  • AJNR Podcasts
  • AJNR Scantastics

Resources

  • Turnaround Time
  • Submit a Manuscript
  • Submit a Video Article
  • Submit an eLetter to the Editor/Response
  • Manuscript Submission Guidelines
  • Statistical Tips
  • Fast Publishing of Accepted Manuscripts
  • Graphical Abstract Preparation
  • Imaging Protocol Submission
  • Evidence-Based Medicine Level Guide
  • Publishing Checklists
  • Author Policies
  • Become a Reviewer/Academy of Reviewers
  • News and Updates

About Us

  • About AJNR
  • Editorial Board
  • Editorial Board Alumni
  • Alerts
  • Permissions
  • Not an AJNR Subscriber? Join Now
  • Advertise with Us
  • Librarian Resources
  • Feedback
  • Terms and Conditions
  • AJNR Editorial Board Alumni

American Society of Neuroradiology

  • Not an ASNR Member? Join Now

© 2025 by the American Society of Neuroradiology All rights, including for text and data mining, AI training, and similar technologies, are reserved.
Print ISSN: 0195-6108 Online ISSN: 1936-959X

Powered by HighWire