
Abstract
BACKGROUND AND PURPOSE: Prioritizing reading of noncontrast head CT examinations through an automated triage system may improve time to care for patients with acute neuroradiologic findings. We present a natural language-processing approach for labeling findings in noncontrast head CT reports, which permits creation of a large, labeled dataset of head CT images for development of emergent-finding detection and reading-prioritization algorithms.
MATERIALS AND METHODS: In this retrospective study, 1002 clinical radiology reports from noncontrast head CTs collected between 2008 and 2013 were manually labeled across 12 common neuroradiologic finding categories. Each report was then encoded using an n-gram model of unigrams, bigrams, and trigrams. A logistic regression model was then trained to label each report for every common finding. Models were trained and assessed using a combination of L2 regularization and 5-fold cross-validation.
RESULTS: Model performance was strongest for the fracture, hemorrhage, herniation, mass effect, pneumocephalus, postoperative status, and volume loss models in which the area under the receiver operating characteristic curve exceeded 0.95. Performance was relatively weaker for the edema, hydrocephalus, infarct, tumor, and white-matter disease models (area under the receiver operating characteristic curve > 0.85). Analysis of coefficients revealed finding-specific words among the top coefficients in each model. Class output probabilities were found to be a useful indicator of predictive error on individual report examples in higher-performing models.
CONCLUSIONS: Combining logistic regression with n-gram encoding is a robust approach to labeling common findings in noncontrast head CT reports.
ABBREVIATIONS:
- AUPRC
- area under the precision-recall curve
- AUROC
- area under the receiver operating characteristic curve
- NLP
- natural language processing
The noncontrast head CT examination is the technique of choice in assessing patients for most acute neurologic findings.1⇓⇓-4 The presence of any critical findings is not known at the time of scanning, so patients without sufficient symptoms may inadvertently wait several hours before a result is available.5 In this time, the patient’s condition may deteriorate or the opportunity for optimal treatment may close.6,7 This is an unmet clinical need that could be addressed by a prioritization system that would expedite reading of examinations with a strong likelihood of emergent findings.
Deep learning models have demonstrated broad success on medical image–classification tasks.8⇓-10 Specifically, several deep learning models have been trained to recognize acute hemorrhages in noncontrast head CTs.11⇓⇓⇓-15 A priority system for identifying intracranial hemorrhage has been implemented on the basis of an automated screening algorithm and has demonstrated that reading wait times for hemorrhage-positive scans can be reduced without significantly affecting overall turnaround time.16 These successes indicate the potential feasibility and clinical value of prioritization systems for reading head CT examinations.17 Developing algorithms that recognize a plurality of neurologic emergencies could realize similar benefits for a larger patient population.
Although deep learning methods can deliver the high performance needed for a robust head CT screening system, they require vast amounts of labeled data for training and evaluation.18 Manual dataset labeling places an excessive burden on clinical and research staff, raising the need for an alternative approach.19 Alternatively, the content of clinical radiology reports can be parsed and quantitatively summarized using natural language processing (NLP) algorithms.20,21 Rule-based approaches are a class of NLP algorithms in which a group of domain experts generate a set of classification rules. This approach has been applied successfully to identifying intracranial hemorrhage, fracture, midline shift, and mass effect in head CT reports.22 Although rule-based approaches can be effective, creating and modifying them may require substantial effort from domain experts, and these approaches may have difficulty generalizing beyond the training dataset. Instead, classifier-based approaches for labeling radiology reports can be developed using a training dataset. This approach has also demonstrated efficacy for detecting fracture, hemorrhage, or stroke in head CT reports.23
In this article, we present a series of NLP models for labeling noncontrast head CT images using the corresponding clinical radiology reports. Our motivation is to develop a dataset labeling technique for a broad set of common findings. This technique may be used to generate larger datasets of labeled head CT examinations, which can be used to train more advanced head CT prioritization systems. The development of high-performing screening systems for head CT examinations may ultimately reduce the time to treatment for patients with acute neurologic findings.
MATERIALS AND METHODS
Dataset Acquisition and Labeling
Radiology reports for noncontrast head CTs performed in the Chicago metropolitan area were identified through an institutional data warehouse. The reports in this search originated from a combination of inpatient, outpatient, and emergency settings. All procedures for dataset acquisition, analysis, and storage were completed in compliance with the corresponding institutional review board. Criteria for inclusion or exclusion were the following: All subjects were between the ages of 18 and 89 when scanned. All scans occurred between 2008 and 2013. No subjects were known to be pregnant at the time of scanning, determined by filtering out any report that contained the word “pregnant.” If multiple reports were created for an examination, only the most updated report was kept. Finally, all scans without a corresponding accession number were discarded so that the examination could be referenced during labeling to clarify any ambiguities in reporting. There were no further inclusion or exclusion criteria at the report level.
This search yielded a total of 97,553 reports that met the above criteria. Of these, 1002 reports were randomly selected for manual labeling. The remaining reports could not be labeled and were discarded for the remaining analysis. This sample size was chosen so that common findings have a reasonable number of positive examples in the dataset for training logistic regression. All sampled reports were included in subsequent analyses. Labeling for all findings was performed by a medical student and confirmed by a practicing, board-certified neuroradiologist. Each report was labeled across 49 finding categories (see the Online Supplemental Data for in-depth labeling information). Findings were then further grouped by disease classes, to concatenate report categories with shared language for automated labeling. Findings classes with at least 5% data frequency were kept for further analysis: edema, fracture, hemorrhage, herniation, hydrocephalus, infarct, mass effect, tumor, chronic white matter disease (abbreviated white matter), pneumocephalus, postsurgical status, and volume loss. This approach ensures that each subsequent finding model has at least 50 positive examples for training. Together, these 12 classes create a comprehensive set of common head CT findings that may summarize the examination reading priority for most patients.
Model Design and Training
The n-gram model is a technique for encoding text as a sequence of character or word symbols.24 Our modeling approach was to encode head CT reports into a vector of word n-gram counts (bag of n-grams) and to independently train a logistic regression classifier for each finding type. We chose n-grams because neuroradiologists often repeat concise phrases across reports with specific meaning regarding imaging findings (ie, no acute intracranial hemorrhage). N-grams are particularly sensitive to these phrases and are a simple-but-powerful encoding for summarizing document content. Simple models that combine n-grams and logistic regression classifiers have shown strong performance on radiology report labeling, comparable with the performance of deep learning or generative models.23,24 N-gram counts were not scaled by document length (to n-gram frequency) because the language used to describe abnormal findings is typically longer than the language used to describe normal findings and adjusting for document length may attenuate this signal. The entire report was used for training, including the impression, findings, and any described clinical history. No stop words were removed because common stop words (ie, “no,” “or,” “and”) are repeated in key phrases across reports and these phrases carry important diagnostic value. All reports were split into tokens of consecutive alphanumeric characters; then, the number of unigrams, bigrams, and trigrams was counted using the Natural Language Toolkit library.25
One logistic regression classifier was trained for each of the 12 common findings. Logistic regression classifiers were chosen because of their robust performance, ease of interpretability, straightforward training, and tolerance to class imbalance. Models were trained using a combination of unigrams, bigrams, and trigrams. It was found during training that increasing the gram length improved model performance, but this effect saturated once quadgrams were added. This step indicates that the additional feature space provided by quadgrams does not clearly improve linear separability, so n-grams of a higher order than trigrams were excluded. Training was performed using L2 regularization, which limits coefficient magnitude and model overinterpretation of any single n-gram. Hyperparameter tuning was performed iteratively by setting the L2 coefficient to unity and then adjusting by a factor of 10 until locally maximal performance was realized.
Three other classifier types were tested to compare performance with logistic regression: a support vector machine classifier (radial basis function kernel, regularization term = 1), a random forest classifier (100 trees, Gini impurity criterion), and a multilayer perceptron classifier (learning rate = 1e-4, L2 penalty = 1e-5, batch size = 100). It was found that smaller multilayer perceptron architectures performed better during iterative testing, and ultimately 3 layers of 32 neurons each were chosen. All models, including logistic regression, were trained using the package scikit-learn (https://scikit-learn.org/stable/index.html).26
Statistical Analysis
Model performance was estimated by averaging the model accuracy, sensitivity, specificity, area under the receiver operating characteristic curve (AUROC), and the area under the precision-recall curve (AUPRC) across 5-fold cross-validation. Reported performance statistics correspond to the point on the receiver operating characteristic curve that maximizes the Sørensen-Dice coefficient (F1 measure), defined as the harmonic mean of the positive predictive value and specificity. This calibration step ensures that the reported results are not heavily skewed toward the majority class. Given the heavy class imbalance in our dataset, the AUROC and AUPRC are the primary outcomes for assessing model performance in this study. Each model was compared with chance using the Fisher exact test for 2-way tables. Finally, we investigated the output probabilities of our models by iteratively removing points near the decision boundary and observing the change in error rate. Noisy labels are a barrier to training machine learning algorithms and could affect downstream models trained with a labeled dataset of head CT examinations. While training of machine learning algorithms is typically done with binary labels, training protocols that take into account class output probabilities are a possible solution to overcome the noisy labeling problem.27
RESULTS
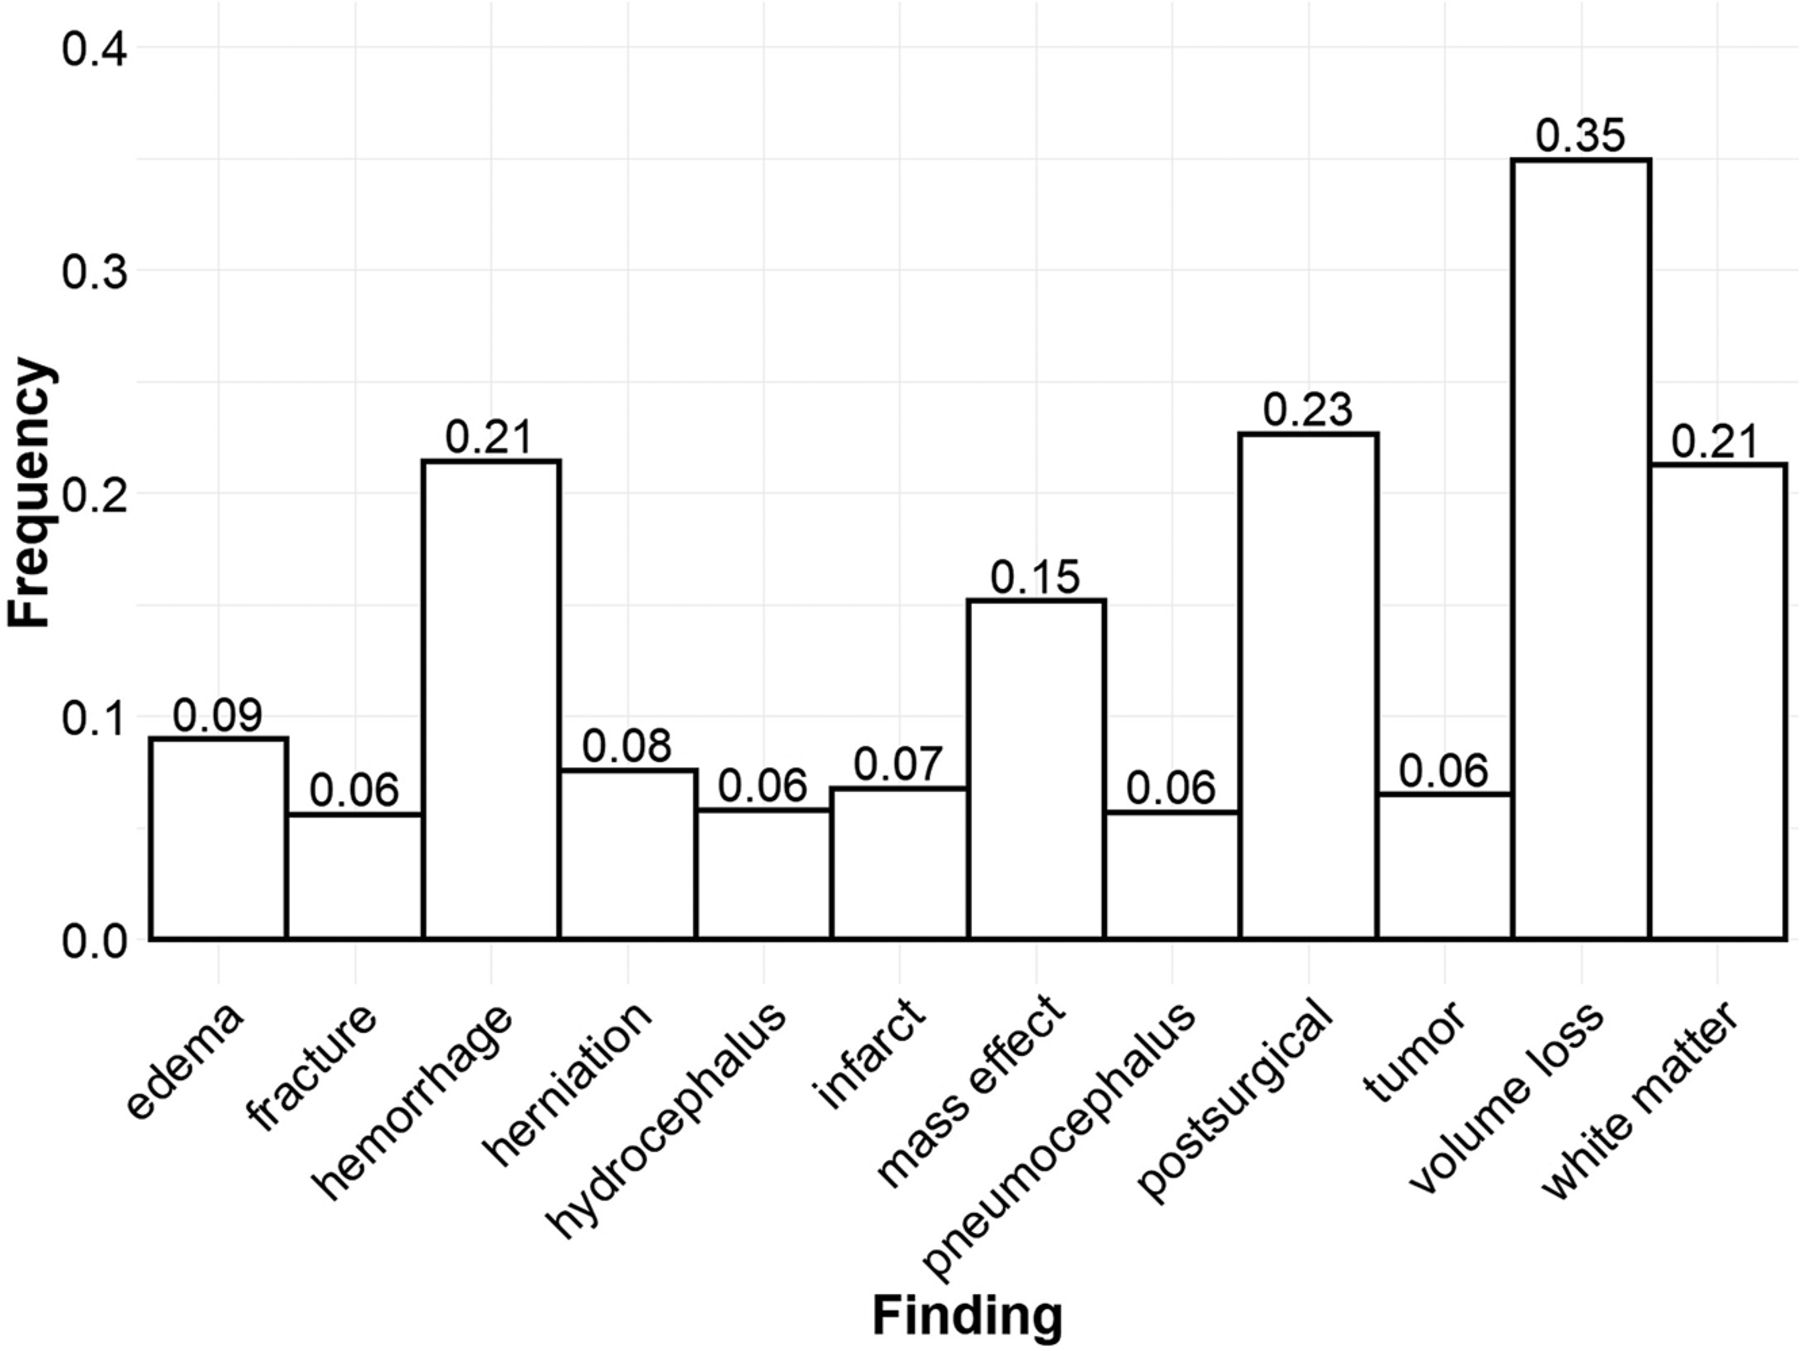
The frequencies of all 12 common findings are shown in Fig 1. Volume loss was the most frequent finding overall, described in just over one-third of all reports. The next most common findings were postsurgical status (23%), hemorrhage (21%), chronic white matter disease (21%), and mass effect (15%). The remaining findings were overall comparatively rare, occurring at a rate slightly above the inclusion threshold of 5% frequency for common findings. Expert labeling identified 223 reports with normal findings (22.3%) and 779 reports with at least 1 abnormality (77.7%). Reports with at least 1 abnormality described, on average, 2.44 of the 12 common findings. Furthermore, 97.8% of reports with abnormal findings described at least 1 of the 12 common findings.

Frequencies of common findings. Bar lengths and numeric labels represent the frequency of each individual common finding across the labeled radiology reports. Each report may describe multiple findings or no findings at all.
Model Performance
The performance for each model is shown in the Online Supplemental Data. On the basis of the AUROC, the models for hemorrhage and herniation performed best (AUROC > 0.97), closely followed by those for volume loss, postsurgical status, fracture, mass effect, and pneumocephalus (AUROC > 0.95). Receiver operating characteristic curves for each model are shown in the Online Supplemental Data. Models for detecting infarct and tumors were the weakest by all metrics. Sensitivity and specificity were relatively close for the hemorrhage and volume loss models. Otherwise, the model specificity was typically far higher than sensitivity. All models performed significantly better than chance.
Model Coefficients
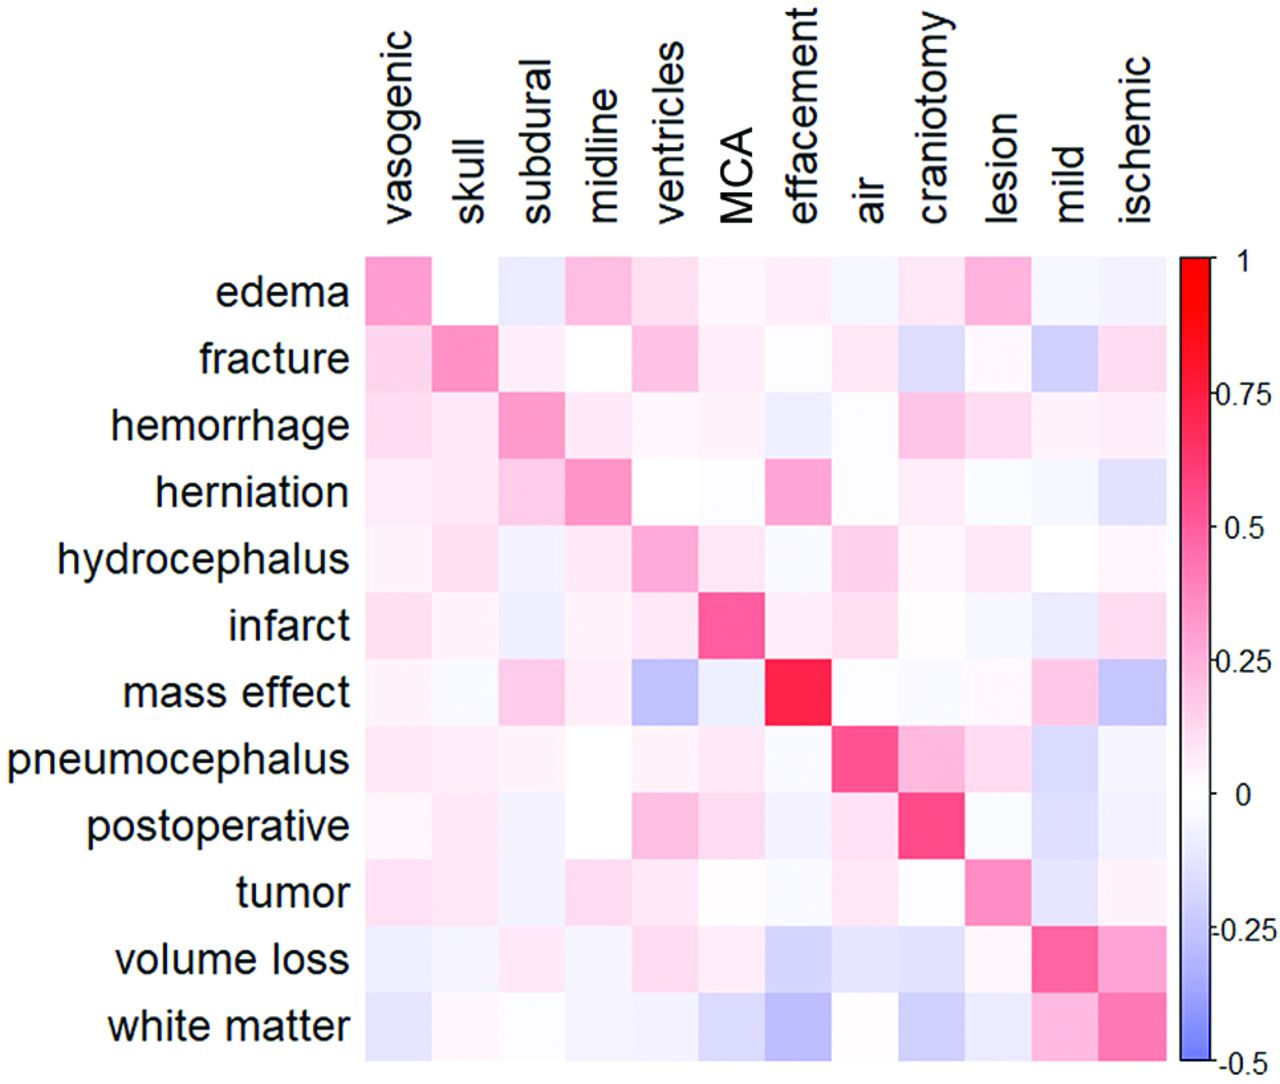
A heatmap of selected model coefficients is shown in Fig 2. All models had unigrams that closely related to the finding pathology or description within the top 5 coefficients. The largest coefficients of most models were either unigrams or combinations of those same unigrams. For example, the terms “edema,” “vasogenic,” and “vasogenic edema” were among the highest for the edema model. N-grams with the most negative coefficients were generally lower in magnitude than n-grams with the most positive coefficients and were typically nonspecific or negatory (ie, “no acute intracranial” was a strongly negative trigram for the hemorrhage model). Selected coefficients had a higher magnitude for their corresponding model than for other models (visible through the red diagonal line), suggesting that each model identified important n-grams that were unique to the specific finding.

Model coefficient heatmap. Normalized model coefficients corresponding to selected unigrams (horizontal axis labels) are shown for each model (vertical axis labels). Red values indicate a positive association between unigram frequency and the probability of the corresponding finding. One unigram was chosen from a list of 5 n-grams with the largest coefficients in each model. Coefficient labels are ordered by model of origin (“vasogenic” is the selected unigram for the edema model, “skull” is the selected unigram for the fracture model, and so forth). Preference was given to n-grams that were closely related to the finding of interest. N-grams that contained the finding word or words were not chosen for display, though these were typically the n-grams with the highest coefficients in each model. Coefficients were normalized by row and column averages for better comparison across models because coefficients are strongly affected by the n-gram frequency and model regularization terms.
Model Output Probabilities
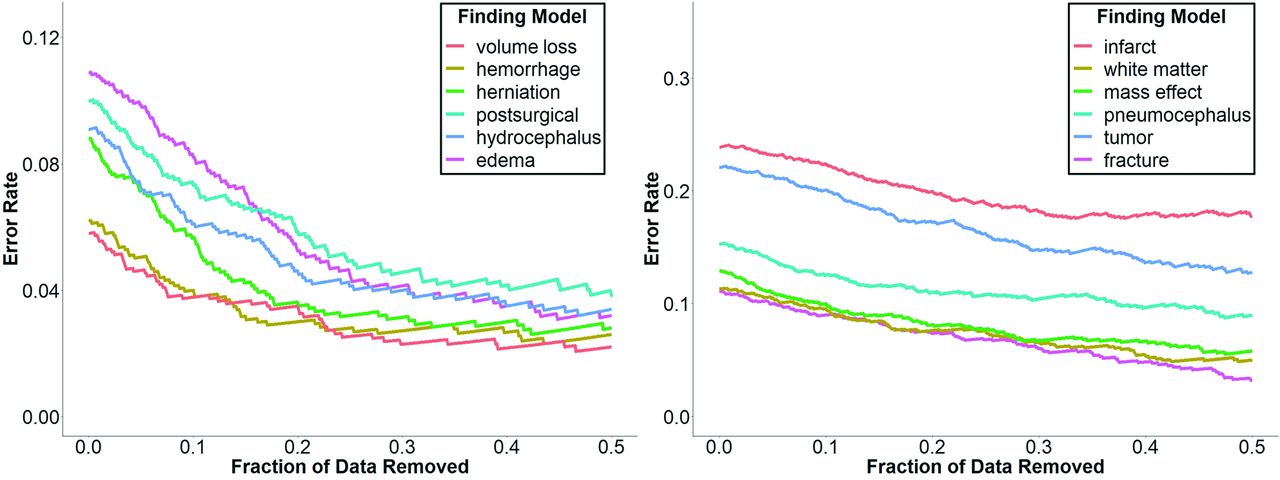
To better understand the validity of class output probabilities in our models, we iteratively removed data points closest to the decision boundary (ie, least certain predictions) and observed the change in the overall error rate (Fig 3). The error rate decreases for all models when uncertain predictions are removed, indicating that correct predictions are overall classified more confidently than incorrect ones. This effect is magnified for models with higher initial performance, in which the error rate tends to decrease approximately exponentially when data are removed, whereas the error rate of models with lower initial performance decreases linearly.

Visualizing model discrimination by filtering uncertain predictions. Changes in the error rate are shown for higher-performing models (left) and lower-performing models (right) when data near the decision boundary are removed. The error rate is calculated as 1 minus the model accuracy.
Classifier Comparison
The results shown above correspond to the performance of a logistic regression model. In addition, we tested the performance of support vector machines, random forests, and multilayer perceptrons for detecting findings in radiology reports. The average performance of each model across all findings is shown in the Table. See the Online Supplemental Data for the complete data. In aggregate, random forests models had the highest average AUROC and AUPRC, followed by logistic regression, support vector machines, and finally multilayer perceptrons. Logistic regression models were the most sensitive, with an average sensitivity of 0.748. However, the average performance for all models typically fell within 95% confidence bounds, except for the multilayer perceptron, which consistently underperformed the other models. On an individual finding level, logistic regression was best for hemorrhage, while random forests were best for edema, infarcts, and white matter disease.
| Model | LR | SVM | RF | MLP |
|---|---|---|---|---|
| AUROC | 0.936 (0.910–0.959) | 0.932 (0.907–0.954) | 0.950 (0.931–0.967) | 0.887 (0.848–0.922) |
| AUPRC | 0.695 (0.610–0.779) | 0.650 (0.565–0.740) | 0.710 (0.626–0.792) | 0.613 (0.525–0.704) |
| Sensitivity | 0.748 (0.662–0.831) | 0.679 (0.589–0.768) | 0.728 (0.641–0.812) | 0.660 (0.573–0.747) |
| Specificity | 0.950 (0.935–0.964) | 0.944 (0.929–0.959) | 0.955 (0.940–0.968) | 0.938 (0.921–0.952) |
| Accuracy | 0.932 (0.916–0.947) | 0.923 (0.906–0.938) | 0.936 (0.921–0.951) | 0.914 (0.896–0.930) |
Note:—LR indicates logistic regression; SVM, support vector machine; RF, random forest; MLP, multilayer perceptron.
↵a Average AUROC, AUPRC, sensitivity, specificity, and accuracy are shown for each model type across all findings. Numbers in parentheses are the range of values corresponding to the 95% confidence interval
Average model performance by classifier typea
DISCUSSION
We have presented a series of NLP models for labeling noncontrast head CT images using the corresponding radiology reports. The overall strong performance of our models suggests that the combination of n-grams and logistic regression is suitable for labeling common findings in head CT reports (Online Supplemental Data). Compared with other classifier types, logistic regression performed better than a support vector machine and a multilayer perceptron. Although random forests had higher average AUROC and AUPRC values, logistic regression significantly outperformed random forests on hemorrhage detection, which is a major application of this work. A combination of logistic regression and random forests may ultimately be a better approach.
When compared to models in a similar study by Zech et al,23 we developed strong models for identifying fractures (AUROC: 0.951 versus 0.816–0.930) and hemorrhage (AUROC: 0.981 versus 0.918–0.945). This prior work also reported a strong model for stroke, infarction, or ischemia, which outperformed our model for infarction alone (AUROC: 0.846 versus 0.926–0.964); however, the proportion of infarct cases within this larger combined group was not reported. This work differed in the technique for filtering stop words, as well as the choices of models and regularization penalty. Although some differences in model performance can be attributed to these methodologic differences, this attribution is difficult to infer without comparing on a shared test dataset.
While strong models were trained overall, the tumor and infarct models noticeably underperformed. Both findings have characteristics that would make them challenging to identify using our n-gram methodology. First, brain tumors are more variable in their location and underlying pathology than other findings. Reports in the tumor category were a mixture of parenchymal (20%), extra-axial (38%), osseous (22%), metastatic (16%), and orbital (4%) tumors. Because the language used to describe different types and locations of tumors is variable, it is even more challenging to collectively learn these subdivisions with a limited positive dataset (6% frequency of tumor findings).
Second, early brain infarcts can be challenging to detect on noncontrast head CT, even for experienced neuroradiologists.28 While the hyperdense vessel sign is a specific infarct finding, this finding is not always present, so infarcts are often diagnosed through a combination of effacement and subtle ischemic changes such as transcortical hypoattenuation (ie, loss of gray-white matter differentiation). N-grams are limited to counting adjacent word combinations and can struggle with making inferences on combinations of findings across a report document. Higher-complexity NLP models, which can analyze subtler findings, may be necessary for identifying infarcts in radiology reports.
We demonstrated the interpretability of our models through comparison of pathologically relevant coefficient magnitudes across models (Fig 2). This comparison suggests that the model is engaging with neuroradiologic terminology and is promising for generalization to other datasets. In addition, we investigated using class output probabilities as a measure of prediction confidence and found that in stronger models, removing predictions near the decision boundary can lower the error rate substantially (Fig 3). First, this finding implies that class output probabilities contain information regarding the prediction confidence. Second, it allows creating higher-accuracy labels by discarding uncertain data. Because there is a surplus of unlabeled data in report labeling, this approach may be practical for generating higher-quality datasets.
There were several limitations encountered while performing this study. First, creating a criterion standard dataset of labeled reports is incredibly laborious, lead to a limited sample size. As a result, we lacked statistical power to assess model performance on rarer but still important head CT findings. Concatenation of findings into 12 categories partially addressed this problem, but introducing finding heterogeneity into each category may have lowered the model performance. Second, all reports in this study originated from Northwestern Medicine medical centers. Report content and style may vary across radiologists, so additional work is needed to confirm model generalizability.
In addition to presenting models for labeling reports, we have developed a 12-dimensional framework for common head CT findings. Given the success of the already-tested head CT prioritization systems for acute intracranial hemorrhage, it may be possible to use a battery of labeling algorithms, such as those presented in this work, to develop head CT screening systems for a broader range of neuroradiologic findings.29 Initial attempts at creating algorithms that detect critical findings have demonstrated that this is a challenging problem (model accuracy = 0.55) and progress may be limited by dataset labeling (NLP labeling accuracy = 0.71).30 Increasing the number of labels may improve priority assessments by capturing interaction effects among findings. For example, a tumor that also presents with edema and mass effect is more severe than one that does not. Alternatively, the presence of pneumocephalus in a patient postsurgery is often expected, while an isolated pneumocephalus may have a more insidious cause and warrants higher priority.
CONCLUSIONS
Classifiers trained on n-grams demonstrated overall strong performance in detecting a broad range of neuroradiologic findings in head CT reports. Logistic regression demonstrated interpretability of model coefficients and class output probabilities. These algorithms can be used to generate large, labeled datasets of head CT examinations for training deep learning models to identify findings in images. Clinical implementation of these algorithms could support a prioritization system for reading head CT examinations and decrease the time to treatment for patients with emergent findings.
Footnotes
This work was funded by the fiscal year 2020 Dixon Translational Research Grants Initiative and the Northwestern Memorial Foundation.
Disclosure forms provided by the authors are available with the full text and PDF of this article at www.ajnr.org.
References
- Received December 9, 2021.
- Accepted after revision March 14, 2022.
- © 2022 by American Journal of Neuroradiology


Jump to section
Related Articles
Cited By...
- No citing articles found.