
Abstract
BACKGROUND AND PURPOSE: The hemodynamics associated with cerebral AVMs have a significant impact on their clinical presentation. This study aimed to evaluate the hemodynamic features of AVMs using 3D phase-contrast MR imaging with dual velocity-encodings.
MATERIALS AND METHODS: Thirty-two patients with supratentorial AVMs who had not received any previous treatment and had undergone 3D phase-contrast MR imaging were included in this study. The nidus diameter and volume were measured for classification of AVMs (small, medium, or large). Flow parameters measured included apparent AVM inflow, AVM inflow index, apparent AVM outflow, AVM outflow index, and the apparent AVM inflow-to-outflow ratio. Correlation coefficients between the nidus volume and each flow were calculated. The flow parameters between small and other AVMs as well as between nonhemorrhagic and hemorrhagic AVMs were compared.
RESULTS: Patients were divided into hemorrhagic (n = 8) and nonhemorrhagic (n = 24) groups. The correlation coefficient between the nidus volume and the apparent AVM inflow and outflow was .83. The apparent AVM inflow and outflow in small AVMs were significantly smaller than in medium AVMs (P < .001 for both groups). The apparent AVM inflow-to-outflow ratio was significantly larger in the hemorrhagic AVMs than in the nonhemorrhagic AVMs (P = .02).
CONCLUSIONS: The apparent AVM inflow-to-outflow ratio was the only significant parameter that differed between nonhemorrhagic and hemorrhagic AVMs, suggesting that a poor drainage system may increase AVM pressure, potentially causing cerebral hemorrhage.
ABBREVIATIONS:
- FDNG
- flow distribution network graph
- PCMR
- phase-contrast MR imaging
- VENC
- velocity-encoding
Patients with cerebral AVMs are at an increased risk of cerebral hemorrhage, with the incidence of hemorrhage in these patients being approximately 2%–4% annually, depending on several clinical and angioarchitectural features.1,2 Moreover, the hemodynamic changes associated with AVMs are also thought to contribute to their pathophysiology and clinical presentations.3 So far, various modalities such as direct blood pressure measurement,4⇓-6 transcranial Doppler,5,7 DSA,8⇓⇓-11 and hemodynamic MR imaging12⇓⇓⇓⇓-17 have been used to investigate the hemodynamic features of AVMs. In particular, several studies have suggested that an inadequate development of the drainage system or hemodynamic imbalance in the AVMs might lead to high blood pressure in the nidus, potentially causing cerebral hemorrhage.4⇓-6,8,9,11,16,17 Therefore, measuring the total AVM inflow and outflow may be important to estimate how much pressure exists in the AVMs and to evaluate the risk of cerebral hemorrhage, but evidence is scarce.
Phase-contrast MR imaging (PCMR) is a type of hemodynamic MR imaging that uses a bipolar gradient to create a phase shift of blood flow proportional to its velocity. PCMR allows the noninvasive measurement of flow parameters, such as flow velocity and flow rate, even in highly complex vessels such as AVMs.18 Currently, electrocardiogram-gated 4D-flow MR imaging is the most commonly used MR imaging technique for hemodynamic analysis of intracranial vascular diseases. However, 4D-flow MR imaging requires a relatively long scan time, which impedes the implementation of this scan in routine clinical practice. Furthermore, 4D-flow MR imaging with both high spatial resolution and dual velocity-encodings (VENCs), which are desirable for intracranial vessel flow study,19⇓-21 is impractical in the clinical setting because these parameters further increase scan time. Therefore, non-electrocardiogram-gated 3D PCMR, which requires less scan time than 4D-flow MR imaging, could be an alternative tool for analysis.
The aim of this retrospective study was to try to quantify the AVM inflow and outflow using 3D PCMR with dual VENC and to elucidate whether the hemodynamic imbalance between the AVM inflow and outflow was associated with cerebral hemorrhage in patients with AVMs.
MATERIALS AND METHODS
Patient Population
This retrospective study was approved by the Ethical Review Committee of the University of Tokyo (IRB No. 12057). At the time of initial treatment, written informed consent was obtained from all patients for future use of their clinical data for research purposes.
Between March 2016 and November 2020, sixty-seven patients with supratentorial AVMs who had previously received no treatment underwent 3D PCMR at our institution. Most patients in this cohort were referred to our hospital for gamma knife surgery, except for a few cases of direct surgery. During this period, 35 patients were excluded because of insufficient MR imaging data because the circle of Willis was not covered (n = 23). In addition, patients with a faint nidus with extremely low-flow draining veins that could not be evaluated (n = 4) and those with involvement of perforating feeder vessels from A1, M1, and P1 segments (n = 3); occlusion of the MCA (n = 2); feeding arteries arising from bilateral sides (n = 2); and multiple nidi (n = 1) were also excluded because of the difficulty in maintaining an apparent AVM inflow.
For analysis, 32 patients were included in the study and were divided into 2 groups: nonhemorrhagic (n = 24) and hemorrhagic (n = 8). The nidus diameter and volume in each AVM were measured using the gamma knife planning software, Leksell GammaPlan (Elekta), for classification into small (<30 mm), medium (30–60 mm), or large (>60 mm) AVMs, depending on the diameter.22 The mean duration between the gamma knife surgery and the onset of hemorrhage was 62 days (median, 68 days; range, 24–91 days). All patients had undergone DSA before gamma knife treatment. The patients in the hemorrhagic group, with the exception of 3 patients, had also undergone DSA during the acute phase of cerebral hemorrhage (<3 weeks). The interval time from the onset to the imaging in the hemorrhage group was 43 days (range, 6–87 days; median, 36 days), except in 2 patients for whom the interval was unknown. These 2 patients had obvious findings of old hemorrhage on MR imaging in accordance with the location of the nidus. Their estimated interval time from onset to imaging was at least 6 months, because the duration between the date when the patients were found to have AVMs and the imaging date was longer than 6 months.
MR Imaging Protocol and Definition of Flow Parameters
3D PCMR was performed with a 3T scanner (Magnetom Skyra; Siemens) without a contrast agent, using a 20-channel head array coil. The imaging parameters for the 3D PCMR were TR/TE, 37.7/5.46 ms; number of excitations, 2 (until July 2019) and 1 (since August 2019); flip angle, 10°; generalized autocalibrating partially parallel acquisition factor, 3; FOV, 199 × 220 mm; matrix, 348 × 384; voxel size, 0.57 × 0.57 × 1 mm; slices, 64 (until July 2019) and 128 (since August 2019); and bandwidth, 365 Hz/pixel. The scan matrix was 174 × 194, and zero-filling and low-pass filter were applied for the reconstruction of the matrix. The purpose of the reconstruction was to keep the signal-to-noise ratio as high as possible at a high resolution. The image data were corrected for Maxwell terms in online reconstruction. We set 2 different VENCs, 50 and 100 cm/s, in 3 directions (anterior-posterior, right-left, and superior-inferior) in all cases. The total scan time was approximately 15 min.
We measured the apparent AVM inflow, AVM inflow index, apparent AVM outflow, AVM outflow index, and the apparent AVM inflow-to-outflow ratio as an indicator of divergence between apparent AVM inflow and outflow. The apparent AVM inflow was calculated using the following formula:14,16,17
(Ipsilateral A2 Segment + M1 Segment + P2 Segment),
(Contralateral A2 Segment + M1 Segment + P2 Segment).
If feeding perforators from the ICA existed, these flow rates were re-added. The apparent AVM outflow was defined as the total flow rate of each draining vein in the nidus. The AVM inflow and outflow indices were calculated by the following formula:16
AVM Inflow Index = Apparent AVM Inflow (mL/min) /Nidus Volume (mL),
AVM Outflow Index = Apparent AVM Outflow (mL/min)/Nidus Volume (mL).
Image Processing and Flow Analysis
First, all phase and magnitude data from the 3D PCMR were transferred to commercially available image-processing software, Amira (Thermo Fisher Scientific). A 3D surface-rendering using the magnitude images was created with the software to visualize the general vasculature of the AVM and identify every draining vein (Fig 1). We also referred to DSA to confirm the number and approximate location of the draining veins, which allowed easy identification of the draining veins in the PCMR. If there was velocity aliasing on the phase images from the 100 -cm/s VENC, a correction for velocity aliasing was performed as follows:

A representative case (No. 22) from the hemorrhagic group. A, 3D PCMR with streamline visualization using Amira shows vessel flow rates at A2, M1, P2 and the nidus in the right temporal lobe. B and C, A 3D surface-rendering model with texture processing shows the cortical artery including feeding arteries (red), the draining veins (blue), and the nidus (dark red). The 4 asterisks on the draining veins indicate the measurement points of cerebral AVM outflow in this case. D, 3D PCMR with streamline visualization from the same angle as in B and C shows vessel flow rates at the draining veins. The asterisks in D correspond to those in B and C.
If Va is the velocity at a voxel that shows the velocity aliasing and Vc is the corrected velocity at the voxel, the velocity aliasing was corrected as follows:23
Vc = 2 × VENC – |Va|.
All procedures were performed by the first author, who is a board-certified neurosurgeon with 10 years of experience.
Second, the processed data were transferred to flow-analysis software, IV-FLOW (Maxnet). IV-FLOW automatically displays the centerline of the vessel and allows users to measure the vessel flow rate at any point by setting the perpendicular plane on this line. The segmentation and flow measurement of A2, M1, and P2 were conducted by the 100-cm/s VENC data. Meanwhile, the segmentation of draining veins was conducted by the 50-cm/s VENC data. The flow measurement of draining veins was conducted by the 100 cm/s VENC data simultaneously with the flow measurement of A2, M1, and P2. The measurement points of draining veins were adjacent to the nidus (Fig 1).
Statistical Analysis
All statistical analyses were conducted using JMP15 (SAS Institute Inc). To verify the credibility of the apparent AVM inflow and outflow, we calculated the Pearson correlation coefficient scores between the nidus volume and each flow rate in the whole cohort. Next, the 5 flow parameters, including 2 flow rates, 2 flow indices, and the apparent AVM inflow-to-outflow ratio were compared between the small and medium AVMs and between the nonhemorrhagic and hemorrhagic AVMs using the Wilcoxon rank sum test. Moreover, a multivariate regression model was used to determine whether hemodynamics had an independent effect on the presentation of hemorrhage. The model included the risk factors for cerebral hemorrhage, associated arterial aneurysms, exclusively deep venous drainage, nidus volume, and apparent AVM inflow-to-outflow ratio. The Pearson correlation coefficient scores between the nidus volume and the apparent AVM inflow-to-outflow ratio was also calculated. A P value < .05 was considered significant.
RESULTS
There were 17 cases (71%) of small AVMs in the nonhemorrhage group and 6 cases (75%) in the hemorrhage group, whereas there were no cases of large AVMs in the entire cohort. Spetzler-Martin grades were I–IV in each cohort.22 There were no significant differences in patient demographics and AVM characteristics, except for the associated arterial aneurysm (Table 1).
Comparison of patient demographics and angioarchitectural features between nonhemorrhage and hemorrhage groups
The correlation coefficient between the nidus volume and the apparent AVM inflow as well as outflow was 0.83 (Fig 2). The apparent AVM inflow and outflow were significantly smaller in the small AVMs compared with the medium AVMs (P < .001, respectively) (Fig 3). The details of the flow according to AVM size are summarized in Table 2. The apparent AVM inflow and outflow between nonhemorrhagic and hemorrhagic AVMs were not significantly different (P = .95 and .40, respectively) (Fig 4). The AVM inflow index was higher and the AVM outflow index was lower in the hemorrhagic than in the nonhemorrhagic AVMs, but the difference was not significant (P = .09 and .47, respectively) (Fig 4). The apparent AVM inflow-to-outflow ratio was significantly larger in the hemorrhagic AVMs than in the nonhemorrhage AVMs (P = .02) (Fig 4). A comparison of the above-mentioned flow parameters is summarized in Table 3. The multivariate regression model demonstrated that the associated arterial aneurysm and the apparent AVM inflow-to-outflow ratio were significant factors (P = .02 for both), while the exclusively deep venous drainage and the nidus volume were not significant (P = .51 and 0.72, respectively). The Pearson correlation coefficient score between the nidus volume and the apparent AVM inflow-to-outflow ratio was −0.26.

Correlations between nidus volume and each flow rate, apparent cerebral arteriovenous malformation inflow, and outflow. The scatterplot between the nidus volume and each flow, apparent AVM inflow (A), and outflow (B) shows high correlation (correlation coefficient scores = 0.83 for both flows).

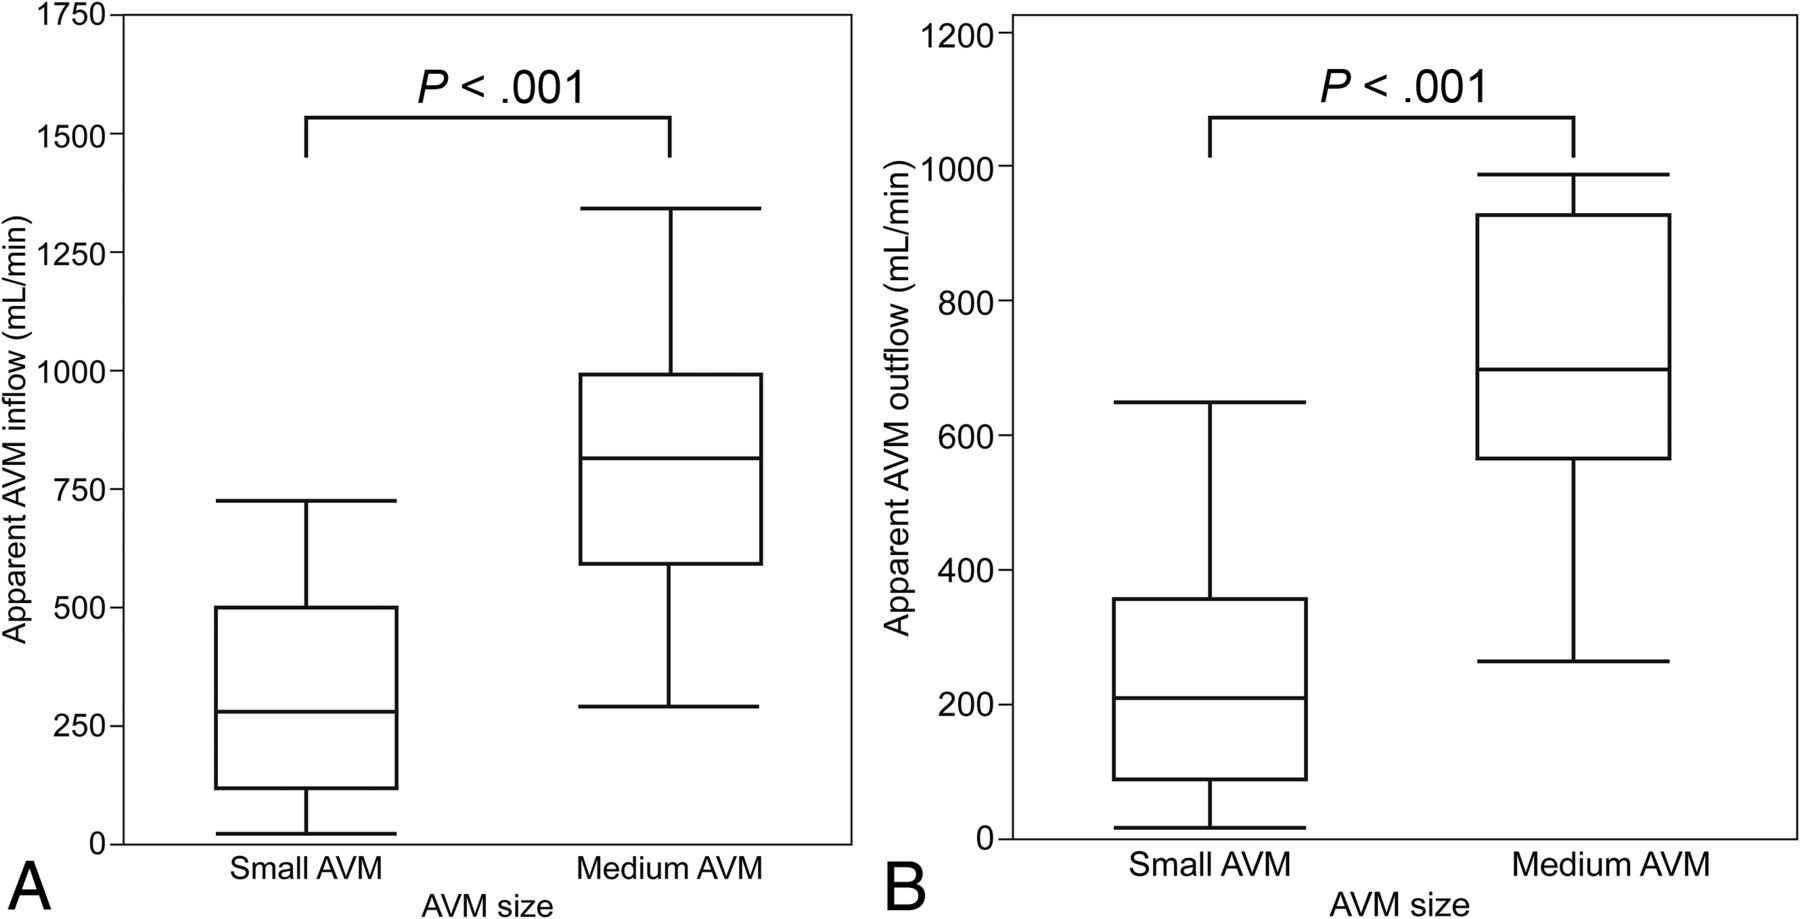
Boxplots comparing cerebral AVM inflow and outflow between small and medium AVMs. The apparent AVM inflow (A) and outflow (B) in small AVMs are significantly smaller between nonhemorrhagic and hemorrhagic AVMs compared with medium AVMs using the Wilcoxon rank sum test (P < . 001, for both groups).

Boxplots comparing apparent cerebral AVM inflow and outflow (A and B), AVM inflow and outflow indices (C and D), and the cerebral AVM inflow-to-outflow ratio (E) between nonhemorrhagic and hemorrhagic AVMs. E, The apparent AVM inflow-to-outflow ratio is significantly larger in hemorrhagic AVMs than in nonhemorrhagic AVMs (P = . 02), according to the Wilcoxon rank sum test.
Comparison of flow parameters between small and medium AVMs
Comparison of flow parameters between nonhemorrhage and hemorrhage groups
Other Hemodynamic Parameters
In the hemorrhage group, rupture of the associated arterial aneurysm was the cause of hemorrhage in 3 patients, and the mean apparent AVM inflow-to-outflow ratio of these patients was 1.26. It was <2.44 in the remaining 5 patients with rupture of the nidus. The apparent AVM inflow-to-outflow ratio was significantly larger in the 5 patients with rupture of the nidus than in the nonhemorrhage group (P = .005). The mean apparent AVM inflow and nidus volume in the whole cohort were 441 mL/min and 5.4 mL, respectively. The mean blood flow rate of the MCA on the opposite side of the AVM in patients older than 20 years of age was 158 mL/min. The mean cerebral blood flow rate (A2 segment + M1 segment + P2 segment) on the opposite side of the AVM in the whole cohort was 317 mL/min, and 291 mL/min in patients older than 20 years of age (Table 4).
Mean blood flow of the middle cerebral artery and cerebral blood flow
DISCUSSION
Several hemodynamic studies have been conducted to elucidate the pathophysiology of AVMs. One of the strengths of our study is the elucidation of the association between the hemodynamic status of AVMs and hemorrhagic presentation based on the AVM size. As expected, larger AVMs had a higher apparent inflow and outflow. In contrast, the apparent AVM inflow and outflow showed no significant difference between the nonhemorrhagic and hemorrhagic groups in our cohort without size bias. Incidentally, whether hemorrhagic AVMs have an increased or decreased inflow compared with nonhemorrhagic AVMs is a controversial topic.4⇓-6,9⇓-11,13,16,17,24⇓-26 One of the reasons for this disagreement is likely derived from size bias, because several previous hemodynamic studies comprised hemorrhage cohorts with mostly small AVMs, while their nonhemorrhage cohorts mostly comprised medium or large AVMs.4⇓-6,16,25 These results do not correlate with ours.
The AVM inflow index in the hemorrhagic group was larger than that in the nonhemorrhagic group, though the difference was not statistically significant. The AVM outflow index showed no significant difference between the 2 groups. These results imply that the AVM inflow in hemorrhagic AVMs might increase to a greater extent than expected for its size, but the AVM outflow might increase proportional to its size. Moreover, the apparent AVM inflow-to-outflow ratio was significantly larger in the hemorrhagic group compared with the nonhemorrhagic group. The apparent AVM inflow-to-outflow ratio is a newly defined indicator and signifies that the higher the apparent AVM inflow-to-outflow ratio is, the larger the hemodynamic imbalance in the AVM will be. Our results of the apparent AVM inflow-to-outflow ratio are comparable with those in previous hemodynamic studies using other modalities such as DSA. Todaka et al9 reported that the mean transit time ratio of draining vein to feeding artery on DSA was significantly larger in hemorrhagic-versus-nonhemorrhagic AVMs. Likewise, Lin et al26 demonstrated that a higher stasis index of the most dominant drainage vein was associated with hemorrhage of AVMs. They commonly inferred that the imbalanced hemodynamics in AVMs caused venous congestion, resulting in rupture of the AVMs. Our results support their conclusion, and we also infer that quantitative analysis of both the AVM inflow and outflow may be required for risk measurement of AVM rupture.
Confounding factors for cerebral hemorrhage may exist in the current study. There were concerns that the nidus volume could be a confounding factor because the apparent AVM inflow and outflow showed a very high correlation with the nidus volume. Therefore, the multivariate regression model was used to determine whether hemodynamics had an independent effect on the presentation of hemorrhage. As a result, the multivariate regression model demonstrated that the associated arterial aneurysm and the apparent AVM inflow-to-outflow ratio were significant risk factors for cerebral hemorrhage. The correlation between nidus volume and the apparent AVM inflow-to-outflow ratio was weak. However, consideration should be given to the small cohort used for multivariate regression modeling, which may result in an unstable model.
To the best of our knowledge, this is the first study to focus on the measurement of the total AVM inflow and outflow using a non-electrocardiogram-gated 3D PCMR with dual VENC. Electrocardiogram-gated 2D PCMR and electrocardiogram-gated 4D-flow MR imaging have been the mainstream modalities for the hemodynamic study of AVMs. However, 2D PCMR is not suitable for the identification of draining veins because of the lack of 3D volume data. 4D-flow MR imaging can be used for the identification of draining veins, but drawbacks include relatively low spatial resolution and long scan times. Meanwhile, 3D PCMR can offer 3D volume data with high spatial resolution and a reasonable scan time. Recently, Rijnberg et al27 reported on hemodynamic evaluation of the Fontan pathway using 2D-, 3D-, and 4D-flow MR imaging and demonstrated that 3D PCMR could obtain time-averaged flow rates with good-to-excellent agreement with 2D and 4D-flow, but with a 10-fold reduction in scan time. 3D PCMR also significantly improved image quality compared with 4D-flow MR imaging. In the current study, we used 3D PCMR with a high spatial resolution (0.57 × 0.57 × 1 mm) for hemodynamic evaluation of AVMs, and the apparent AVM inflow and outflow had a very high correlation with the nidus volume. This result seems to be reasonable from a clinical perspective and suggests that 3D PCMR with high spatial resolution may be a good application for cerebral vascular hemodynamic studies involving small vessels for improving the image quality.
Our work also benefited from the low VENC data regarding the segmentation of the draining veins. Schnell et al28 demonstrated that the low VENC and dual VENC data showed less noise, fewer artifacts, and a superior vessel depiction than the high VENC data with not much difference in vessel depiction of the venous system between the low and dual VENC data. Therefore, we used the low VENC data instead of the high VENC data in the segmentation of the draining veins. On the other hand, Schnell et al also demonstrated that the Bland-Altman analysis of high-versus-dual VENC confirmed the underestimation of the net flow of the high VENC acquisition. However, the error was not large in absolute value. In our preliminary survey, the differences in flow values of the draining veins between the 50- and 100- cm/s VENC data were also trivial. Therefore, the high VENC data were adopted for flow quantification of draining veins instead of the low VENC data to improve the efficiency of the workflow.
However, the MR imaging protocols in the current study were not state-of-the-art. 3D PCMR was acquired with the generalized autocalibrating partially parallel acquisition acceleration factor of 3,29 and 2 VENCs were acquired with 2 back-to-back scans. In contrast, there have been emerging research sequences for decreasing the scan time without major drawbacks. For example, 4D-flow MR imaging with non-Cartesian sampling, such as radial acquisitions, can be acquired with an isotropic spatial resolution of 0.7 mm in about 7 minutes covering the whole head.30 Additionally, using a total of 7 encodings instead of 8 for dual-VENC acquisitions allows a reduction in scan time in a elegant way with no apparent drawbacks.28,31
Furthermore, there are still more interesting methods with a 4D-flow MR imaging. Aristova et al19 showed the feasibility of flow distribution network graph (FDNG) analysis by quantifying and comparing flow, peak velocity, and the pulsatility index between healthy controls and patients with AVMs. In performing the flow analysis of complex neurovascular lesions, FDNG could be a more robust approach than conventional approaches such as ours because FDNG can reconstruct the flow distribution by simply using graph theory. In addition, the flow-conservation rule can be used as a metric of internal validation in the absence of ground truth with FDNG. When we considered these remarkable developments in AVM evaluation with 4D-flow MR imaging, if the aim of the flow analysis is to focus on the quantification of time-averaged parameters such as time-averaged flow rate, the combination of time-averaged 3D PCMR with the accelerated techniques and FDNG would provide dependable results.
There should be no difference between the “true” AVM inflow and outflow. However, in this study, a difference was observed between the “apparent” AVM inflow and outflow. Furthermore, the apparent AVM inflow-to-outflow ratio was significantly larger in the hemorrhagic AVMs than in the nonhemorrhagic AVMs. The method of measuring apparent AVM inflow and outflow in the current study has the possibility of overestimating AVM inflow and underestimating AVM outflow. Ideally, AVM inflow is calculated by totaling the flow rate of every single feeding pedicle to the AVM nidus, instead of calculating the difference between the ipsilateral and contralateral cerebral blood flow rates. However, this method is unfeasible because of the difficulty in identifying every feeding pedicle in 3D PCMR and it being a time-consuming procedure. Concerning AVM outflow, although 3D PCMR with the lower VENC allowed us to measure the draining veins with low flow rates, there is still the possibility of underestimation because not all sources of venous drainage may have been identified. Even if these limitations are taken into consideration, our results of the apparent AVM inflow-to-outflow ratio being larger in the hemorrhagic AVMs than in the nonhemorrhagic AVMs are of interest. There is a possibility that the underestimation of AVM outflow in the hemorrhagic group may be increased because of the increase in the flow rate in small draining veins adjacent to the AVM nidus. Sato et al32 demonstrated in their pathologic study that a perinidal dilated capillary network was connected not only to the nidus, feeding arteries, and draining veins via arterioles and venules but also to normal capillaries, arterioles, and venules. The perinidal dilated capillary network plays an important role in a compensatory mechanism for increased pressure in ruptured AVMs. However, this could not be well-captured in PCMR and might contribute to the underestimation of AVM outflow because the network drains blood from the AVM nidus directly before the measurement points of draining veins. Therefore, the apparent AVM inflow-to-outflow ratio may be an indicator of how much pressure exists in AVMs.
Notably, the apparent AVM inflow in the current study was higher than that in previous studies.16,17 The mean apparent AVM inflow (441 mL/min) in the whole cohort was higher than (316 mL/min) in the previous study by Shakur et al,16 and the mean nidus volume (5.4 mL) in the current study was equal to that (5.4 mL) of the same previous study. Our exclusion criteria for AVMs fed by the perforating artery might be related to this inconsistency regarding apparent AVM inflow. The perforating feeding artery arising from the A1, M1, and P1 segments disturbs the accuracy of apparent AVM inflow, contributing to the smaller apparent AVM inflow. On the other hand, the mean cerebral and middle cerebral artery blood flow rates on the opposite side of the AVM in patients older than 20 years of age were 291 and 158 mL/min, respectively. These flow rates were equivalent to those reported in previous surveys of cerebral blood flow in healthy adults using a 2D PCMR.33,34
Limitations
There were several limitations to this study. First, there was a relatively large selection bias among the patients in the study. Although we started to perform 3D PCMR on patients with AVMs in our institution, the FOV of MR imaging was confined to only 64 mm along the Z-axis with the intention of focusing on the nidus alone. Therefore, we had to exclude 23 patients at an early stage due to insufficient MR imaging data due to the circle of Willis not being covered because the flow rates at A2, M1, and P2 were needed for calculating AVM inflow. Second, we could not determine whether the difference in the apparent AVM inflow-to-outflow ratio between the nonhemorrhagic and hemorrhagic AVMs is the cause or the result of cerebral hemorrhage due to the retrospective design of our study. A prospective hemodynamic study would provide the answer to this question, but it may lack feasibility because of the low prevalence of AVMs and the low incidence of cerebral hemorrhage in patients with AVMs.
Third, the optimal approach for quantifying AVM inflow volume is to sum up the flow volumes of all the feeding pedicles to the AVM nidus. At first, we tried to quantify the AVM inflow volume using this method. However, it was practically unfeasible for multiple technical reasons. One reason was that the feeding pedicles were winding in most patients, making reproducible flow measurements difficult due to a slight difference in the measurement points in the winding vessels, which led to a large difference in the flow volume. The other reasons were that false recognition of the feeding pedicles could occur because AVMs have very complex structures and the number of feeding pedicles to the AVMs often exceeded 10, which can result in flow analysis taking several hours in each case.
Fourth, 3 patients with associated arterial aneurysms in the hemorrhage group showed a lower apparent AVM inflow-to-outflow ratio than the remaining 5 patients with rupture of the nidus. These results might be because the etiology of the rupture was different between the rupture of the associated arterial aneurysm and the AVM nidus. However, our study had a relatively small sample size, which did not allow us to draw strong conclusions. Fifth, we reported hemodynamic evaluation of AVMs using a non-electrocardiogram-gated 3D PCMR, which is less commonly used than the 2D- or 4D-flow MR imaging. The high correlation between the nidus volume and the apparent AVM inflow and outflow in the current study seems to be reasonable from a clinical perspective. Also, the mean cerebral and middle cerebral blood flow rates on the opposite side of the AVM in patients older than 20 years of age in the current study were compatible with those in previous studies.33,34 Therefore, we believe that the 3D PCMR could be an alternative option for blood flow analysis of AVMs. However, comparative investigation of 3D and other phase-contrast MR imaging is warranted.
Finally, correction of P values for multiple comparisons might have been ideal because 5 parameters were tested in the current study. However, it remains controversial whether the strict correction of the P value is necessary in exploratory studies such as the present study.35,36 The strict correction of P values for multiple comparisons was not performed in this study to prevent false-negative results. Our results, particularly the significance of the apparent AVM inflow-to-outflow ratio, need further validation.
CONCLUSIONS
The apparent AVM inflow and outflow seem irrelevant to the presentation of cerebral hemorrhage in patients with AVM. The apparent AVM inflow-to-outflow ratio is the only significantly differing parameter between nonhemorrhagic and hemorrhagic AVMs, suggesting that a poorly developed drainage system may increase AVM pressure, potentially causing cerebral hemorrhage.
Footnotes
Dr Kin received grant support from the Japan Society for the Promotion of Science KAKENHI (grant No. JP18K08938) and the Japan Science and Technology Agency CREST (JPMJCR17A1).
Indicates open access to non-subscribers at www.ajnr.org
References
- Received April 20, 2021.
- Accepted after revision July 28, 2021.
- © 2021 by American Journal of Neuroradiology


Jump to section
Related Articles
Cited By...
- No citing articles found.