
Abstract
BACKGROUND AND PURPOSE: Whether CTP is performed before or after CTA varies within multimodal CT stroke protocols. CTA after CTP might show venous filling, and CTP metrics might be disturbed by prior CTA. Therefore, we compared CTP metrics conducted before and after CTA in a large cohort of patients with stroke and analyzed interferences of the CTA bolus with the CTP measurement.
MATERIALS AND METHODS: We analyzed 1980 patients (368 patients with CTP performed before CTA [group A] versus 1612 patients with CTP performed after [group B]) in a retrospective study. Mean curves, histograms of CTP baseline Hounsfield units, CBF, CBV, time-to-maximum, hypoperfusion, and core volumes were calculated using the software VEOcore. CTA and CTP interferences were analyzed, and a detection and correction method was proposed.
RESULTS: Mean CTP baseline values were significantly different in both groups (41 versus 45 HU within the groups A and B, respectively). However, perfusion metrics, hypoperfusion, and core volumes yielded no significant differences. In 49 patients, the descending flank of the CTA bolus interfered with the baseline of the CTP measurement, leading to erroneously low CBV values. These errors vanished when a correction method was applied.
CONCLUSIONS: CTP can be reliably performed after CTA without a relevant net effect on perfusion metrics. However, when measuring CTP after CTA, either a short pause on the order of 30 seconds should be observed or an appropriate correction method should be applied. It may help to avoid excluding patients from mechanical thrombectomy by overestimating infarct cores.
ABBREVIATION:
- Tmax
- time-to-maximum
Multimodal CT stroke imaging protocols comprise NCCT followed by CTA and, at least beyond the 6-hour window, CTP.1⇓⇓-4 Technically, CTP can be performed either before or after CTA. When CTP is performed first, processing or postprocessing delays, CTA acquisition, and CTA image quality might be disturbed by venous contrast.5,6 When CTA is performed first, CTP time density curves may be altered.7
From a theoretic point of view, CTA before CTP should not alter the perfusion metrics as long as a sufficiently long time has passed between the measurements and the CTA bolus has completely dissolved to a well-mixed and constant state in the vascular system, because constant enhancement cancels out during perfusion calculation, as described below.
To optimize our multimodal CT stroke protocol, we compared CTP before CTA and vice versa and performed a systematic comparison in a large collection of 1980 patients. We analyzed perfusion metrics of CTP performed either before or after CTA and bolus interferences between CTA and CTP. We finally proposed a correction algorithm for cases in which an overlap of the descending CTA bolus with the CTP acquisition (CTA flank effect) had relevant influence on perfusion metrics.
MATERIALS AND METHODS
Patient Cohort
In a retrospective analysis, a PACS query was conducted for patients having undergone both CTA and CTP within the same examination between January 2017 and October 2020. For data management and image processing, all images were exported and anonymized to a local instance of the imaging platform Nora (www.nora-imaging.org). Information on patients’ biologic sex, age, study date, and time interval between CTA and CTP were extracted from the DICOM headers. On the basis of the timing information, cases were assigned to the groups with CTP conducted before (group A) and after CTA (group B). The study was approved by the local ethics committee, and informed written consent was waived.
Quality Control and Visual Rating
All raw perfusion series and processed results as described below were checked by 2 neuroradiologists (T.D. and A.R.) to identify cases with obvious technical issues (severe motion, erroneous contrast agent injection, and so forth). Furthermore, the presence of interferences between time-density curves of CTA and CTP as illustrated in Fig 1 was assessed during this process.

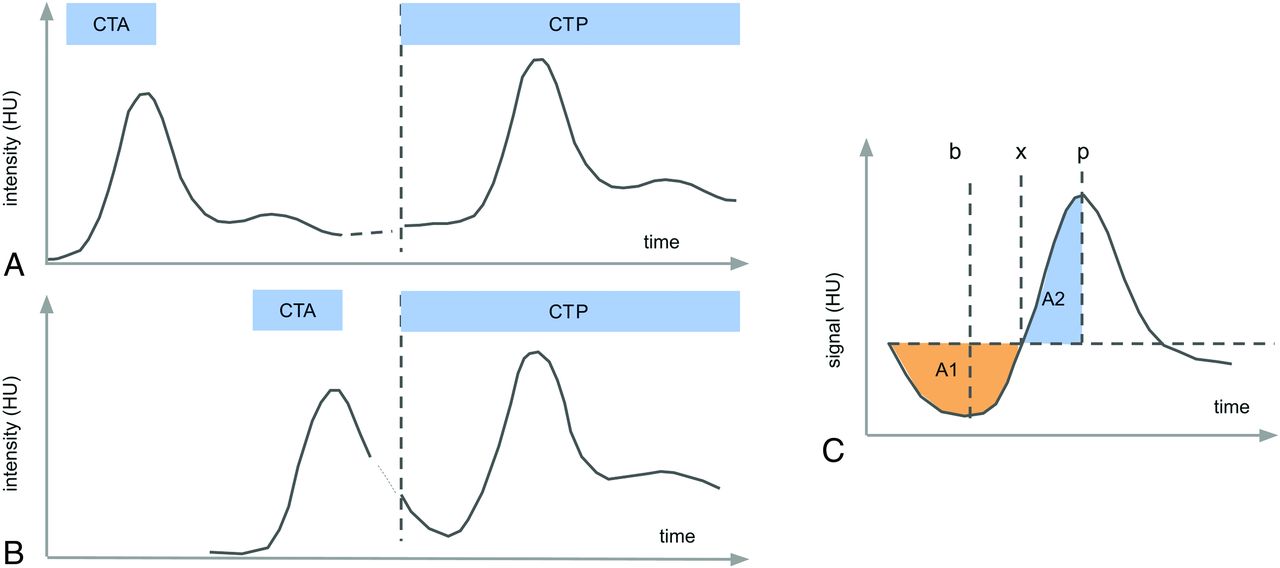
Measurement scheme of CTA performed before CTP. A, If there is a sufficiently long pause between the measurements (>30 seconds), the contrast bolus from the CTA measurement is well-mixed in the vascular system and causes a constant elevation of the CTP baseline on the order of some Hounsfield units. B, If the time gap between CTP and CTA is very short, the trailing flank of the CTA bolus might interfere with the CTP baseline, leading to errors in perfusion calculation. C, We suggest the following simple-but-robust method for detection and correction: The outstanding feature of the effect is the presence of a negative lobe at the curve start before the actual bolus. This can be measured by comparing the areas under the curve A1 and A2. The thus required relevant points can be robustly determined as the following: p as the position of the curve maximum, and the turning point x as the minimum of the integral of the integral/stem function (the area grows larger after this point). If A1/A2 exceeds a certain threshold, the artifact is considered significant and is corrected by dropping all points before the minimum b of the baseline.
The overall hemodynamics might be influenced by factors such as extracranial carotid stenosis or occlusion. We rated the presence of a high-grade stenosis or occlusion (>70% according to NASCET criteria) from DSA available in 387 cases, to examine equal balance among groups.
Multimodal CT Protocol
CT scans were performed on a 128–detector row (Somatom Definition Flash; Siemens) or a 64–detector row multidetector CT scanner (Somatom Definition 64 AS; Siemens). NCCTs were acquired in the spiral mode covering the skull base to the vertex. The parameters for Somatom Definition Flash were the following: reference tube voltage = 120 kV, reference tube current = 300 mAs, CARE Dose4D (Siemens), collimation = 20 × 0.6 mm (“alternating spot”), rotation speed = 1.0 seconds, resolution = 0.75 × 0.75 × 3 mm, gantry tilt if needed. The parameters for Somatom Definition 64 AS were the following: reference tube voltage = 120 kV, reference tube current = 280 mAs, CARE Dose4D, collimation = 64 × 0.6 mm (alternating spot), rotation speed = 0.3 seconds, resolution = 0.75 × 0.75 × 3 mm, gantry tilt if needed.
CTP series were acquired in the axial scan mode with the following protocols for the Somatom Definition Flash: 80 kV, 180 mAs, collimation = 16 × 1.2 mm, no gantry tilt, tube rotation time = 0.3 seconds, toggle technique (5 blocks × 0.3 = 1.5 seconds), z-coverage = 100 mm, section thickness = 5 mm, increment = 5 mm, 27 series every 1.5 seconds = 42-second scan time (effective temporal resolution in the middle of the plane = 1.5 seconds, in the periphery = 2.6 seconds) after intravenous (16–18 G) injection of 40 mL of Imeron 400 (iopamidol; Bracco) + 30 mL of sodium chloride (NaCl) at a flow rate of 6 mL/s.
The parameters for Somatom Definition 64 AS were the following: 80 kV, 180 mAs, collimation = 32 × 1.2 mm, no gantry tilt, tube rotation time = 0.3 seconds, toggle technique (5 blocks × 0.3 = 1.5 seconds), z-coverage = 90 mm, section thickness = 5 mm, increment = 3 mm, 30 series every 1.5 seconds = 45-second scan time (effective temporal resolution in the middle of the plane = 1.5 seconds, in the periphery = 2.6 seconds) after intravenous (16–18 G) injection of 40 mL of Imeron 400 + 30 mL of NaCl at a flow rate of 6 mL/s.
CTA scans were obtained in the spiral mode covering the aortic arch to the vertex, with bolus tracking in the ascending aorta (threshold, 100 HU): The Somatom Definition Flash parameters were the following: reference tube voltage = 100 kV, reference tube current = 155 mAs, CARE Dose4D, collimation = 128 × 0.6 mm, tube rotation time = 0.28 seconds, no gantry tilt, after a cubital (16–18 G) injection of 70 mL of contrast agent (Imeron 400) + 60 mL of NaCl at a flow rate of 5 mL/s.
Somatom Definition 64 AS parameters were the following: reference tube voltage = 120 kV, reference tube current = 110 mAs, CARE Dose4D, collimation = 64 × 0.6 mm, tube rotation time = 0.3 seconds, no gantry tilt, after a cubital (16–18 G) injection of 70 mL of contrast agent (Imeron) + 60 mL of NaCl at a flow rate of 5 mL/s.
Comparison Strategy
We compared group A (CTP before CTA), group B (CTA before CTP), and the subgroup with bolus interference, focusing on multiple technical and clinical levels and metrics: a) Hounsfield unit–time-density and concentration curves, b) histograms of baseline images, c) perfusion parameter maps CBF, CBV, and time-to-maximum (Tmax), and finally, d) hypoperfusion and core volumes.
Analogous to best practices in quality-management systems, this multilevel approach can be regarded as a combination of unit tests and full-system tests: Items (a–c) address several technical levels of the processing pipeline, and item (d) covers potential clinical implications. Unit tests should be performed under well-defined and consistent conditions, so for technical items (a–c), statistical analysis has been restricted to the healthy, nonstroke brain hemisphere. Item (d) finally covers the clinically relevant stroke side. Group comparisons were performed by visual assessment of histograms, median values, and statistical tests.
Data Analysis
Perfusion scans were processed using the software package VEOcore (VEObrain; www.veobrain.com) and customized scripts for detailed data analysis, consisting of the following steps:
Motion Correction.
The perfusion time-series were corrected by rigid-body realignment of all scan volumes to the first volume using the cross-correlation between volumes as the objective function.
Baseline Calculation.
The baseline is defined as the set of volumes before bolus arrival. Bolus arrival was determined as the time point before the Hounsfield unit value exceeded 10% of the bolus peak Hounsfield unit value for the first time (typically 3–7 time points). An average baseline image was calculated as the mean during this time range before bolus arrival.
Coregistration of CTP and NCCT.
NCCT was aligned to the CTP series by a rigid-body coregistration using the mutual information of the images as the objective function.
Brain Masking.
A brain mask was created on the basis of the NCCT image as the Hounsfield unit range (20–100). Morphologic operations (image dilation/erosion, and connected component removal of speckle noise) were applied to clean the masks.
Arterial/Venous Masking.
Arterial/venous masking has not been performed.
Contrast Agent Concentration Calculation.
Relative contrast agent concentration curves were calculated by subtracting the baseline volume (assuming a linear relationship between signal attenuation and contrast agent concentration,8 see also “CTA Flank Effect” below).
Arterial Input Function Selection.
The arterial input function was automatically selected using a cluster analysis approach, dividing all curves into arterial and venous pools and selecting a collection of curves with the earliest bolus arrival of the arterial pool.
Deconvolution.
Deconvolution of tissue curves and the arterial input function was performed by directly solving the inverse model with additional L1 Tikhonov regularization (the strength of the regularization parameter was 5). CBF and Tmax were calculated as the maximum and argmax of the thus obtained residue function. CBV was calculated by numeric integration of the concentration curves.
Selection of the Healthy Hemisphere.
The midline of the brain was automatically determined by coregistration of the baseline image with its mirror image. The healthy hemisphere was selected as the one with smaller median Tmax value.
Normalization to Healthy Hemisphere.
CBV and CBF were normalized to the median value of the healthy hemisphere = 100%.
Infarction Volumetry.
Hypoperfusion and core volumes were calculated on the basis of the generally accepted Endovascular Therapy Following Imaging Evaluation for Ischemic Stroke 3 (DEFUSE-3) thresholds (Tmax > 6 seconds for hypoperfusion and CBF <30% for the infarction core).2
Time-Curve Alignment for Group Comparisons.
The Hounsfield unit density and concentration time curves can differ significantly between patients due to contrast injection timing, cardiac output, and other factors. To make them comparable to some degree, we shifted the curves for each individual patient and resampled them so that the bolus maximum was commonly centered in an acquisition time window between 0 and 70 seconds.
Calculation of Histograms.
Histograms of CBF, CBV, Tmax, and baseline images were calculated for the healthy hemisphere for each patient. We chose to select the healthy hemisphere because it allows testing for effects on the basis of well-defined and consistent conditions for each patient.
Statistical Analysis
Time curves, histograms of baseline image, CBF, CBV, and Tmax were averaged within the groups for visual comparison. The distribution of median values of the histograms serves as a benchmark. For comparison of infarction volumes, we wanted to address the clinical relevance; therefore, only cases with hypoperfusion values of >3 mL have been included in the comparison because cases with lower values are typically just segmentation noise and might introduce a bias. A 2-sided Wilcoxon rank sum test was performed to accept or reject the null hypothesis that the groups had the same median values. Test results with P values < .05 were considered statistically significant.
The CTA Flank Effect and Proposal of a Correction Method
Iodinated contrast agent results in increased x-ray absorption by an approximately linear relationship to its concentration.8 The image intensity curve of a bolus-tracking measurement in a single voxel can be described by I(t) = b + f × c(t), where t denotes the dynamic scan time, b denotes the image intensity before contrast (baseline), f denotes a constant absorption factor and c(t) denotes the contrast agent concentration at a given time. From this, c(t) can be calculated as c(t) = [I(t) – b] / f. The baseline b is typically averaged over the images before arrival of the contrast bolus to improve robustness against noise.
From a theoretic point of view, a “contamination” of the vasculature and parenchyma by contrast agent from a previous injection, for example from a preceding CTA measurement, should not alter this relationship, as long as the concentration is constant across time because it then is absorbed into the constant b. This can be assumed after a sufficiently long interval on the order of 30–60 seconds between CTA and CTP. After such a time interval the CTA bolus is in a well-mixed, constant state in the vascular system (Fig 1).
However, if CTP is performed very shortly after CTA, the trailing flank of the first-pass CTA bolus may extend into the baseline of the CTP measurement in a nonconstant fashion, leading to imprecise results when using the standard perfusion calculation procedures.
A detailed and precise correction approach might involve voxelwise modeling of the curves as a superposition of the CTA and CTP boluses. However, this comes with a number of challenges, especially due to the low signal-to-noise ratios of the voxelwise curves and would involve many parameters.
Therefore, as a pragmatic approach, we propose the following: First, the presence of the artifact should be detected. Only if it exceeds a certain threshold should the curves be corrected. The correction will be performed by removing the first n time points, which are biased by the descending CTA flank. The scheme is illustrated in Fig 1C. The most prominent feature of the artifact is the presence of a negative lobe before the actual bolus peak. This feature can be detected by measuring and comparing the areas under the curve A1 and A2. These areas can be calculated from the mean brain curve over all voxels via the landmarks x and p, where p denotes the maximum of the curve, and x, the turning point where the curve integral/stem function starts to increase, ie, has a curve minimum. If a significant negative lobe is detected (ie, A1/A2 is above a certain threshold), all timepoints before point b, the minimum of the curve, will be dropped, and the value of b will be taken as the only point for baseline calculation, instead of the mean over a certain range. This result comes at the cost of a reduced SNR due to missing averaging of the baseline, but it is reproducible and robust.
Selection of the Optimal Threshold for the Correction Method
For determination of the optimal threshold for artifact detection based on the ratio A1/A2, we performed a receiver operating characteristic analysis on A1/A2 versus the manual reading of the flank effect, and we selected a threshold of A1/A2 = 0.25 as the optimal threshold with an equal number of false-positives (n = 5) and false-negatives (n = 5) in the 49 cases manually rated as the ground truth.
Analysis Software
All scripts and analysis have been performed using the Matlab R2018b software package (MathWorks).
RESULTS
We included 1980 patients in the final analysis. Numbers and histograms of the study population and groups are summarized in Table 1 and Fig 2. CTP was performed before CTA in 368 patients (group A) and after CTA in 1563 patients (group B), and bolus interference occurred in 49 cases (group B1). Age and sex were equally distributed between groups A and B; group B1 had a slight trend toward more elderly patients. Group B1 also showed a noticeably shorter time interval between the end of the CTA and start of the CTP scan (18 versus 62 seconds).
Statistics for perfusion metrics for all groupsa

Study population statistics. Distribution of age, sex, and study date. There is no significant difference in sex and age between the groups CTP before versus after CTA. The group with a CTA flank effect comprised more elderly women. Furthermore, the time interval between the end of CTA and the start of CTP was significantly shorter. Histograms have been normalized to common areas. rel indicates relative.
With respect to our comparison strategy, we obtained the following results (Table 1 and Figs 3–5):

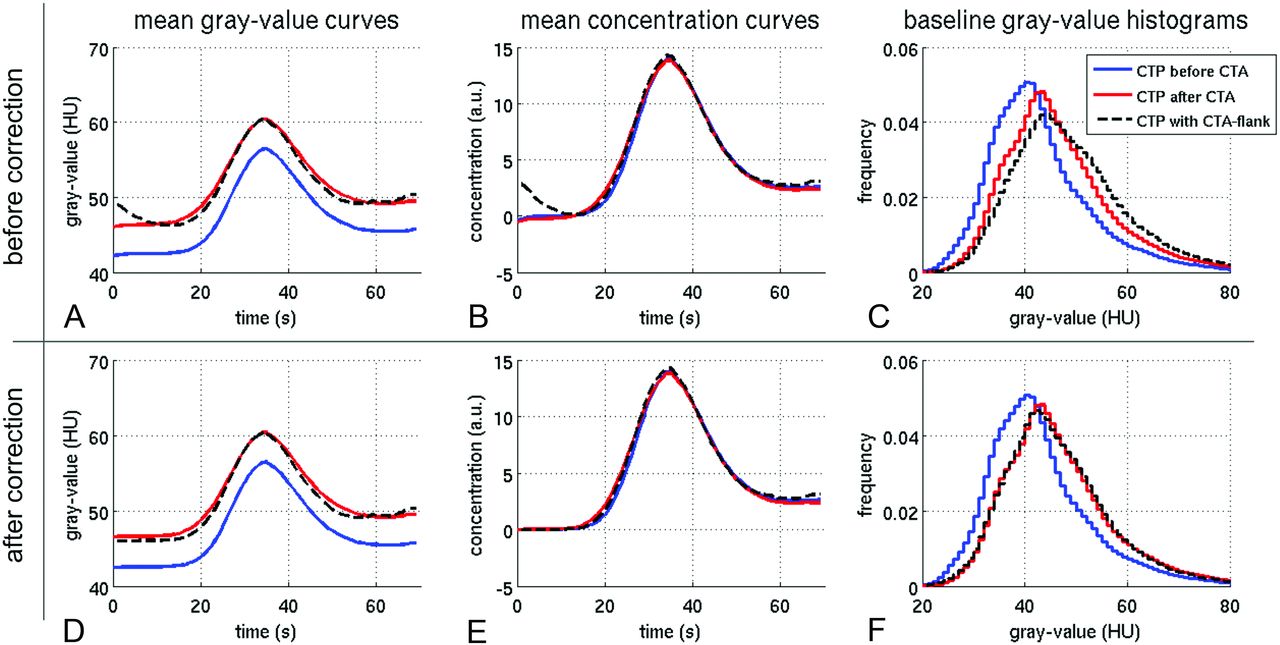
When CTP is performed after CTA, residual contrast agent from CTA causes a global Hounsfield unit shift in CTP (blue versus red). This can be seen in the time curves (A) and the gray-value histograms of the baseline image (C). When one converts the curves to contrast agent concentrations, the baseline is subtracted, and the effect cancels out (B). However, this is not the case when the falling CTA bolus extends into the CTP measurement (A–C, black dotted lines). The curve has a different shape, and the baseline histogram is shifted to even higher values. D–F, There is no significant effect in overall CBF, CBF, and Tmax for CTP before or after CTA (blue versus red). Only when the falling CTA bolus extends into CTP can a significant underestimation of CBV occur (D–F, black dotted line). a.u. indicates arbitrary unit.

Histograms of perfusion parameters and infarction volumes. Upper row (A) and lower row (B) show the values before and after correction, respectively. Between the groups CTA before CTP and CTP before CTA, there is no relevant net effect on the perfusion metrics (red versus blue lines). Only in case of bolus interference (black dotted lines) do CBV and Tmax values tend to be misestimated (A). After application of the correction method, these differences are only marginal (B). hypoperf indicates hypoperfused; vol, volume.

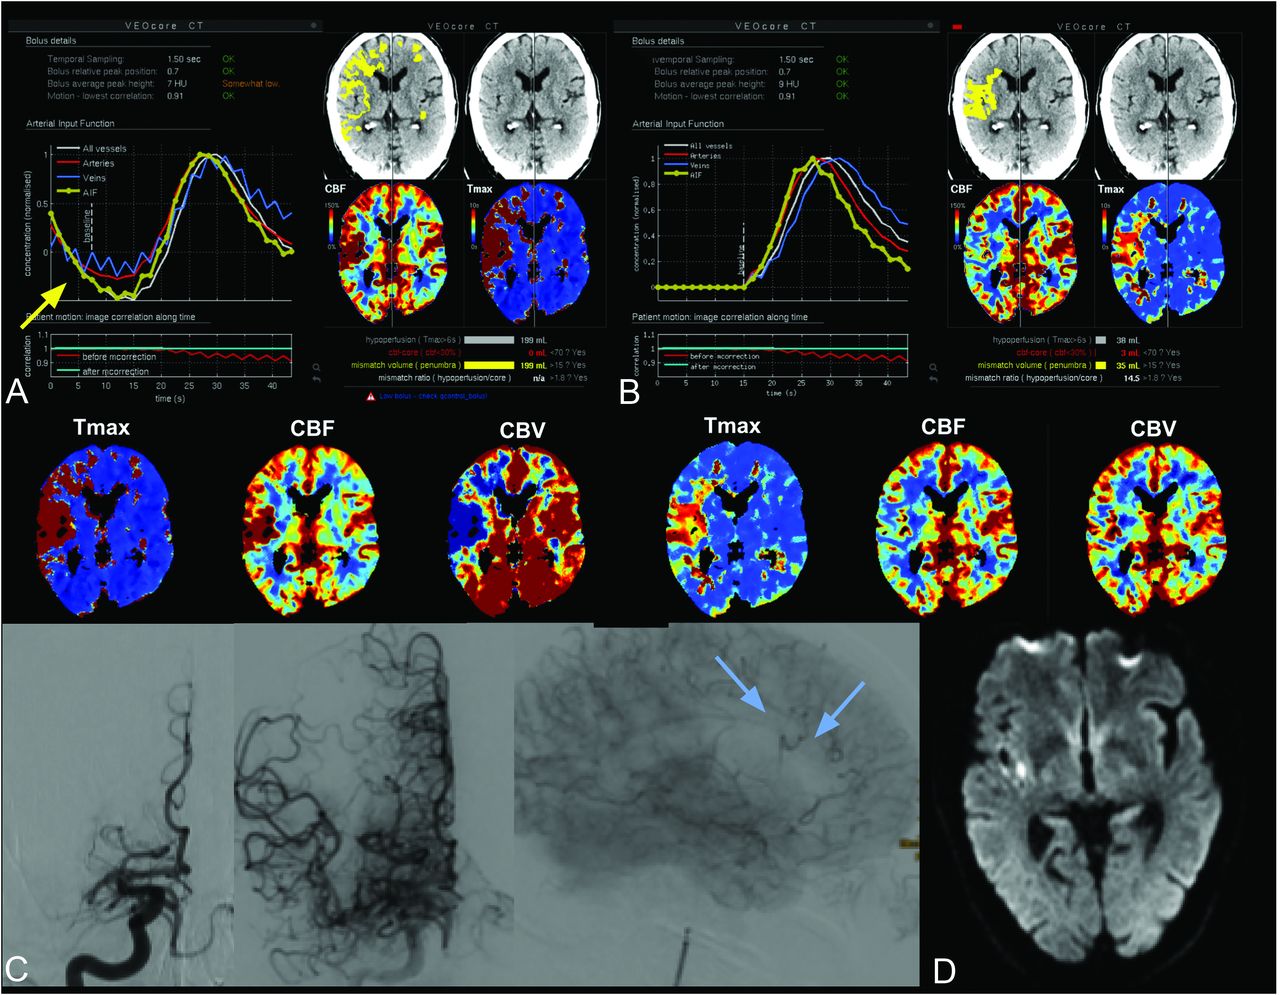
A 61-year-old man with left-sided hemiparesis and dysarthria due to atrial fibrillation and a cardiac ejection fraction of 20%. A, The time-density curves of CTP after CTA show the descending flank of the CTA bolus extending into the beginning of the CTP measurement (A, yellow arrow). Calculated CBF and CBV values are low (blue arrows). B, After mathematic correction, there is an appropriate time-density curve with a circumscript hypoperfusion area. C, Following TICI 2b recanalization of a M1 segment occlusion (blue arrows), follow-up MR imaging shows only tiny insular (D) and peripheral infarcts (not shown).
1) Hounsfield unit–time-density and concentration curves: The baseline density values were significantly higher when CTP was performed after CTA (4 HU on average, Table 1 and Fig 3). This difference vanished in the concentration curves due to the baseline subtraction involved in this process. The subgroup with flank effect showed a relevant bolus interference at the beginning of the measurement. This interference could be corrected using the proposed correction algorithm (Fig 3D, -F).
2) Histograms of baseline images: The difference in the baseline can also be observed in the gray-value histograms in Fig 3C.
3) Perfusion parameter maps: CBF, CBV, and Tmax median values and histograms did not significantly differ between groups A and B, as indicated in Table 1 and Fig 4. For the group with the flank effect, different CBV and Tmax histograms were observed. This difference vanished after application of the correction algorithm (Fig 4B). The correction also improved the visual appearance of the concentration curves and CBV maps, as exemplary shown in Fig 5 for 1 case.
4) Hypoperfusion and core volumes: No significant differences in hypoperfusion and core volumes were observed in groups A and B. Group B1 (flank effect) showed higher volumes. These were reduced after flank correction but were still significant for the hypoperfusion volume.
For confounding factors such as technical failures (strong patient movements, very low SNR) and higher-grade stenosis, the relative counts were similar in all groups, as summarized in Table 2 (approximately 5% technical failures, and 21%–28% higher-grade stenosis).
Counts of cases excluded due to technical failures and the presence of ipsilateral extracranial carotid artery stenosis, derived from DSA dataa
DISCUSSION
In this study, we analyzed the time-density curves and perfusion metrics of a large number of patients with stroke for CTP performed before or after CTA. In the raw concentration curves, the mean baseline values were, on average, 4 HU higher when CTP was performed after CTA, which is in line with the theoretic expectation due to venous filling with contrast agent from the preceding CTA bolus. However, as expected, the difference cancels out when calculating the tracer concentration curves. Consequently, no relevant net effect on the perfusion metrics and infarct core and hypoperfusion volumes was observed. These findings are in line with the results from the study by Dorn et al.5
However, due to the CTA flank effect, which occurred in around 3% of patients in this study, the interference of CTA and CTP boluses can suggest erroneously low CBV values when not corrected. Regarding the hypoperfusion and core volumes, the group with the flank effect showed significantly larger values, which were present even after application of the correction method. The flank group comprised more elderly patients, who are more likely to have larger infarctions, which might partly explain this difference. Furthermore, although not addressed in this study, low cardiac output has already been identified as a factor influencing the nature of the contrast bolus.9
Additionally, higher-grade carotid artery stenosis might be another factor encouraging a bolus interference. However, the average relative stenosis counts were similar in all groups (21%–28%, Table 2). Therefore, it seems that the dominant factor with respect to the prevalence of the flank effect is the time gap between CTA and CTP measurement, as also indicated in Table 1 and Fig 2.
According to our data, the median and maximum time intervals in the flank group were 18 and 25 seconds, respectively. These indicate that a pause of 30 seconds from the end of CTA and the start of CTP should be sufficient from a practical point of view.
Another strategy could be to consider the duration of the bolus-tracking interval—that is the time interval from start of the contrast injection for CTA and the time point when the density values in the ascending aorta reach the predefined threshold of 100 HU.
Copelan et al10 described an underestimation of the infarct core when secondarily assigned patients had previously received IV contrast media. However, the delay between CTA and CTP was >30 minutes, indicating that this underestimation was due either to their software-specific postprocessing, possibly the arterial input function selection used, or other factors in the infarct dynamics themselves such as ischemic barrier disruption.
A potential technical issue not relevant to our study is the impact on masking the perfusion maps, ie, removal of CSF voxels. If such a masking is performed on the basis of the baseline images of CTP, masking might be insufficient due to venous filling if performed after CTA. The VEOcore software used in this study used NCCT for brain masking and was thus unaffected; however, that might be different for implementations of other vendors.
Another limitation is that we could not validate the accuracy of CTP maps with respect to the final outcome because only a minority of patients with TICI 2b, 2c, or 3 recanalization had follow-up MR imaging allowing calculation of Dice indices.
CONCLUSIONS
CTP can be performed after CTA; however, interferences from a preceding CTA bolus must be avoided to prevent miscalculations. This result can be achieved by scheduling a fixed delay on the order of 30 seconds or by applying a correction method.
Footnotes
All procedures performed in the studies involving human participants were in accordance with the ethical standards of the institutional and/or national research committee and with the 1964 Helsinki Declaration and its later amendments or comparable ethical standards. The study was approved by the local ethics committee. Informed consent was waived.
Disclosures: Elias Kellner—RELATED: Employment: VEObrain, Comments: part-time employment. In this study, the software VEOcore manufactured by the company VEObrain was used for perfusion calculation; Stock/Stock Options: VEObrain. Horst Urbach—UNRELATED: Board Membership: Co-Editor Clinical Neuroradiology.
References
- Received February 15, 2021.
- Accepted after revision May 21, 2021.
- © 2021 by American Journal of Neuroradiology


