
Graphical Abstract

Abstract
BACKGROUND AND PURPOSE: Differentiating radiation necrosis (RN) from tumor progression (TP) after radiation therapy for brain metastases is an important clinical problem requiring advanced imaging techniques that may not be widely available and are challenging to perform at multiple time points. The ability to leverage conventional MRI for this problem could have a meaningful clinical impact. The purpose of this study was to explore contrast-enhanced T2 FLAIR (T2FLAIRc) as a new imaging biomarker of RN and TP.
MATERIALS AND METHODS: This single-institution retrospective study included patients with treated brain metastases undergoing DSC-MRI between January 2021 and June 2023. Reference standard assessment was based on histopathology or serial follow-up, including the results of DSC-MRI for a minimum of 6 months from the first DSC-MRI. The index test was implemented as part of the institutional brain tumor MRI protocol and preceded the first DSC-MRI. T2FLAIRc and gadolinium-enhanced T1 (T1c) MPRAGE signal were normalized against normal brain parenchyma and expressed as a z score. The mean signal intensity of enhancing disease for the RN and TP groups was compared using an unpaired t test. Receiver operating characteristic curves and area under the receiver operating characteristic curve (AUC) were derived by bootstrapping. The DeLong test was used to compare AUCs.
RESULTS: Fifty-six participants (mean age, 62 [SD, 12.7] years; 39 women; 28 with RN, 28 with TP) were evaluated. The index MRI was performed, on average, 73 [SD, 34] days before the first DSC-MRI. Significantly higher z scores were found for RN using T2FLAIRc (8.3 versus 5.8, P < .001) and T1c (4.1 versus 3.5, P = .02). The AUC for T2FLAIRc (0.83; 95% CI, 0.72–0.92) was greater than that for T1c (0.70; 95% CI, 0.56–0.83) (P = .04). The AUC of DSC-derived relative CBV (0.82; 95% CI, 0.70–0.93) was not significantly different from that of T2FLAIRc (P = .9).
CONCLUSIONS: A higher normalized T1c and T2FLAIRc signal intensity was found for RN. In a univariable test, the mean T2FLAIRc signal intensity of enhancing voxels showed good discrimination performance for distinguishing RN from TP. The results of this work demonstrate the potential of T2FLAIRc as an imaging biomarker in the work-up of RN in patients with brain metastases.
ABBREVIATIONS:
- AUC
- area under the receiver operating characteristic curve
- IQR
- interquartile range
- rCBV
- relative CBV
- RN
- radiation necrosis
- ROC
- receiver operating characteristic
- SRS
- stereotactic radiosurgery
- T1c
- contrast-enhanced T1
- T2FLAIRc
- contrast-enhanced T2 FLAIR
- TP
- tumor progression
Brain metastases are the most common adult malignant intracranial tumors presenting in 20%–40% of patients with solid malignancies in the course of their disease.1 Stereotactic radiosurgery (SRS) is a key treatment indicated in patients with a limited number of brain metastases.2⇓⇓⇓–6 Despite excellent rates of local control, there is a spectrum of MR imaging changes that can occur weeks to several years after treatment and can mimic tumor progression (TP), both clinically and radiologically. The term radiation-induced contrast enhancement has been coined to describe non-tumor enhancement that results from radiation treatment.7 It encompasses pseudoprogression, a transient increase in the size of enhancement (usually within the first 3 months), and radiation necrosis (RN), a serious and late complication of SRS.
The incidence of RN after SRS varies in the literature, with estimates of up to 30%.8,9 Symptomatic RN is seen in about one-half of these cases, which results in morbidity and death in some cases.10⇓–12 Early intervention with corticosteroids, bevacizumab, surgery, or laser interstitial thermal therapy can improve outcomes in symptomatic RN,13,14 making timely diagnosis critical for patient management.
Distinguishing RN from TP continues to be a problem in neuro-oncology. Histopathology is the criterion standard for diagnosis but may not be feasible in all cases, and it often shows a mixture of RN and viable tumor. Advanced imaging techniques, including DSC perfusion, MR spectroscopy, chemical exchange saturation transfer, and PET9 have been increasingly adopted but may be difficult to acquire longitudinally and may not be available to all centers. Approaches that can distinguish RN from TP on conventional MRI sequences could have significant advantages. First, the diagnostic work-up starts with an analysis of conventional MRI with the subsequent addition of advanced imaging techniques if they are available.15 Second, many patients undergo multiple serial follow-up studies, more easily accomplished with conventional MRI.
Differentiating RN and TP on conventional MRI has proved to be challenging. Semiquantitative and qualitative approaches, such as measurement of the lesion quotient or T1–T2 mismatch,16,17 have been proposed, but these have failed to be reproduced with sufficient sensitivity and specificity to be clinically useful.18 More recently, contrast clearance analysis,19 which involves measuring changes in contrast enhancement on T1-weighted sequences performed at early (5 minutes) and delayed (>60 minutes) time points using image subtraction, has been investigated, but the practicality of a delayed contrast-enhanced MRI is challenging and may not be feasible in all radiology departments. Radiomics and deep learning models applied to conventional MRI are possible, with diagnostic performance approaching that of DSC-perfusion.20,21
Consensus guidelines for brain tumor imaging protocols currently recommend precontrast T2 FLAIR;22 however, there is growing evidence that contrast-enhanced T2 FLAIR (T2FLAIRc) may offer additional diagnostic information. At our institution, T2FLAIRc is routinely performed instead of precontrast T2 FLAIR for several reasons, including reducing protocol time by using the time between contrast administration and the acquisition of post-contrast-enhanced T1 (T1c) MPRAGE and improving the detection of leptomeningeal disease.23⇓⇓–26 In the present work, we evaluate T2FLAIRc as a potential new imaging biomarker for distinguishing RN from TP. We hypothesize that patients with RN and TP will demonstrate significant differences in normalized T2FLAIRc signal intensity, which can be used to distinguish RN from TP.
MATERIALS AND METHODS
Patients
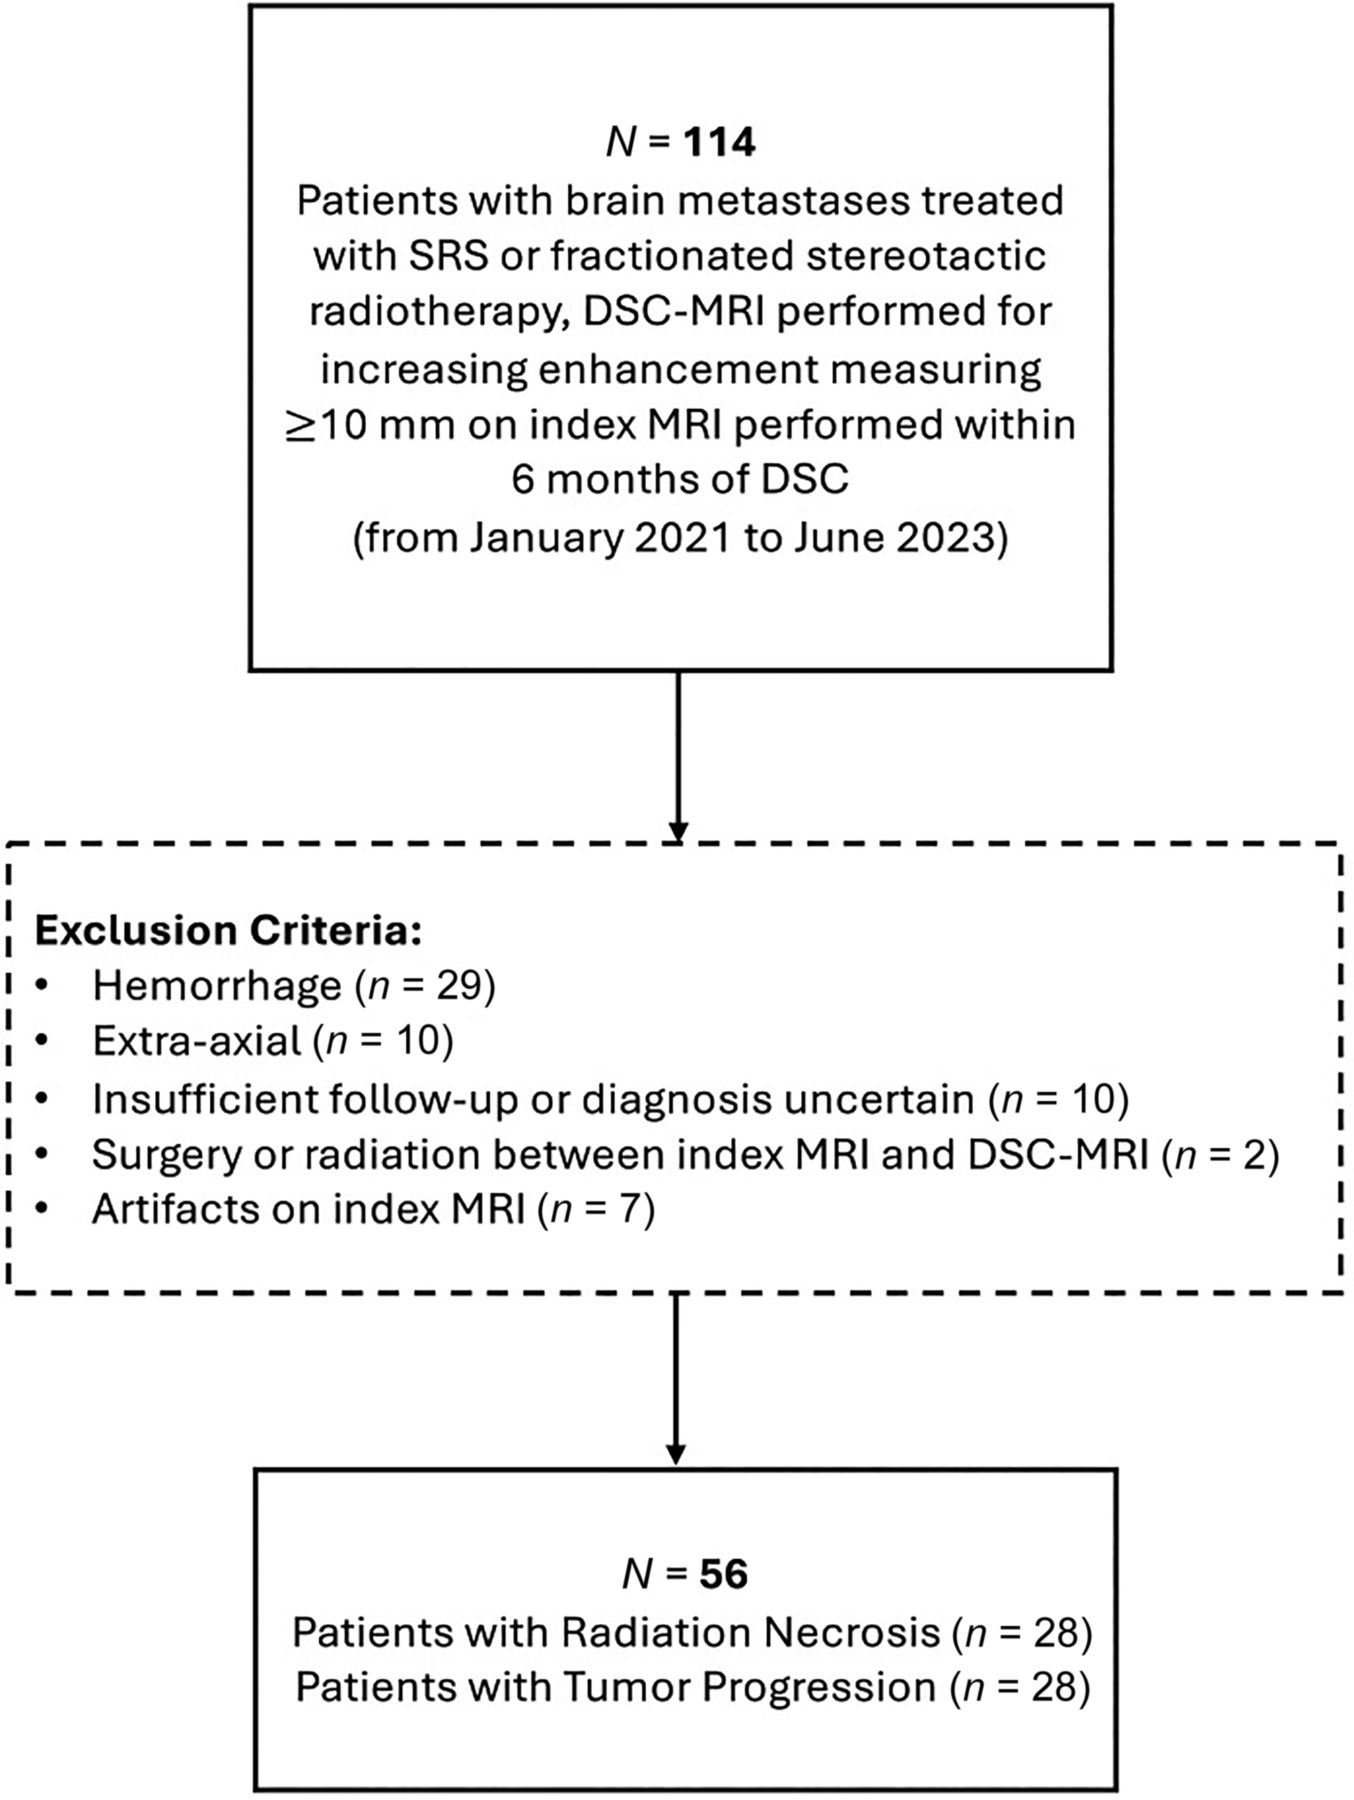
Adult (older than 18 years of age) patients with brain metastases previously treated with SRS or fractionated stereotactic radiation therapy, with an increasing size of enhancement detected on institutional MRI (index MRI) and who underwent subsequent work-up with DSC-MRI to differentiate RN from TP, were identified for this retrospective single-center study. The Sunnybrook Health Sciences Centre research ethics board approved the study (REB #5431) with a waiver of informed consent. The radiology search engine Montage (Montage Healthcare Solutions) was used to identify consecutive studies that contained the word “perfusion” for brain MRI reports between January 1, 2021, and June 30, 2023. For patients with multiple perfusion studies, the earliest perfusion study was used. Inclusion criteria were the following: 1) prior SRS or fractionated stereotactic radiation therapy for brain metastases, 2) an increase in enhancement detected on the index MRI performed within 6 months of the first DSC study, and 3) tumor size of ≥10 mm measured on contrast-enhanced series from the index MRI. Exclusion criteria were the following: 1) hemorrhagic metastasis (blooming on gradient-recalled echo in >50% of lesions) or containing intrinsic T1 hyperintensity, 2) extra-axial metastasis, 3) insufficient follow-up or uncertainty in diagnosis after clinical review, 4) radiation or surgery between the index MRI and DSC study, and 5) corruption of the index MRI by artifacts. Previous surgery with surgical cavity radiation and prior whole-brain radiation was not exclusionary. The study conformed with the Standards for Reporting of Diagnostic Accuracy Studies (STARD, 201527).
MRI Acquisition
Imaging was performed on 1.5T (Magnetom Aera or Sola; Siemens) or 3T (Magnetom Vida; Siemens) MRI systems using body transmit and 20-channel head and neck receiver coils. The institutional brain tumor imaging protocol included axial Readout SEgmentation Of Long Variable Echo-trains (RESOLVE) DWI (b-values = 0 and 1000 s/mm2, TR = 3650–7390 ms, TE = 67.2–72.2 ms, in-plane resolution = 0.54 × 0.54 mm2 to 1.25 × 1.25 mm2, slice thickness = 5 mm); T2 FLAIR acquired in the axial plane (TR = 9000 ms, TE = 80–108 ms, TI = 2500 ms, in-plane resolution = 0.75 × 0.75 mm2 to 0.83 × 0.83 mm2, slice thickness = 3 or 5 mm) immediately after IV injection of a bolus of gadolinium contrast agent (Gadobutrol; Bayer) at a dose of 0.1 mmol/kg followed by a 20-mL saline flush; and 3D T1 MPRAGE (TR = 1800 or 2240 ms, TE = 2.5 or 3 ms, flip angle = 8°, resolution = 1 × 1 × 1 mm3) acquired after T2 FLAIR. For the current study, postgadolinium T2 FLAIR and T1 MPRAGE are referred to as T2FLAIRc and T1c, respectively.
For the DSC-MRI examination, all patients received a total gadolinium dose of 0.1 mmol/kg split into 2 with a half dose administered as a preload bolus for leakage correction and the second half administered during the DSC acquisition. DSC-MRI was acquired in the axial plane using a single-shot gradient-echo EPI sequence (TR = 1830 or 2080 ms, TE = 30 or 31 ms, flip angle = 90°, resolution = 1 × 1 × 3 mm3, 26 slices, 120 phases) during the first pass of a bolus of gadolinium at a rate of 5 mL/s on Phase 30 of the perfusion sequence followed by a 20-mL saline flush injected at the same rate.
Image Processing and Analysis
Tumors were segmented using a Matlab (MathWorks) implementation of the Background LAyer STatistics (BLAST) methodology, which has been previously described.28 Segmentations of enhancing tumor were performed without knowledge of the lesion outcome or results of DSC perfusion by a neuroradiologist (C.H.). T2FLAIRc and T1c signal intensities from the entire tumor volume were normalized to background normal brain parenchyma and expressed as z scores. The mean time for 3D tumor segmentation and signal intensity measurement was 1.2 minutes/tumor. Details of the algorithm are included in the Online Supplemental Data.
Perfusion maps were generated in syngo.via (Siemens) using a localized arterial input function algorithm and leakage correction. A Matlab script was written to derive relative CBV (rCBV) maps and to overlay an ROI defined by a segmentation mask of enhancing tumor. The rCBV maps were generated by normalizing CBV maps to contralateral normal-appearing white matter using a circular ROI placed at or close to the same slice as the enhancing brain tumor.
Reference Standard Assessment of Lesion Outcome
Reference standard assessment of RN and TP was determined by a neuropathologist (J.K.) and a radiation oncologist (H.S.), both blinded to the results of the index test. If histopathology was available, the lesion was considered TP if the histologic assessment by the neuropathologist consisted of >20% tumor.29 If histopathology was not available, then the clinical outcome from serial imaging follow-up MR examinations was based on the Response Assessment in Neuro-Oncology (RANO) brain metastases criteria,30 incorporating the results of DSC perfusion from radiology reports with a minimum of 6 months’ follow-up from the time of the first perfusion study.
Statistical Analysis
Statistical analysis was performed using Matlab. The Shapiro-Wilk test was used to test for normality. Categoric variables are presented as a proportion or percentage of patients. Continuous variables are presented as a mean (SD) for normally distributed variables and median with interquartile range (IQR) for non-normally distributed variables. For patient demographics, categoric variables were compared using the χ2 or the Fisher exact test, when appropriate. Continuous variables were compared using the Wilcoxon rank-sum test for nonparametric group comparisons and the t test for parametric group comparisons. Results were considered significant with P < .05.
Receiver operating characteristic (ROC) curves, area under the ROC (AUC), and 95% CI were derived by bootstrapping using 1000 iterations. Additionally, ROC curves, AUC, and 95% CI for logistic regression models predicting disease status from T2FLAIRc, T1c, rCBV, and combinations of these parameters were performed using leave one out cross-validation. Optimal cut-point, sensitivity, and specificity were determined by the Youden index, and the DeLong test was used to compare AUCs. A logistic regression model was used to assess the association between disease status predicted by T2FLAIRc signal intensity and field strength.
RESULTS
Patient Characteristics
Of the 114 patients initially identified, 29 were excluded because the tumor was hemorrhagic; 10 were excluded because the tumor was extra-axial; 10 were excluded because there was insufficient follow-up or the diagnosis was uncertain; 7 were excluded because of artifacts; and 2 were excluded because of treatment occurring between the index MRI and DSC study (Fig 1). A total of 56 patients were, thus, included and determined to have RN (n = 28) and TP (n = 28). The median time between radiation and the DSC study was 296 (IQR, 222−588) days and 394 (IQR, 347−586) days for the RN and TP groups, respectively (P = .06). The mean time between the index MRI and the DSC study was 78 (SD, 35) days and 68 (SD, 32) days for the RN and TP groups, respectively (P = .30). The diagnosis of RN or TP was made by histopathology in 14 (25%) cases and clinical follow-up in 42 (75%) cases. The median time between the DSC study and histopathology was 75 days (IQR, 52−165 days). For histopathology-proved cases, assessments by RANO and histology were concordant in 10/14 (71%) cases. For the index MRI, 12 patients were scanned at 1.5T and 16 were scanned at 3T in the RN group, and 16 patients were scanned at 1.5T and 12 patients were scanned at 3T in the TP group (P = .42). DSC was not diagnostic in 4 patients: One lesion was obscured by artifacts from the skull base, 1 lesion was too small to characterize, and 2 lesions were not covered by the DSC acquisition. The Table summarizes demographics, tumor characteristics, and MRI data.

Flow diagram for patient selection and exclusion.
| Characteristic | Total (n = 56) | Tumor Progression (n = 28) | Radiation Necrosis (n = 28) | P Value |
|---|---|---|---|---|
| Age (yr) | 61.9 ± 12.7 | 60.2 ± 12.5 | 63.6 ± 12.8 | .32 |
| Sex | 1.00 | |||
| Male | 17 (30.4%) | 8 (28.5%) | 9 (32%) | |
| Female | 39 (69.6%) | 20 (71.4%) | 19 (68%) | |
| Primary cancer type | .50 | |||
| NSCLC | 25 (44.6%) | 14 (50%) | 11 (39.2%) | |
| Breast | 18 (32.1%) | 9 (32.1%) | 9 (32.1%) | |
| Melanoma | 4 (7.1%) | 1 (3.6%) | 3 (10.7%) | |
| RCC | 4 (7.1%) | 1 (3.6%) | 3 (10.7%) | |
| Other | 5 (8.9%) | 3 (10.7%) | 2 (7.1%) | |
| Total dose (Gy) | 25 (IQR,20–30) | 23.3 (IQR,19.5–27.5) | 27.3 (IQR,20–30) | .25 |
| No. of fractions | 3 (IQR, 1–5) | 3 (IQR, 1–5) | 5 (IQR, 1–5) | .72 |
| Time from SRS to DSC (days) | 358 (IQR, 262− 86) | 394 (IQR, 347−586) | 296 (IQR, 222−588) | .06 |
| Time from index MR to DSC (days) | 73 [SD, 34] | 68 [SD, 32] | 78 [SD, 35] | .30 |
| Systemic therapy | 25 (44.6%) | 12 (42.9%) | 13 (46.4%) | 1.00 |
| Lesion outcome | .76 | |||
| Pathology | 14 (25%) | 8 (29%) | 6 (21%) | |
| Follow-up | 42 (75%) | 20 (71%) | 22 (79%) | |
| Scanner field strength | .42 | |||
| 1.5T | 28 (50%) | 16 (57%) | 12 (43%) | |
| 3T | 28 (50%) | 12 (43%) | 16 (57%) |
Note:—NSCLC indicates non-small cell lung cancer; RCC, renal cell carcinoma.
a Categoric variables are presented as a proportion or percentage of patients. Continuous variables are presented as a mean (SD) for normally distributed variables and median (IQR) for non-normally distributed variables. Categoric variables were compared using the χ2 or Fisher exact test, when appropriate. Continuous variables were compared using the Wilcoxon rank-sum test for nonparametric group comparisons and the t test for parametric group comparisons. Results were considered significant with P < .05.
Patient and tumor characteristicsa
Signal Intensity Distributions for Tumor Progression and Radiation Necrosis
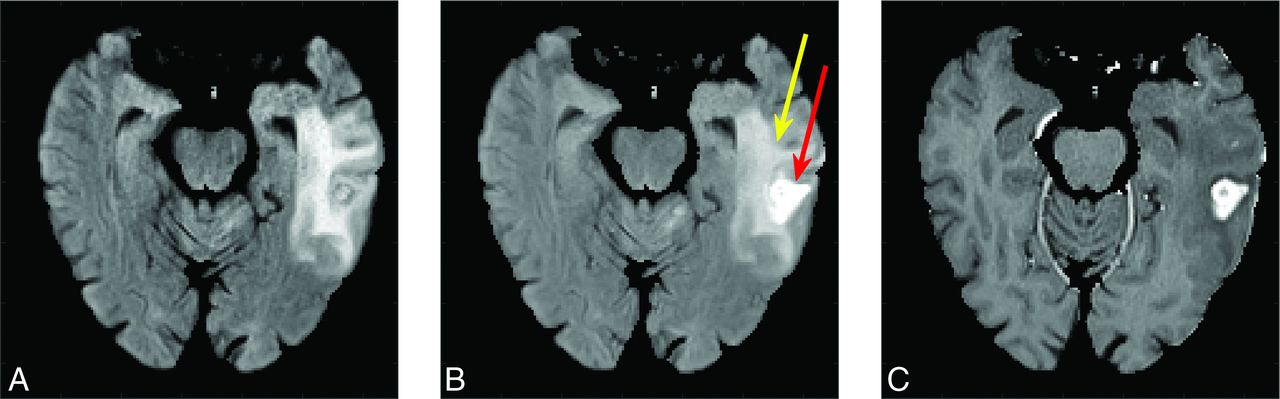
Images of a treated metastasis (case of radiation necrosis) are shown to illustrate the similarities and differences in image contrast for unenhanced T2 FLAIR, T2FLAIRc and T1c (Fig 2). T2FLAIRc demonstrates a hybrid contrast of T2 FLAIR and T1c, with areas of edema and gadolinium contrast enhancement appearing hyperintense.

Unenhanced T2 FLAIR (A), T2FLAIRc (B), and T1c (C) are shown for a treated brain metastasis in the left temporal lobe (a case of radiation necrosis). T2FLAIRc demonstrates hybrid contrast between T2 FLAIR and T1c with edema (yellow arrow) and contrast enhancement (red arrow).
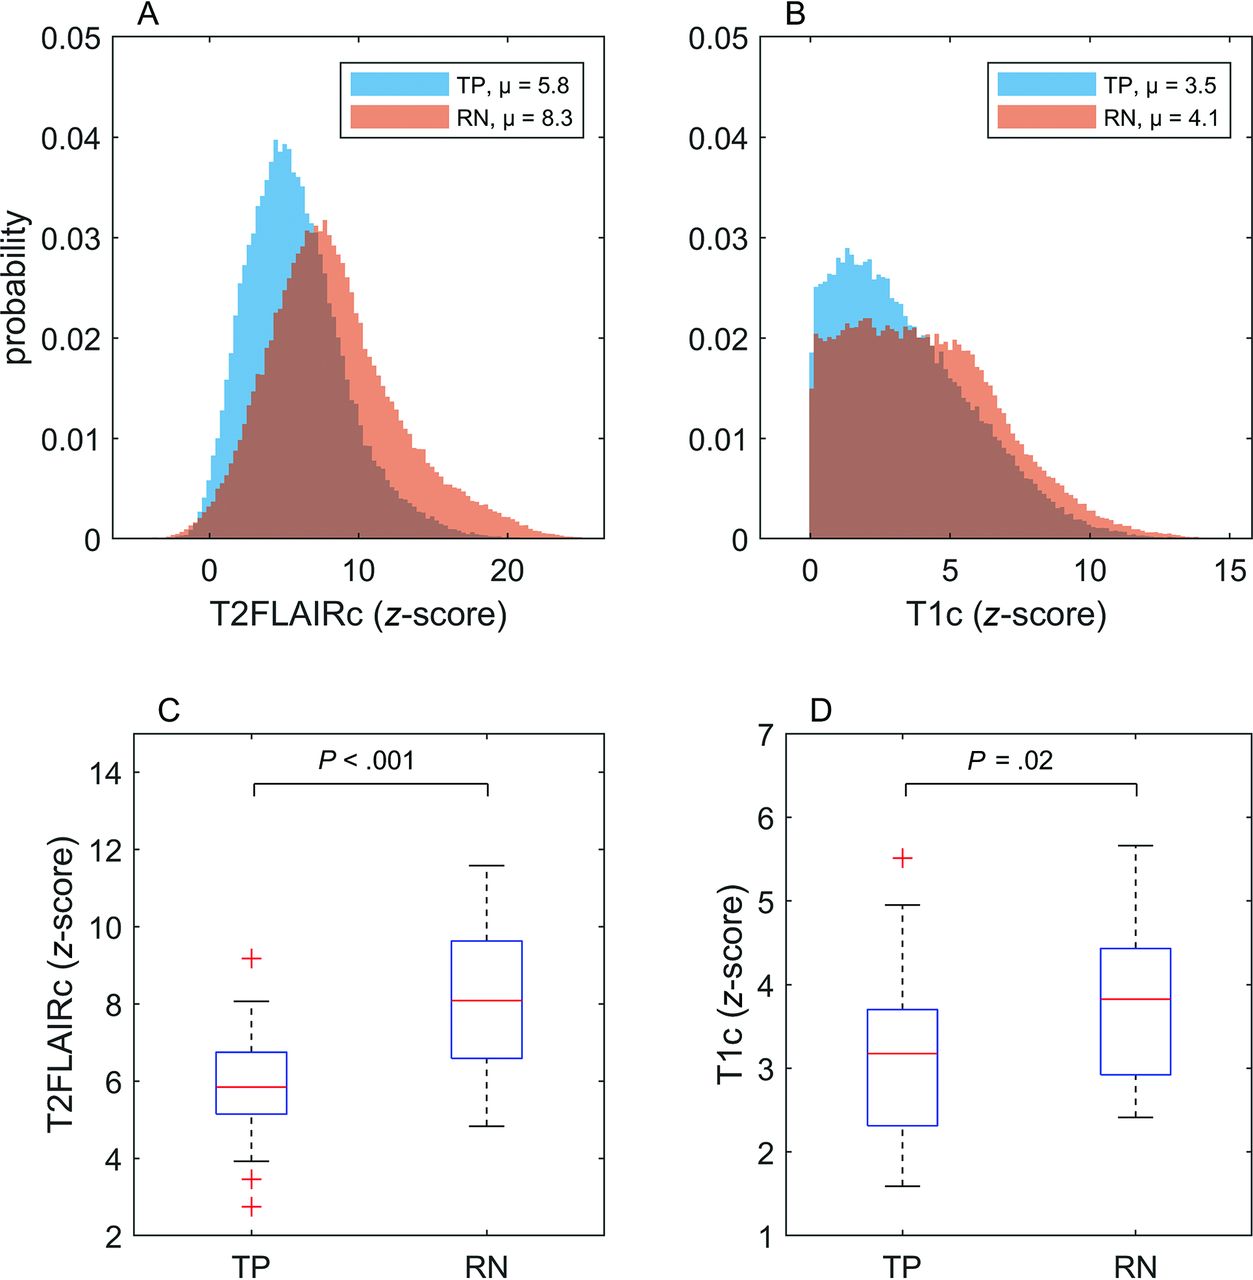
Figure 3 shows histograms and boxplots of normalized signal intensity for the TP and RN groups. The data are for all enhancing voxels for the 3D tumor volume. Signal intensity for T2FLAIRc showed a significantly higher mean for RN compared with TP (8.3 versus 5.8, P < .001). A significantly higher mean signal intensity for T1c was also found for RN compared with TP (4.1 versus 3.5, P = .02).

Histograms and boxplots illustrating the complete set of all enhancing voxels across all patients with TP and RN for T2FLAIRc and T1c. Mean signal intensities for each group are indicated in the figure legends for the histograms. The boxplots depict the mean and IQR. P values for unpaired t tests are shown and considered significant at P < .05.
Diagnostic Performance of T2FLAIRc, T1c, and DSC Perfusion
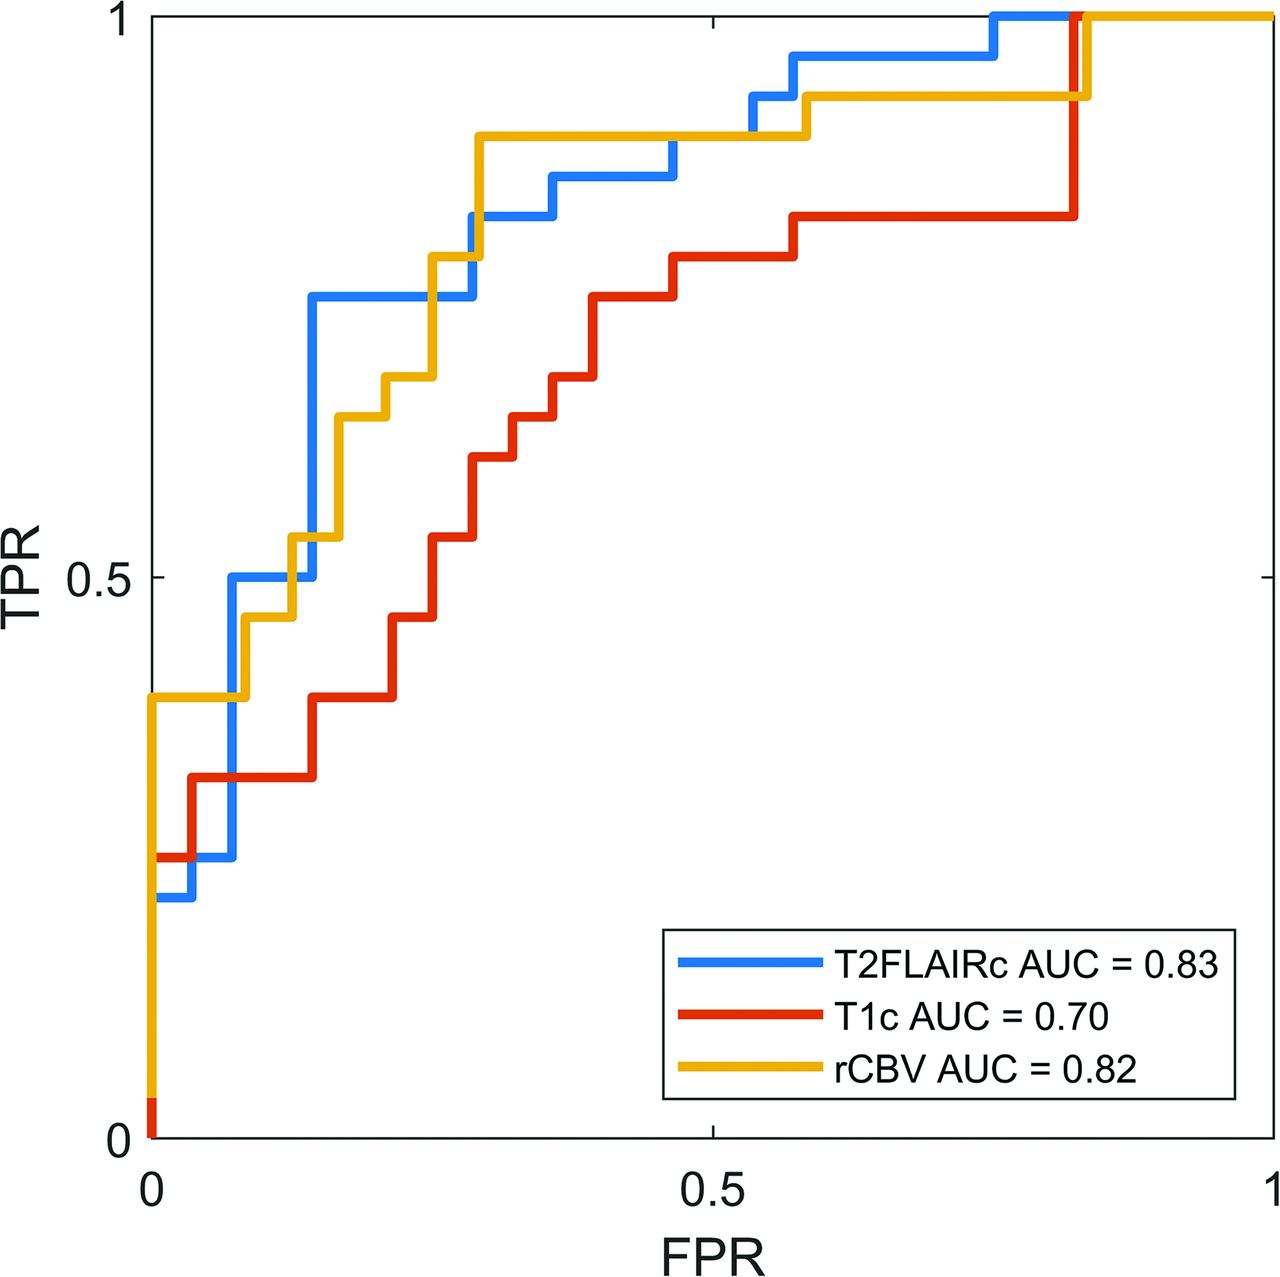
The AUC derived from bootstrapping was 0.83 (95% CI, 0.72-0.92) and 0.70 (95% CI, 0.56-0.83) for T2FLAIRc and T1c respectively (P = .04). The sensitivity, specificity, and optimal cut-point were 75%, 86%, and 6.2 for T2FLAIRc respectively, and 75%, 61%, and 3.6 for T1c respectively. The AUC for DSC perfusion rCBV was 0.82 (95% CI, 0.70-0.93), not significantly different from that of T2FLAIRc (P = .9). The sensitivity and specificity of rCBV were 89% and 61%, respectively. The optimal cut-point for rCBV derived by the Youden index was 2.1. ROC curves are illustrated in Fig 4.

ROC curves for T2FLAIRc, T1c, and rCBV from DSC perfusion. The AUC for T2FLAIRc was significantly higher compared with T1c (P = .04) but not for rCBV (P = .9). FPR indicates false-positive rate; TPR, true-positive rate.
Logistic regression models in leave one out cross-validation showed AUCs = 0.78 (95% CI, 0.67–0.91), 0.59 (95% CI, 0.53–0.82), and 0.79 (95% CI, 0.70-0.92) for T2FLAIRc, T1c, and rCBV, respectively, and AUC = 0.82 (95% CI, 0.76–0.85) for the combined model, with all 3 parameters. The latter was not significantly different compared with T2FLAIRc or rCBV alone (P = .26 and 0.49, respectively). Logistic regression analysis showed that field strength was not a significant predictor of disease status measured by T2FLAIRc (P = .56).
T2FLAIRc Parameter Maps
Figure 5 shows T2FLAIRc parameter maps for a case of TP and RN. For the parameter maps, the color-coded z score of normalized T2FLAIRc signal is shown for enhancing voxels overlayed on the T1c image. Corresponding rCBV maps for the approximate same slice from the follow-up DSC study are shown for comparison.

Comparison of a T2FLAIRc z score parameter map with the rCBV map for cases of TP (upper row) and RN (lower row). A and E, Axial T1c MPRAGE. B and F, Corresponding T2FLAIRc. C and G, T2FLAIRc z score for enhancing tumor voxels overlayed on T1c images shows lower values (mean, 5.8 [SD 2.0]) for TP and higher values (mean, 12.6 [SD 5.7]) for RN. D and H, The rCBV map from follow-up dynamic susceptibility perfusion MRI shows higher values for TP (mean, 4.8 [SD 2.3]) and lower values for RN (mean, 1.3 [SD 1.2]).
DISCUSSION
Differentiating RN from TP on imaging continues to be a problem. The imaging work-up begins with an evaluation of conventional MRI, but given its poor diagnostic performance, multiple longitudinal follow-up studies with the addition of advanced imaging methods such as DSC-MRI and PET are often performed. In the present study, we demonstrated that normalized T1c and T2FLAIRc, measured across all enhancing tumor voxels, are significantly higher for RN than TP. By means of a univariable test of normalized T2FLAIRc signal intensity requiring approximately 1 minute of user time/tumor, RN and TP can be distinguished with an AUC of 0.83, which was not significantly different from DSC perfusion performed approximately 2 months later.
The findings of a higher T1c and T2FLAIRc signal intensity in RN compared with TP are consistent with findings in prior radiomics studies. One of the largest was a study of 66 patients (77 lesions) that examined 51 radiomics features in images from a conventional MRI protocol that included unenhanced T2 FLAIR and contrast-enhanced T1-weighted sequences.31 The top radiomics feature in that study was a minimum T1c, which is a first-order radiomics feature corresponding to the minimum gray-level intensity of contrast-enhanced T1 and showed a higher mean value for RN compared with TP with an AUC of 0.70 in univariable analysis. Minimum T2 FLAIR, corresponding to the minimum gray-level signal intensity of unenhanced T2 FLAIR, ranked eighth with an AUC of 0.65 in univariable analysis.
The physical basis for differences in T2FLAIRc and T1c signal intensity between TP and RN has not been elucidated in this study but is likely multifactorial. One potential explanation is how contrast leakage affects T1 and T2* relaxivity in tumor and RN.32,33 T1 shortening effects of extravasated gadolinium will increase signal intensity on both T1c and T2FLAIRc. This effect will be greater for diseases with higher vascular permeability and larger extravascular extracellular water pools. Countering this effect are T2* effects, which will tend to reduce signal intensity. Extravasated gadolinium will undergo compartmentalization within the extravascular extracellular space, resulting in bulk magnetic susceptibility effects and shortening of T2*. Differences in extracellular tissue microstructure could lead to differential compartmentalization of gadolinium and may also contribute to the signal intensity differences observed in this study. Because RN is expected to have a lower cellularity and a less structured extravascular-extracellular compartment, there will be less T2* shortening from compartmentalized gadolinium, resulting in higher signal intensity compared with tumor. Ultimately, numeric simulations and experiments examining these effects could provide useful insights and guide pulse sequence design to exploit this contrast mechanism.
An attractive feature of T2FLAIRc signal intensity is the ability to qualitatively inspect images or produce parametric maps (Fig 5) at a spatial resolution equivalent to that of conventional MRI. While a rigorous analysis of these images or maps was not undertaken, spatial heterogeneity in T2FLAIRc was observed with similarities to the heterogeneity observed with rCBV maps. Qualitative radiographic interpretation of these maps by a human reader may provide additional insights for distinguishing TP from RN, which could be used to guide the development of radiomics or deep learning models and verify their predictions. Precisely how images or normalized parametric MR maps are used in conjunction with advanced imaging techniques like DSC and how this approach compares with other existing methods are open questions requiring further study.
There are limitations to a simple univariable test based on a normalized signal intensity. For example, the normalized signal intensity used in this study is a measure of the contrast-to-noise ratio and can be affected by imaging parameters such as field strength. The results of logistic regression showed that field strength was not a significant predictor of disease status measured by T2FLAIRc. Other differences in MR hardware, pulse sequence parameters, and contrast dose timing between different sites and vendors could also affect normalized signal intensity and were not explicitly assessed in this study. An evaluation of multisite data using a variety of imaging hardware and protocols and the development of multivariable radiomics or deep learning models to mitigate these effects are a logical next step. Another limitation is the exclusion of lesions with extensive blooming on gradient-recalled echo, which were omitted because of the potential of hemosiderin to alter tumor relaxivity and reduce the observed signal intensity of enhancing tumor on T2FLAIRc and T1c. Lesions with intrinsic T1 hyperintensity resulting from methemoglobin or other causes were also excluded because the methodology used to determine contrast enhancement (normalized T1c signal intensity greater than background brain) would not be able to distinguish intrinsic T1 hyperintensity from contrast enhancement. Other limitations of the present study include the inherent biases and limited data of a retrospective study design, which relied heavily on clinical follow-up and precluded a comparison of T2FLAIRc with unenhanced T2 FLAIR, which is not routinely acquired at our institution. The current study is also limited by a small sample size and not being designed or powered to evaluate the diagnostic superiority/inferiority of normalized T2FLAIRc against DSC perfusion.
CONCLUSIONS
We demonstrate significant differences in normalized contrast-enhanced T1 and T2 FLAIR signal intensity for treated brain metastases. Contrast-enhanced T2 FLAIR signal intensity can distinguish RN and TP with an AUC similar to that of DSC perfusion. The results of this work indicate the diagnostic potential of contrast-enhanced T2 FLAIR for diagnosing RN and present opportunities for the development of new qualitative and quantitative methodologies to exploit this contrast mechanism.
Footnotes
Disclosure forms provided by the authors are available with the full text and PDF of this article at www.ajnr.org.
Indicates open access to non-subscribers at www.ajnr.org
References
- Received May 15, 2024.
- Accepted after revision July 10, 2024.
- © 2025 by American Journal of Neuroradiology


Jump to section
Related Articles
Cited By...
- No citing articles found.