
Article Figures & Data
Figures
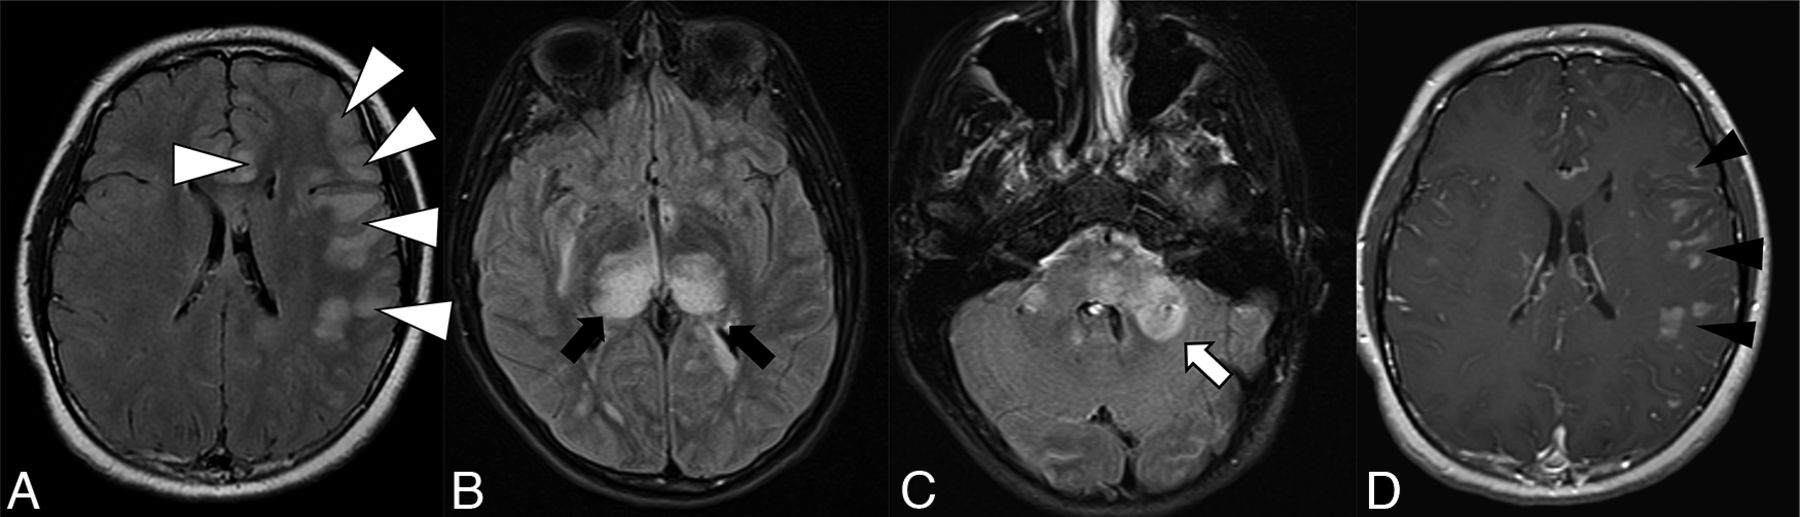
- FIG 1.
Thirteen-year-old adolescent boy who presented with encephalopathy after a viral prodrome, found to have papilledema and opening pressure >39, subsequently found to have serum positivity for anti-MOG antibody. Brain MR imaging demonstrates features of ADEM-like pattern of pediatric MOGAD. A-C, FLAIR hyperintensity involving the left frontal subcortical white matter with ill-defined borders and beginning confluence (white arrowheads), bilateral thalami (black arrows), pons and brachium pontis (white arrow). D, Solid nodular enhancement associated with the left frontal white matter lesions.
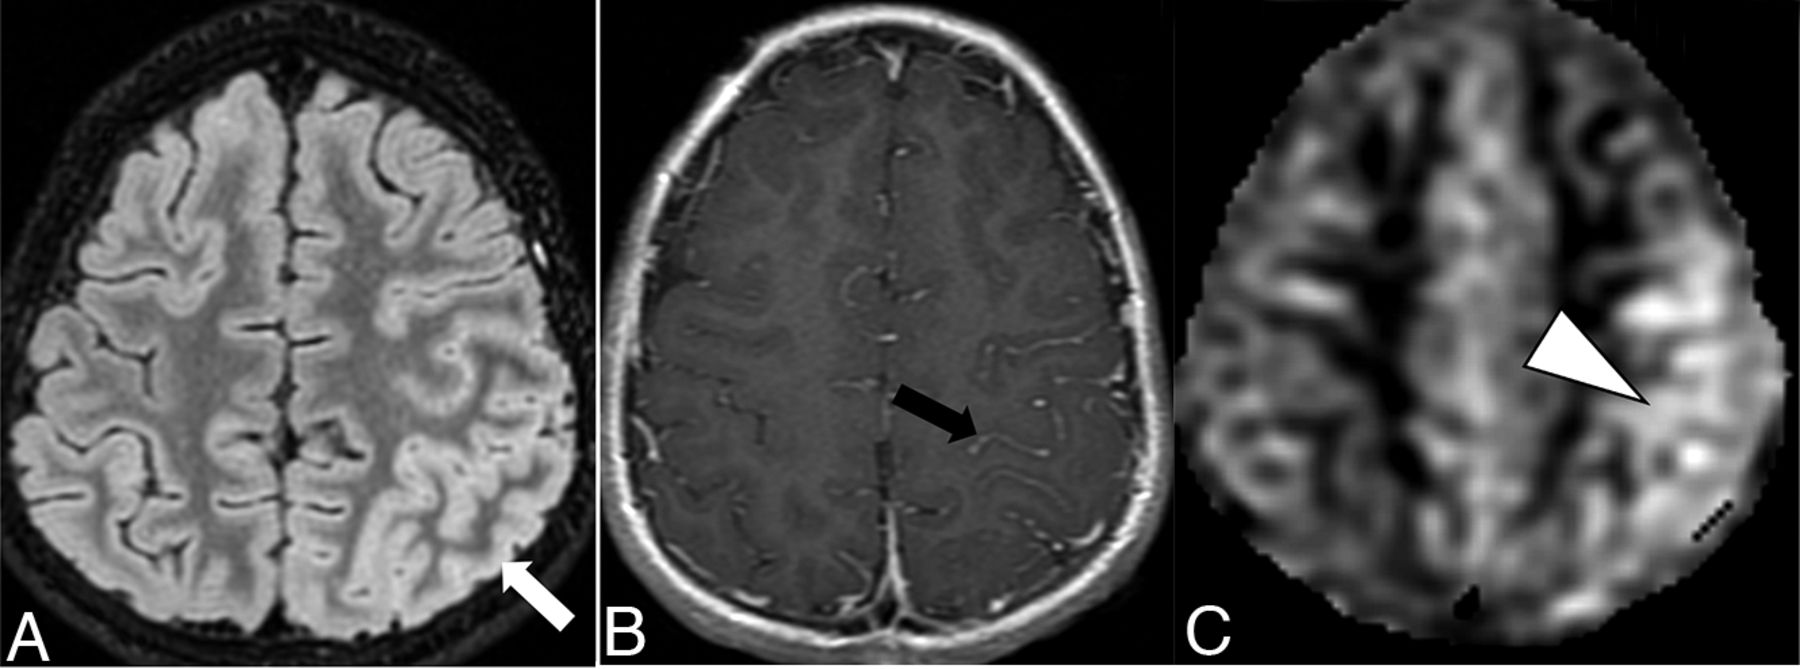
- FIG 2.
Ten-year-old boy with rapid-onset altered mental status and seizures. A, Cortical FLAIR hyperintensity (white arrow) involving the left parietal lobe. B, Associated leptomeningeal enhancement (black arrow). C, Concurrently acquired arterial spine labeling image demonstrates hyperperfusion of the left parietal cortex (white arrowhead), reflective of associated seizure activity.
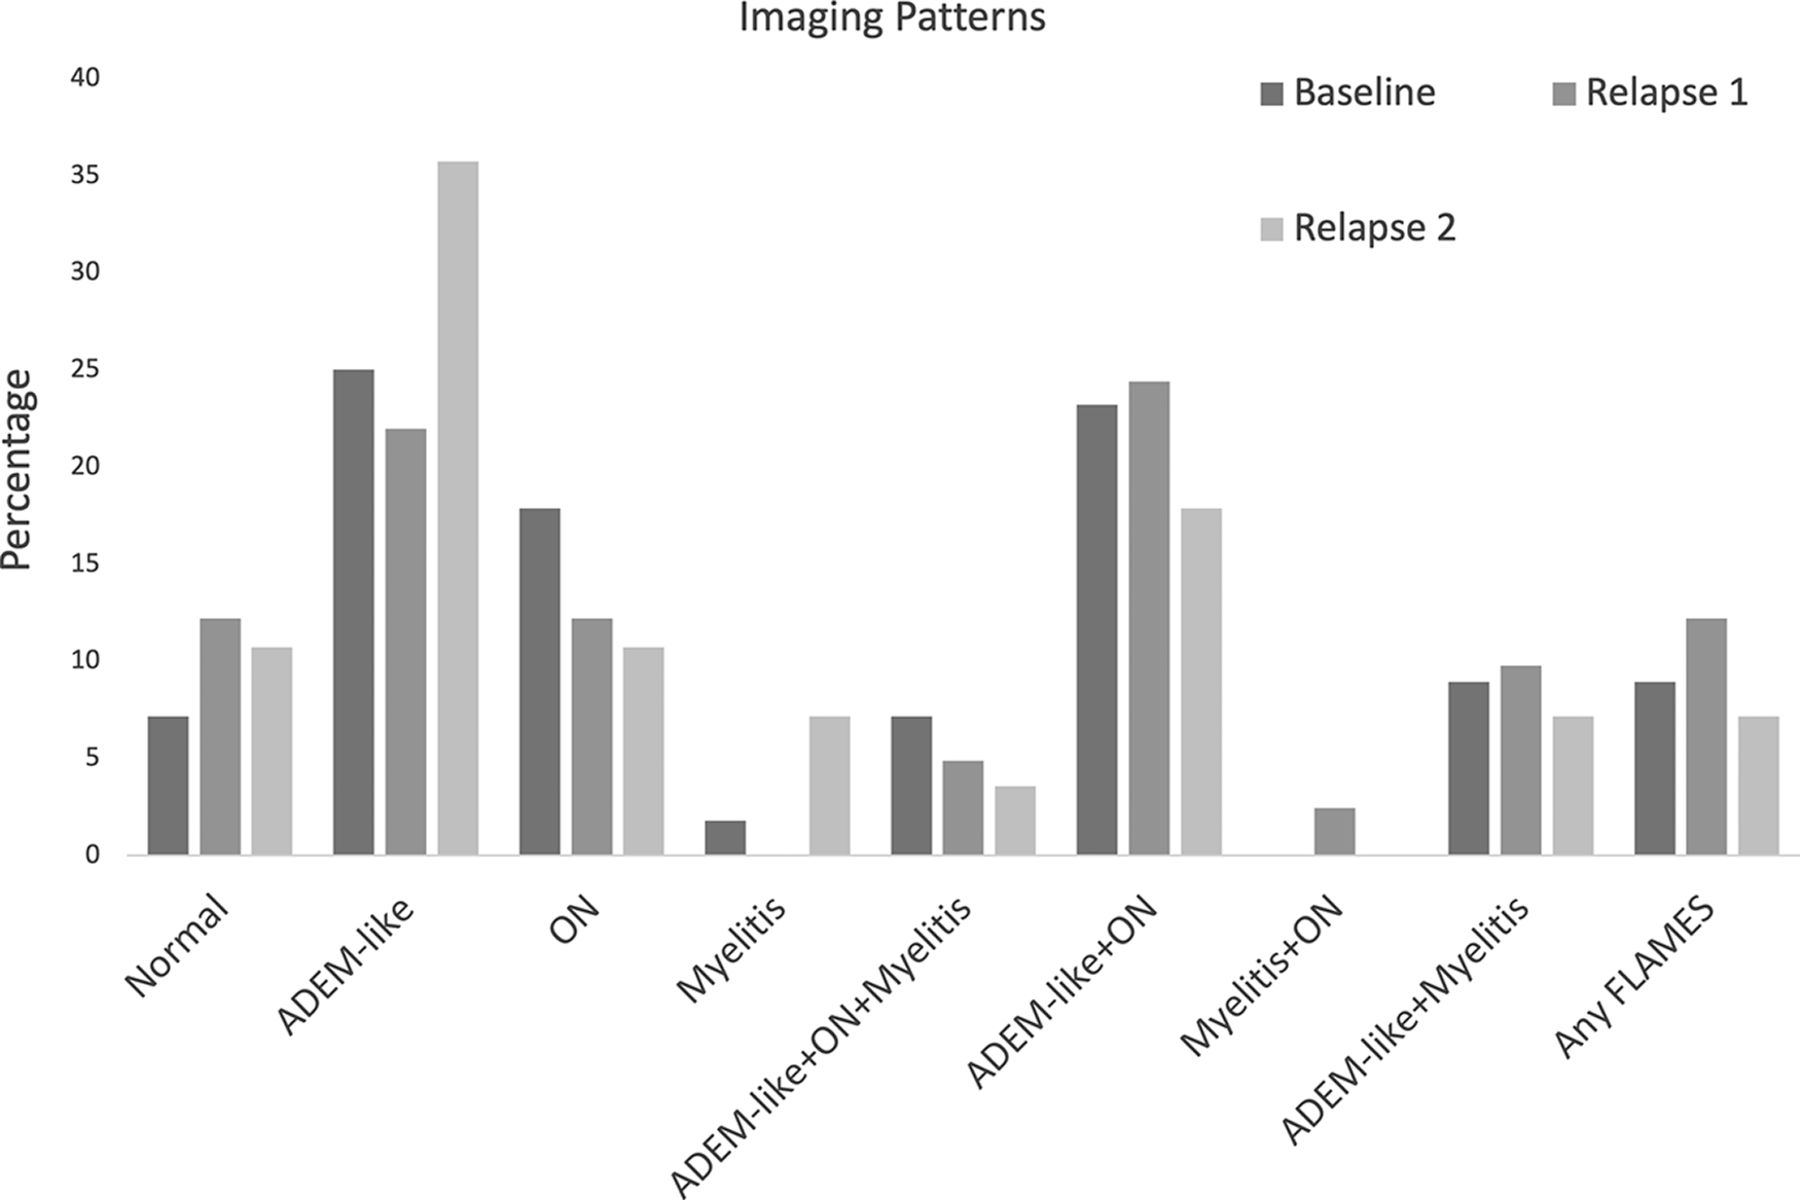
- FIG 3.
Imaging patterns at presentation and relapses.


Tables
- Table 1:
Demographics and clinical data at time of diagnosis in cohort of pediatric patients with MOGAD
n = 61 Age, median (IQR), years 7 (4–11) Female (%) 34 (55.7) Race (%) African American 6 (9.8) Hispanic 13 (21.3) White 22 (36.1) Other 14 (23.0) Unknown 6 (9.8) Initial clinical presentation Syndrome ADEM 14 (23.0) ON 31 (50.8) Myelitis 12 (19.7) Symptom Headache 19 (31.1) Altered mental status 12 (19.7) Ataxia 7 (11.5) Fever 11 (18.0) Seizure 2 (3.3) Anti-MOG titer, median (IQR)a 1:100 (1:80–1:1000) Relapsing disease 45 (73.8) Total episodes up to 10, median (IQR) 3 (1–4) Time to first relapse, median (IQR), months 5 (2–13) aTiter while acutely symptomatic during initial presentation was not available for 45 patients.
Brain Involvement n = 44 n = 44 Supratentorial 41/44 (93.2) Marginsa Cortex 9/44 (20.5) Well-defined 3/42 (7.1) Deep grayb 26/44 (59.1) Ill-defined 32/42 (76.2) Caudate 9/44 (20.5) Mixed 7/42 (16.7) Putamen 9/44 (20.5) Confluencea Globus pallidus 6/44 (13.6) Discrete 16/42 (38.1) Thalamus 21/44 (47.7) Beginning confluence 18/42 (42.9) White matterb Confluent 8/42 (19) Frontal lobe 31/44 (70.5) Mass effect 19/44 (43.2) Parietal lobe 28/44 (63.6) Enhancementb Temporal lobe 22/44 (50) Solid/nodular 17/44 (38.6) Occipital lobe 19/44 (43.2) Peripheral ring 0 Insula 21/44 (47.7) Incomplete ring 1/44 (2.3) White matterb Ill-defined 9/44 (20.5) Subcortical 33/44 (75) Linear 10/44 (22.7) Deep 17/44 (38.6) Leptomeningeal 4/44 (9.1) Periventricular 14/44 (31.8) Cortical 0/44 Internal capsule 9/44 (20.5) None 17/44 (2.3) Corpus callosum 8/44 (18.2) >1 enhancement characteristic 10/44 (22.7) Infratentorialb 31/44 (70.5) Low diffusivityc 2/43 (4.7) Midbrain 15/44 (34.1) Susceptibilityd 0/36 Pons 21/44 (47.7) Medulla 9/44 (20.5) Brachium pontis 12/44 (27.3) Cerebellum 15/44 (34.1) Other 5/44 (11.4) aNot applicable in 2 cases of cortical only involvement.
bPercentages do not add up to 100% as many cases had multiple combinations of features.
cUnknown in 1 patient due to lack of DWI sequence.
dUnknown in 8 patients due to lack of SWI/gradient echo sequence.
- Table 3:
Orbit and spine MR imaging features at presentation for serum antibody-positive MOGAD
Orbital Involvement n =31 Spine Involvement n = 11 Unilateral 6/31 (19.4) Long segment 4/11 (36.4) Bilateral 25/31 (80.6) Short segment 6/11 (54.5) Segments involved Cauda equina enhancement 1/11 (9.1) Orbital 24/31 (77.4) Focality Intracanalicular 20/31 (64.5) Unifocal 3/11 (27.3) Prechiasmatic 17/31 (54.8) Multifocal 8/11 (72.7) Optic chiasm 5/31 (16.1) Location Optic tract 4/31 (12.9) Cervical 8/11 (72.7) Optic nerve enhancementa 25/29 (86.2) Thoracic 6/11 (54.5) Perineural enhancementb 17/25 (68) Conus 5/11 (45.4) Optic nerve low diffusivityc 10/15 (66.7) Cauda equina 1/11 (9) Pattern Central 6/11 (54.5) Peripheral 4/11 (36.4) Entire cross-section 3/11 (27.3) Central gray only 4/11 (36.4) Enhancement None 7/11 (63.6) Intramedullary 3/11 (27.3) Leptomeningeal 1/11 (9) Cord expansion 5/11 (45.4) aUnknown in 2 patients due to absence of contrast.
bUnknown in 6 patients due to absence of contrast and/or fat saturation.
cUnknown in 16 patients due to missing DWI sequence.
- Table 4:
Variation of imaging patterns at relapse stratified by age greater or less than 9 years
Relapse 1 Relapse 2 Age ≤9 (n = 23) Age >9 (n = 18) P Value Age <=9 (n = 13) Age >9 (n = 15) P Value Normal 1/23 (4.3) 4/18 (22.2) .008 1/13 (7.7) 2/15 (13.3) .211 ADEM-like 8/23 (34.8) 1/18 (5.6) 8/13 (61.5) 2/15 (13.3) ON 3/23 (13.0) 2/18 (11.1) 1/13 (7.7) 2/15 (13.3) Myelitis 0 2/15 (13.3) ADEM-like + ON + myelitis 2/23 (8.7) 0 0 1/15 (6.7) ADEM-like + ON 7/23 (30.4) 3/18 (16.7) 2/13 (15.4) 3/15 (20) Myelitis + ON 0 1/18 (5.6) ADEM-like + myelitis 2/23 (8.7) 2/18 (11.1) 1/13 (7.7) 1/15 (6.7) Any FLAMES 0 5/18 (27.8) 0 2/15 (13.3)


Jump to section
Related Articles
Cited By...
- No citing articles found.