
Article Figures & Data
Figures
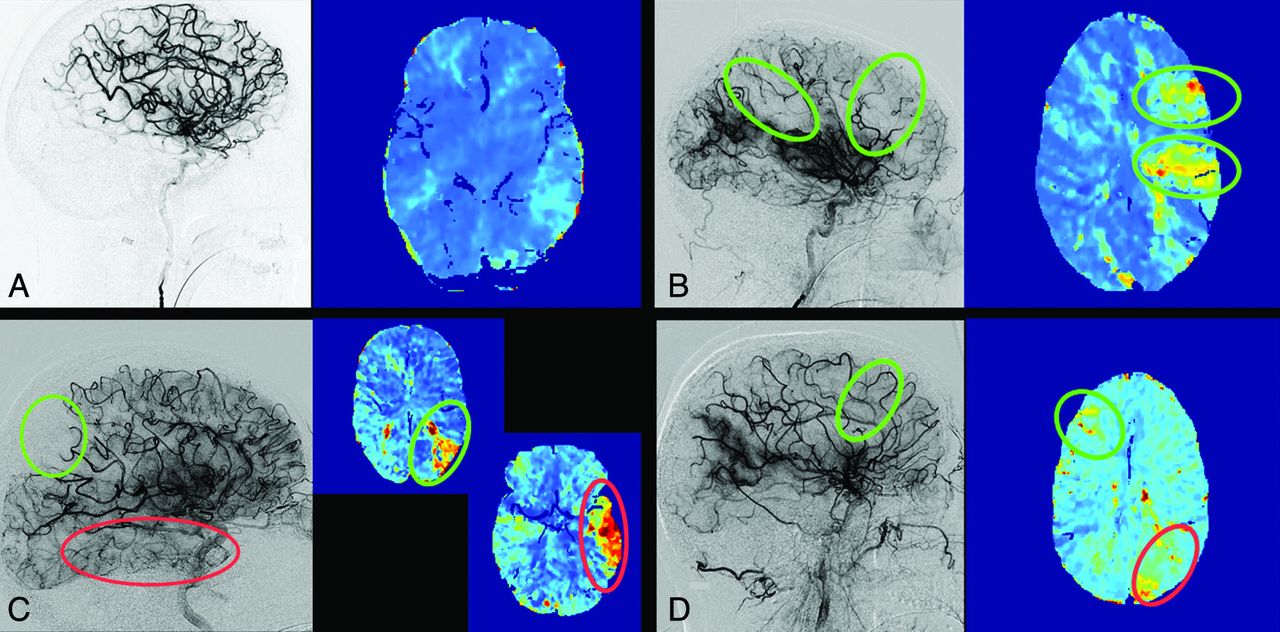
- FIG 1.
Concurring ratings regarding the presence of hypoperfusion. A, Patient with a left-M1 occlusion with complete reperfusion (eTICI 3) on the final angiography imaging and normal perfused tissue on FPCT-PI. B, Patient with a left-M1 occlusion with incomplete reperfusion (eTICI 2b50) on the final angiography imaging and corresponding frontal and parietal hypoperfusion deficits on the FPCT-PI. C, Patient with a left-M1 occlusion with incomplete reperfusion (eTICI 2b67) on the final angiography series, with a clear deficit in the parietal region. On follow-up FPCT-PI, the corresponding hypoperfusion is visible in the same area (green circle), with an additional hypoperfusion noted in the temporal region (red circle). The temporal branch occlusion was not noted by the core lab, but confirmed after making FPCT-PI available. D, Patient with a right-M2 occlusion with incomplete reperfusion on the final angiography series (eTICI 2b67, green circle) and hypoperfusion on the contralateral unaffected side (red circle).
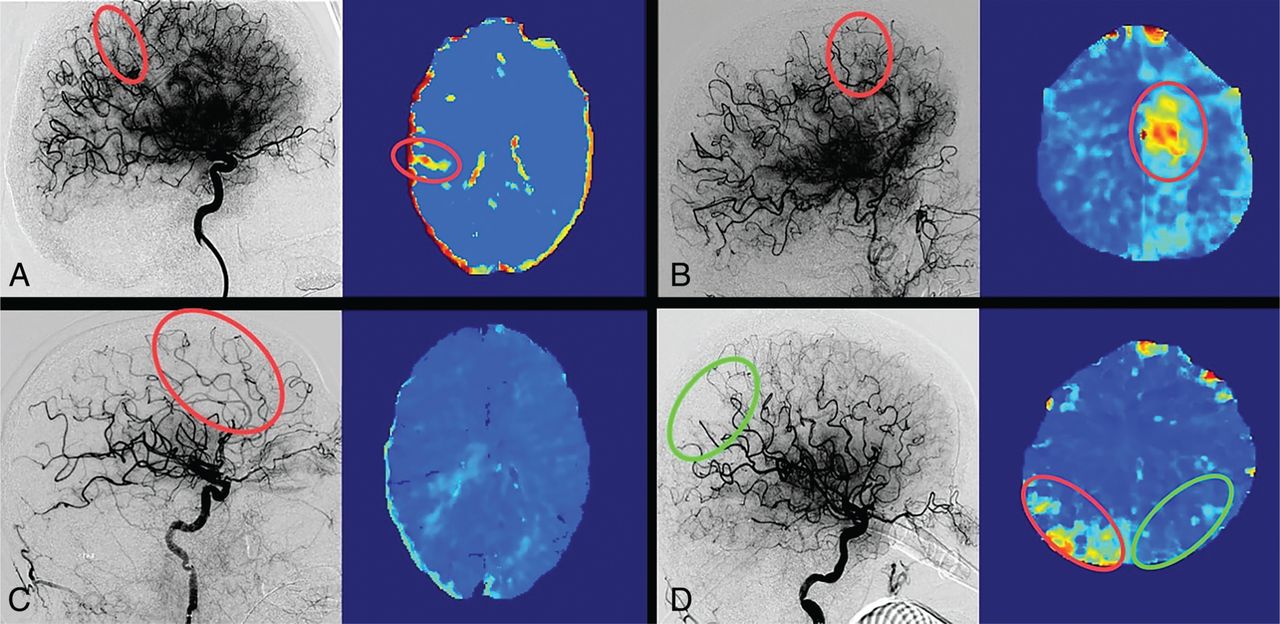
- FIG 2.
Discrepant ratings regarding the presence of hypoperfusion. A, Patient with a right-M1 occlusion rated as complete reperfusion (eTICI 3) on the final angiography imaging, but follow-up FPCT-PI revealed distal nonperfused tissue. A small residual M4 branch occlusion was confirmed by the core lab after making FPCT-PI available. B, Patient with a left-ICA occlusion rated as complete reperfusion (eTICI 3) on final angiography imaging, but follow-up FPCT-PI revealed a new hypoperfusion due to a distal frontal anterior cerebral artery branch occlusion. C, Patient with a left-M1 occlusion with incomplete reperfusion (eTICI 2b67) on the final angiography series with a clear capillary phase deficit in the frontal region. Follow-up FPCT-PI showed complete delayed reperfusion without any perfusion delays. D, Patient with a left-M1 occlusion with a small persisting deficit in the parietal region on the final angiography run (eTICI 2c, green circle). Follow-up FPCT-PI shows no perfusion delay on the left side; however, there was a hypoperfusion deficit on the contralateral side (red circle).
- FIG 3.
Study flow chart and patient allocation based on the agreement between the findings on final DSA runs and FPCT-PI.


Tables
Baseline and Interventional Characteristics
Variables N = 26a Baseline Age 77 (61, 83) Sex (male) 18 (69%) NIHSS on admission 15 (11, 20) Intervention eTICI score (core-lab adjudicated grading) 2a 2 (8%) 2b50 2 (8%) 2b67 10 (38%) 2c 5 (19%) 3 7 (27%) Time from DSA to FPCTP (min) 4.3 (3.2, 7.5) Total contrast dose for both DSA and FPCTP (mL) 200 (183, 228) Outcome NIHSS at 24 hours 6 (2, 15) 90-day mRS 0 2 (7.7%) 1 8 (31%) 2 2 (7.7%) 3 4 (15%) 4 3 (12%) 5 1 (3.8%) 6 6 (23%) a Data are median (IQR); n (%).


