
Article Figures & Data
Figures
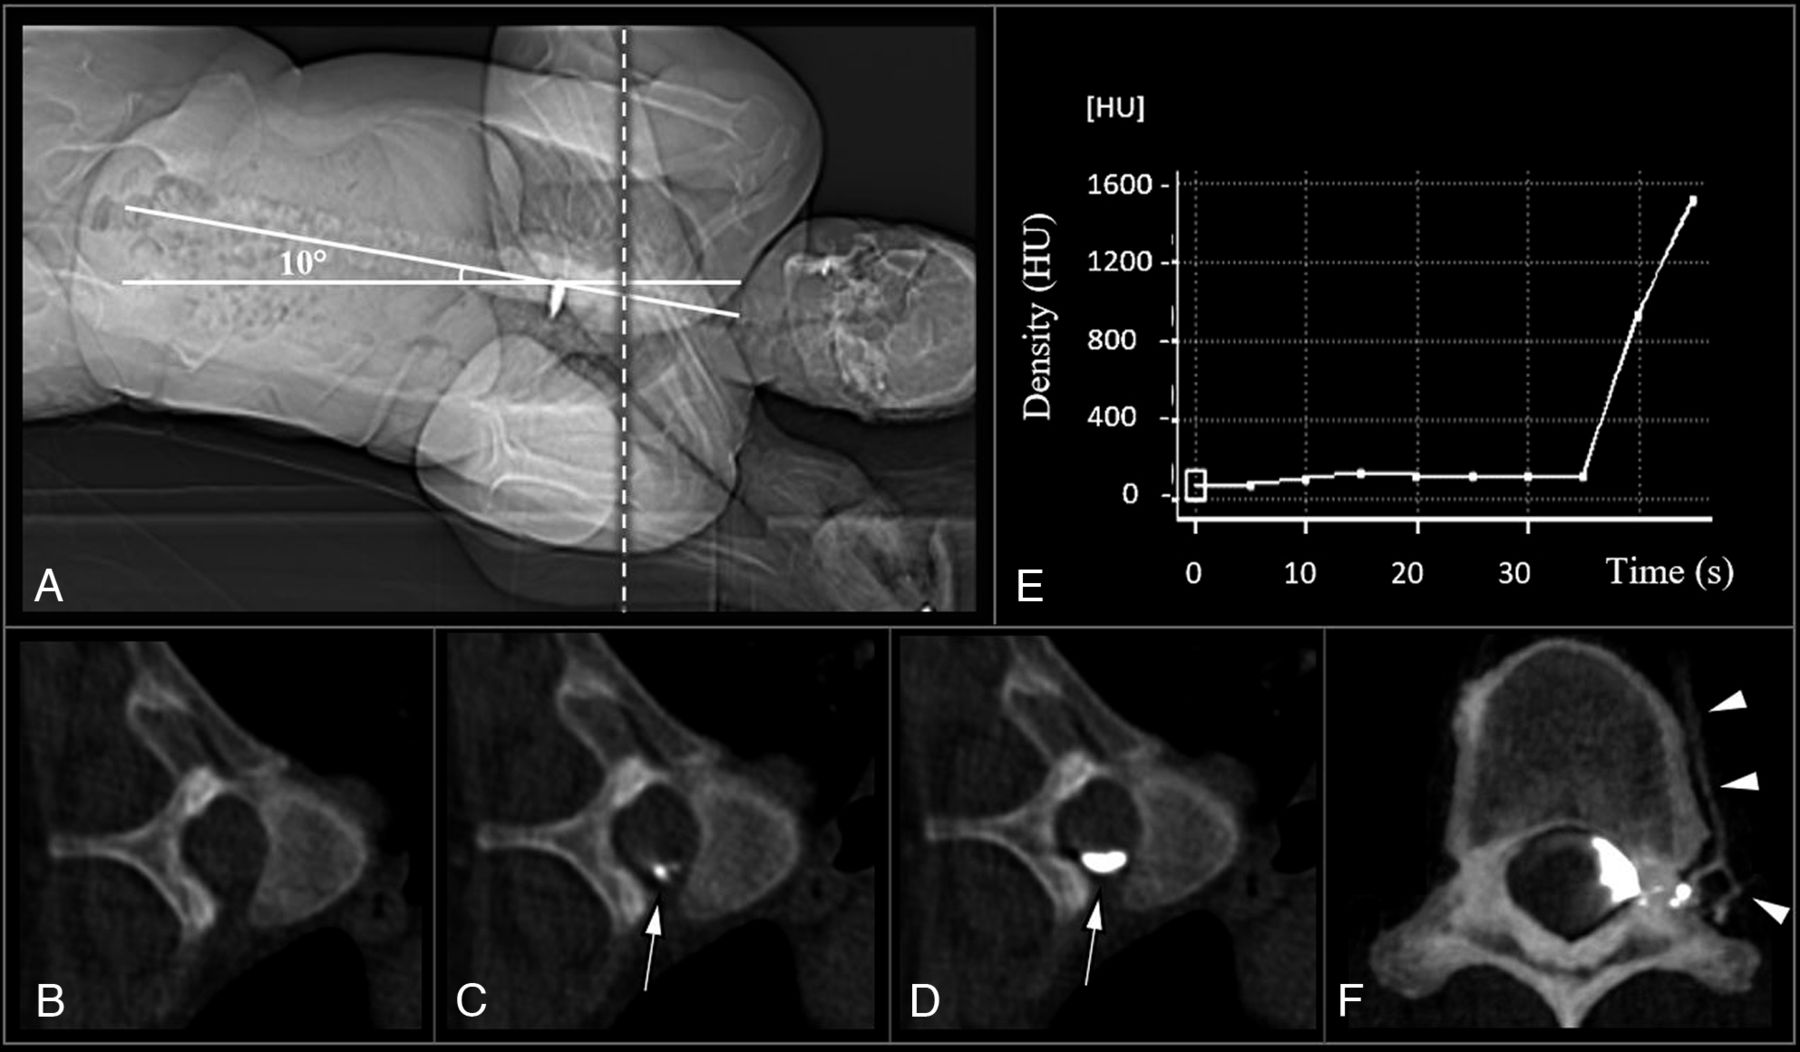
- FIG 1.
Lateral decubitus dynamic CT myelogram with real-time contrast bolus tracking (dCTM-BT): A, Frontal CT scout image shows patient in the left lateral decubitus position on the CT gantry table, with the hips placed at the apex of a custom firm foam wedge in the Trendelenburg position, at an angle of approximately 10°, to facilitate the caudocranial flow of contrast from the lumbar puncture towards the cervical spine. B–D, Real-time contrast bolus monitoring axial scans at the level of T5 (A, dashed line) with axial slices taken at 5-second intervals until the visualization of dense contrast (D, arrow). Note that dense contrast visualization is typically observed immediately after the initial appearance of contrast (C, arrow). E, Graph of density (Hounsfield units, HU) of monitored contrast bolus over time (region of interest placed at arrow in panels C and D; note that this graph is for illustrative purposes and is not utilized during the procedure). F, Axial CT myelogram showing the contrast enhancement of the paraspinal veins at the left T10, indicating a CSF-venous fistula (F, arrowheads).
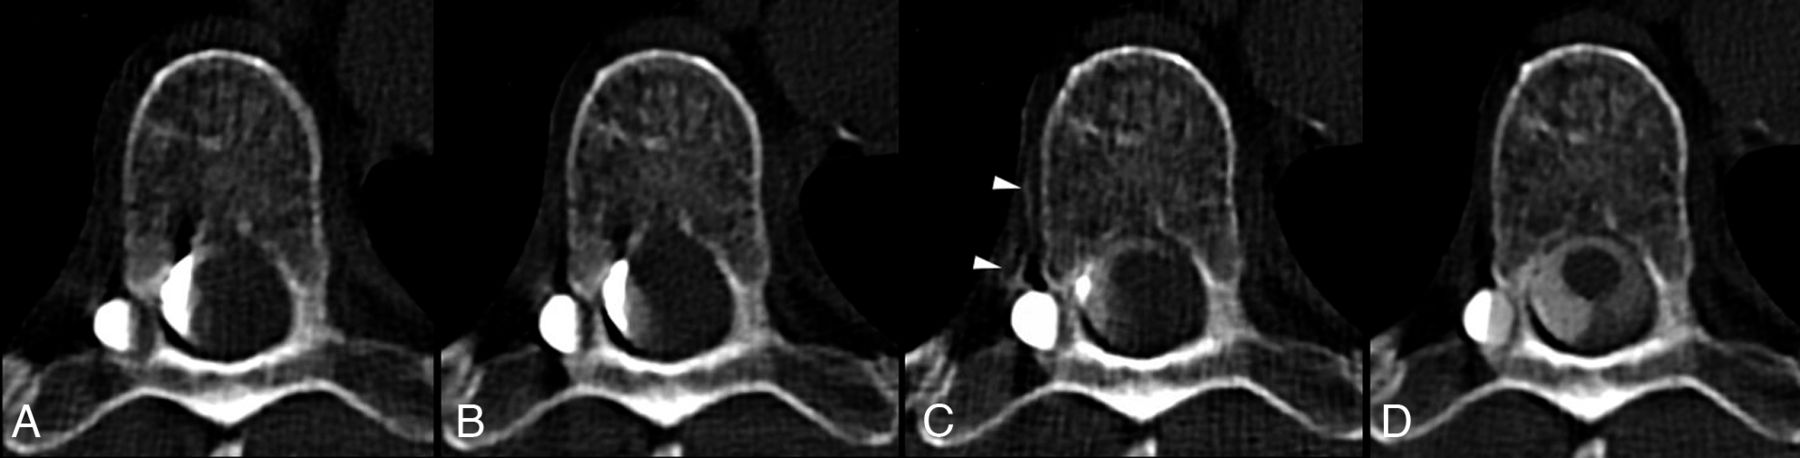
- FIG 2.
Axial images from a right lateral decubitus dynamic CT myelogram with bolus-tracking that were acquired at 30 seconds (A), 60 seconds (B), 2 minutes (C), and 4 minutes (D) after dense contrast was visualized on the bolus-tracking. A CSF-venous fistula is clearly identified on the image acquired at 2 minutes, with contrast visualized in a right T7 paraspinal vein (C, arrowheads). Note that the CVF only becomes more prominent after the adjacent diverticulum has nearly been completely filled with contrast.
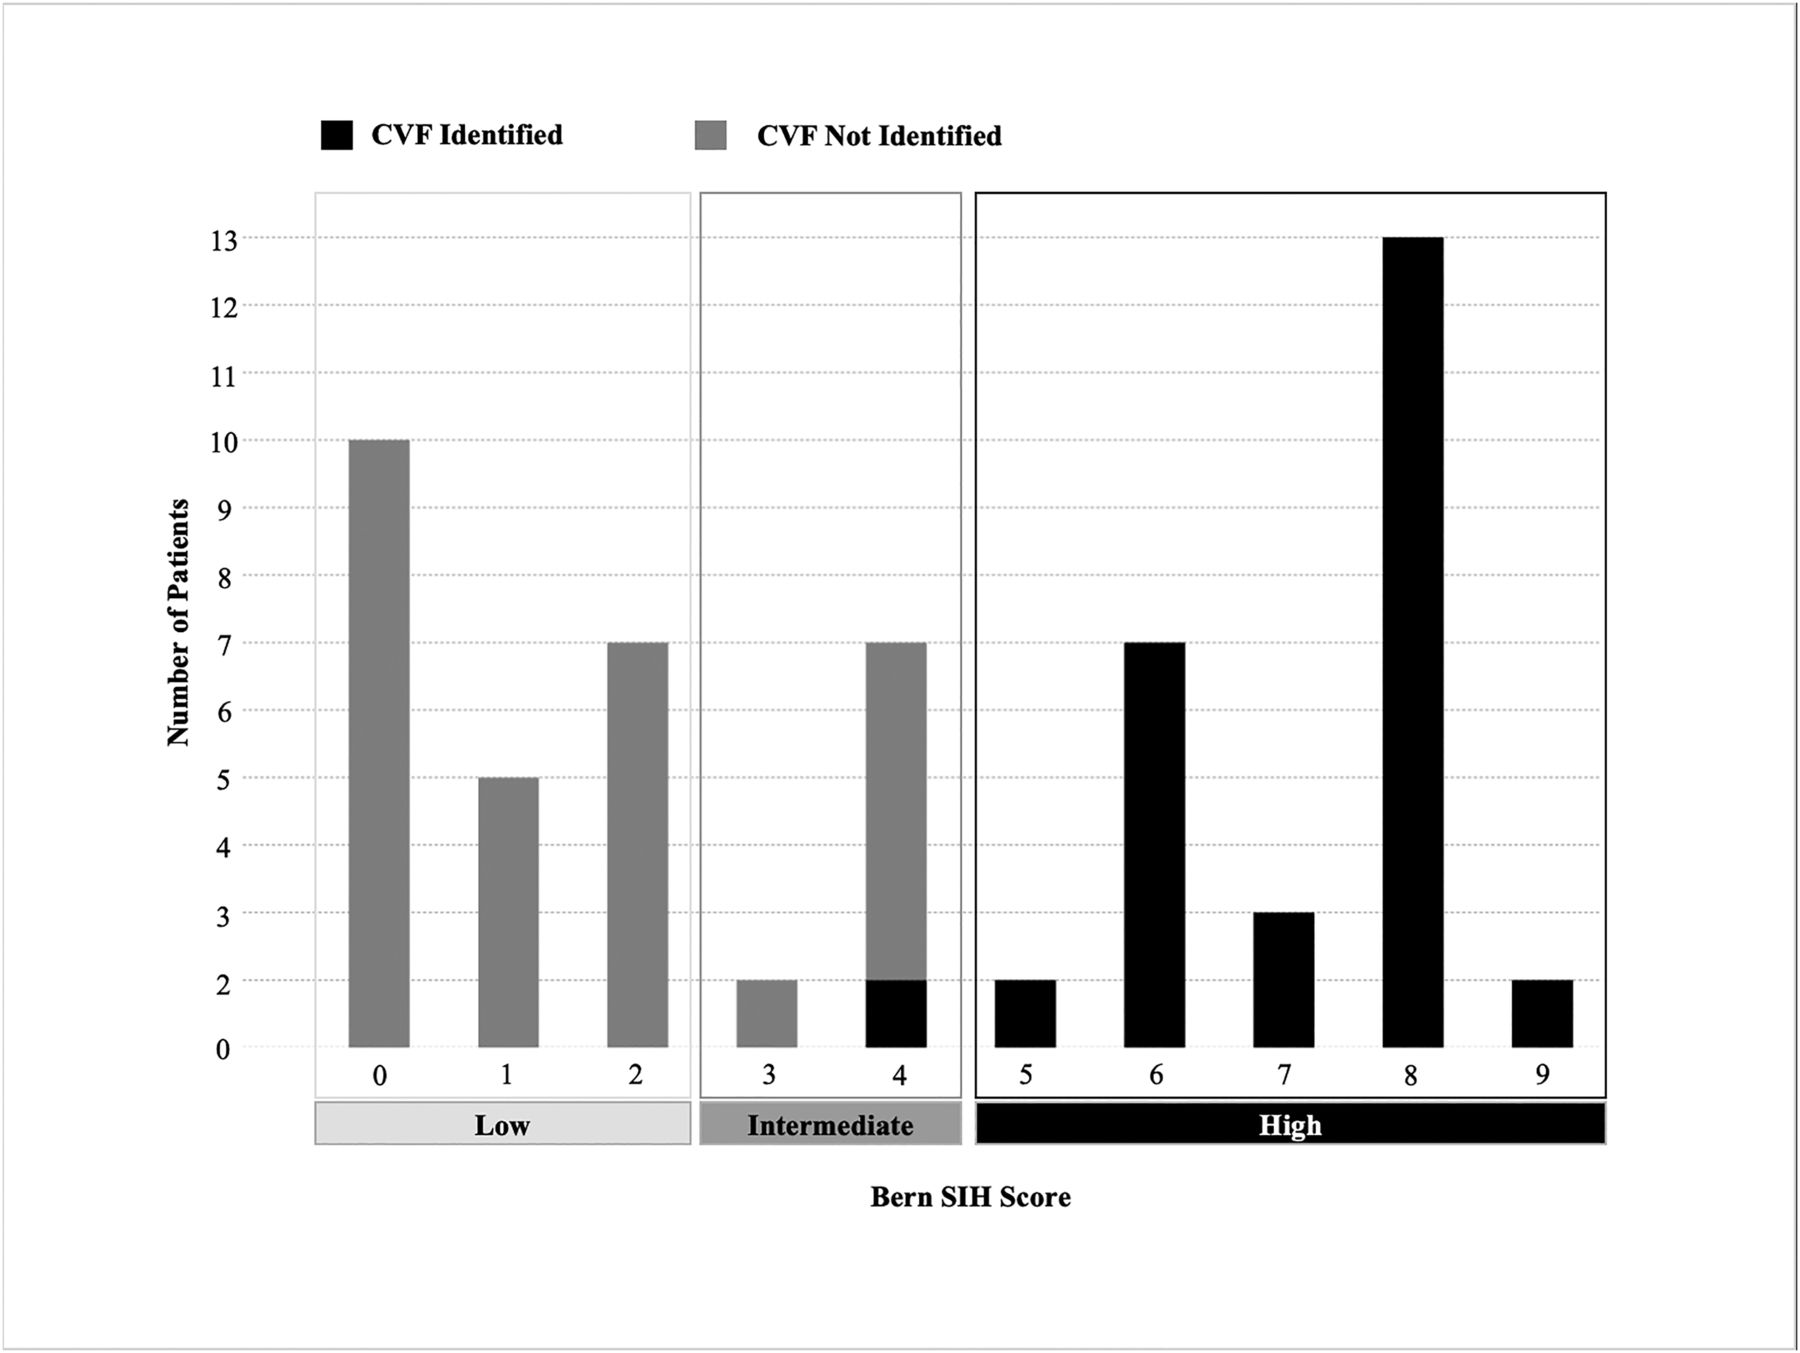
- FIG 3.
Bar chart illustrating the number of patients with CVF identified on dCTM-BT, across Bern SIH scores. The Bern SIH score was calculated based on the brain MRI, categorizing the probability of a spinal CSF leak as low (score of 0–2), intermediate (score of 3–4), or high (score of 5–9).


Tables
Patient and imaging characteristics with and without CSF-venous fistulaa
Total (n = 48) CVF Absent (n = 25) CVF Present (n = 23) P Value Patient characteristics Age, mean (SD) 54 (12.0) 48 (11.5) 60 (9.7) <.001 Female 37 (77.1) 18 (72.0) 19 (83) .38 Orthostatic/Valsalva headache 35 (72.9) 17 (68) 18 (78) .42 CVF characteristics Right side 16 (70) CVF level T1–T5 4 (17%) T6–T12 18 (78%) L1 1 (4%) MRI brain SIH findings Engorgement of venous sinus 21 (44) 0 (0) 21 (91) <.001 Pachymeningeal enhancement 21 (44) 0 (0) 21 (91) <.001 Suprasellar cistern effacement 26 (54) 7 (28) 19 (83) <.001 Subdural fluid collection 1 (2) 0 (0) 1 (4.3) .48 Prepontine cistern effacement 35 (73) 13 (52) 22 (96) <.001 Decreased mamillopontine distance 33 (69) 12 (48) 21 (91) .001 Bern SIH Score 4 (1–8) 1 (0–3) 8 (6–8) <.001 Bern SIH score category Low 19 (40) 19 (76) 0 (0) Intermediate 7 (15) 6 (24) 1 (4) High 22 (46) 0 (0) 22 (96) ↵a For the categoric variables, the data are presented as n (%) and are compared between groups via χ2 or Fisher exact tests. For the continuous variables, the age is reported as a mean (SD) and is compared between groups via an independent t test, and the other continuous variables are reported as a median (IQR) and are compared between groups via a Mann-Whitney U test. A P value of <.05 was considered to be indicative of a statistically significant result and is reported in bold.


Jump to section
Related Articles
Cited By...
- No citing articles found.