
Abstract
BACKGROUND AND PURPOSE: CSF-venous fistula can be diagnosed with dynamic decubitus CT myelography. This study aimed to analyze the temporal characteristics of CSF-venous fistula visualization on multiphase decubitus CT myelography.
MATERIALS AND METHODS: A retrospective, multisite study was conducted on patients diagnosed with CSF-venous fistula at 2 institutions between June 2017 and February 2023. Both institutions perform decubitus CT myelography with imaging immediately following injection and usually with at least 1 delayed scan. The conspicuity of CSF-venous fistula was assessed on each phase of imaging.
RESULTS: Forty-eight patients with CSF-venous fistula were analyzed. CSF-venous fistulas were better visualized on the early pass in 25/48 cases (52.1%), the delayed pass in 6/48 cases (12.5%) and were seen equally on both passes in 15/48 cases (31.3%). Of 25 cases in which the CSF-venous fistula was better visualized on the early pass, 21/25 (84%) fistulas were still at least partially visible on a delayed pass. Of 6 cases in which the CSF-venous fistula was better visualized on a delayed pass, 4/6 (67%) were partially visible on the earlier pass. Six of 48 (12.5%) CSF-venous fistulas were visible only on a single pass. Of these, 4/6 (66.7%) were seen only on the first pass, and 2/6 (33.3%) were seen only on a delayed pass. One fistula was found with one pass only, and one fistula was discovered upon contralateral decubitus imaging without a dedicated second injection.
CONCLUSIONS: A dynamic decubitus CT myelography imaging protocol that includes an early and delayed phase, likely increases the sensitivity for CSF-venous fistula detection. Further studies are needed to ascertain the optimal timing and technique for CSF-venous fistula visualization on dynamic decubitus CT myelography and its impact on patient outcomes.
ABBREVIATIONS:
- CVF
- CSF-venous fistula
- dCTM
- dynamic decubitus CT myelography
- DSM
- digital subtraction myelography
- SIH
- spontaneous intracranial hypotension
Spontaneous intracranial hypotension (SIH) is a neurologic syndrome characterized predominantly by a postural headache, which results from a reduction in CSF volume.1 The 3 primary causes of spontaneous CSF leaks are dural tears, ruptured meningeal diverticula, and CSF-venous fistula (CVF).1 The latter has garnered considerable attention recently as a treatable cause of SIH and now represents ≥25% of cases referred to academic medical centers.2 CVF refers to a direct communication between the spinal subarachnoid space and a paraspinal vein, which results in the loss of CSF volume.3 CVFs were first discovered and described on digital subtraction myelography (DSM), followed shortly by both dynamic fluoroscopy without digital subtraction and dynamic decubitus CT myelography (dCTM).3⇓-5 DSM benefits from excellent temporal resolution but has a limited FOV and superimposition of artifacts, often requiring general anesthesia for breath-holding to minimize lung motion artifact, while dCTM benefits from a whole-spine FOV and lacks superimposition of artifacts but often requires multiple phases to increase the temporal resolution and is associated with higher radiation doses.6,7 Which procedure is performed at a given institution generally depends on resource availability and technical expertise.
Recent studies have demonstrated that certain technical aspects of dCTM can increase detection of CVFs, including decubitus positioning, pressure augmentation, resisted inspiration, and rapid imaging after contrast administration.5,8⇓-10 A recent study by Mark et al11 investigated the temporal characteristics of CVFs using DSM. However, similar data have not been published regarding the optimal timing to detect CVF on dCTM. The purpose of this retrospective multi-institution cohort study was to analyze the temporal features of CVF visualization on dCTM.
MATERIALS AND METHODS
Study Design
This was a retrospective, cross-sectional, multisite study of patients diagnosed with CVF at the University of California, San Francisco, and the University of Colorado School of Medicine. The study was approved by the institutional review board of each institution.
Patient Selection
All patients who underwent dCTM for suspected CVF between June 2017 and February 2023 at the University of California, San Francisco, or the University of Colorado School of Medicine were queried, and those studies that positively identified a CVF were included in the analysis. If >1 dCTM was performed for a patient, the study that first identified the fistula was included.
Dynamic Myelography Technique
Both institutions follow a similar procedural technique, which has been previously described.6 Briefly, all patients undergo lumbar puncture directly on the CT table. The puncture is performed between the L2 and S1 levels depending on patient anatomy using a 22- to 25-ga Quincke or Whitacre spinal needle (Medline Industries). Spinal opening pressure is measured using a digital manometer (Compass; Mirador Biomedical), and as long as pressure is either within the normal range or low, 5-mL aliquots of sterile saline are infused intrathecally and pressure remeasured incrementally until the pressure reaches approximately 20–25 cm H2O. Subsequently, 10 mL of preservative-free 300-osmolar iodinated contrast material is infused, the needle is then removed, and a HoverMatt Air Transfer System (HoverTech International) is inflated for approximately 10 seconds to facilitate the cephalad movement of contrast. After deflation, 2–4 whole-spine acquisitions, or passes, are performed in rapid succession. In some cases, if imaging findings are equivocal for a CVF and clinical suspicion is high, delayed imaging up to 5 minutes is performed. In most cases, imaging is begun with the patients in the right lateral decubitus position, followed by delayed imaging with the patient in the left lateral decubitus position without a repeat injection.12 If the findings of that initial study are negative, a dedicated contralateral dCTM is frequently performed in a different session.5 Imaging is performed using a multidetector row CT scanner (GoldSear Discovery CT750 HD, GE Healthcare, or Somatom Definition AS, Siemens) with the following scan parameters: detector configuration, 32 × 0.625; helical scan mode; rotation time, 800 ms; spiral pitch factor, 1.375; tube voltage, 140 kV(peak); automatic exposure control on; tube current, 300–800 mA; and section thickness, 0.625 mm.
Variables Studied
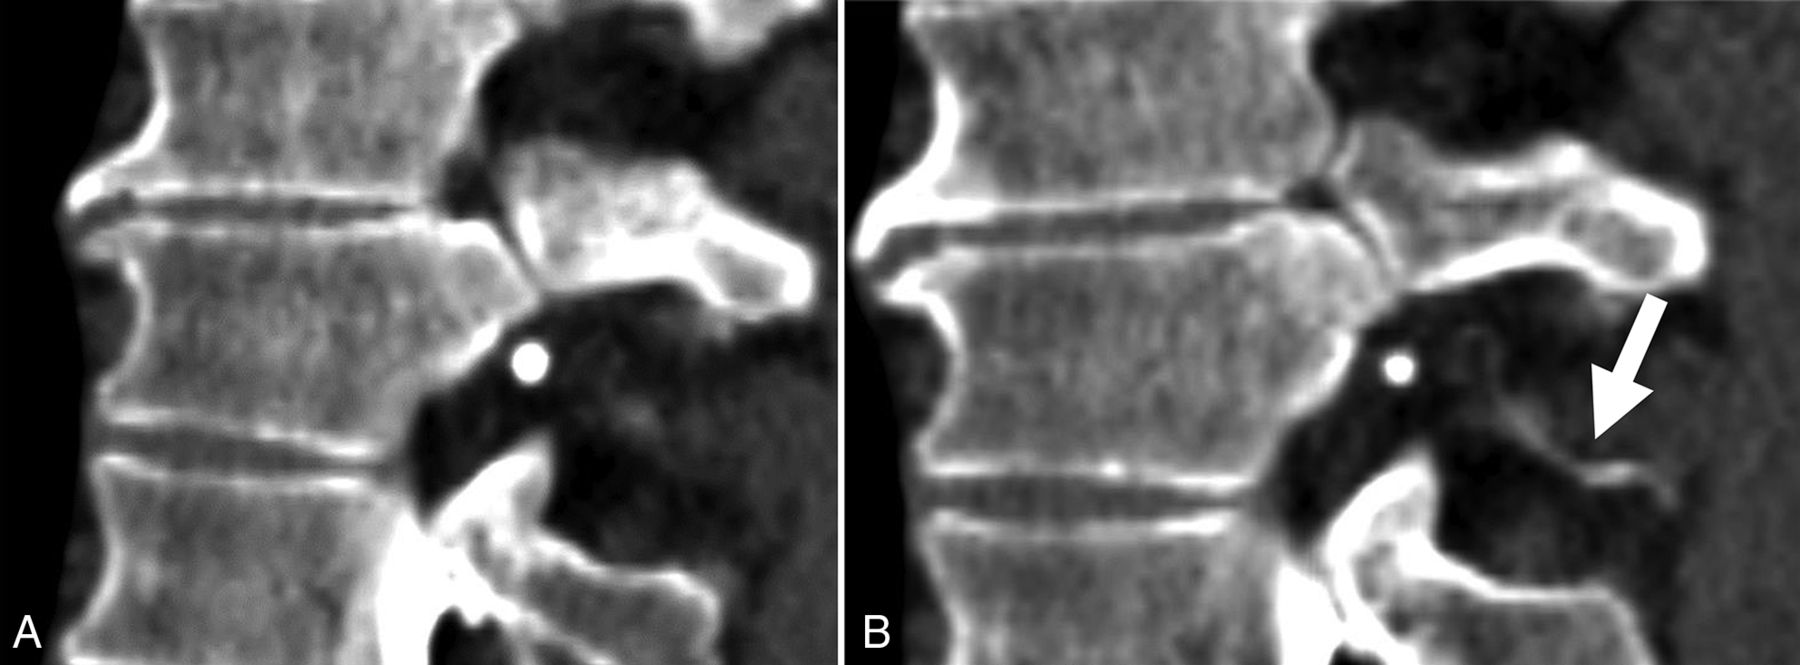
For all patients, all available imaging, including diagnostic MR imaging examinations of the brain (with and without contrast) as well as noncontrast total-spine MR imaging was reviewed at each institution. The spinal level and laterality of each CVF were recorded, as well as the number of phases performed (within a single decubitus examination) and on which phase the CVF was optimally visualized. Optimal visualization was defined as a quantitative binary variable and determined by a board-certified subspeciality-trained neuroradiologist. In general, optimal visualization was designated if attenuation levels of the opacified paraspinal vein were similar to those of intrathecal contrast, with no more than a 20% difference in Hounsfield units. If the fistula could be partially-but-suboptimally visualized on a separate phase within the same decubitus examination, this result was also recorded. Figures 1 and 2 demonstrate examples of phase-specific CVF visualization, and Fig 3 demonstrates a CVF equally visible on both phases. The time between passes was calculated as the difference between the time stamps at the level of the CVF for a given phase.

CVF most conspicuous on the early phase of imaging (A, arrow), which dissipates on the immediately acquired delayed phase (B).

Early (A) and late (B) phases of dCTM, demonstrating a CVF, which is more apparent on the delayed phase (B, arrow).

CVFs (arrows in A and B) equally well seen on early (A) and delayed (B) phases. C, Volume-rendered CT image shows the CVF.
If measured, the CSF opening pressure was recorded for all included patients. Binary variables such as the use of resisted inspiration and saline augmentation of CSF pressure were recorded. A Bern Score was assigned according to imaging features on each patient's preprocedural MR imaging brain examination.13
RESULTS
Patient Characteristics
The cohort consisted of 48 patients diagnosed with CVF, composed of 19 men (39.6%) and 29 women (60.4%) with a mean age of 58.7 (SD, 11.9) years. Twenty-one patients were from the University of Colorado, and 27 were from the University of California, San Francisco.
Imaging Characteristics of CVFs
The Table outlines patient and CVF characteristics. All except 3 CVFs were in the thoracic spine. One originated in the cervical spine, 1 originated in the lumbar spine, and 1 originated in the sacrum. CVFs were more common on the right side (34/48, 70.8%) compared with the left side (14/48, 29.2%). In this cohort, no patients had >1 CVF. For 39/48 patients (81.2%), saline pressure augmentation was performed. In 9/48 (18.8%) patients, resisted inspiration was used.
Patient and CVF characteristics
The number of full spine passes performed ranged from 1 to 4, with most of the cases (26/48, 57.8%) including 3 passes. The mean radiation dose per pass was 12.0 mGy (volume CT dose index) and 803.3 mGy × cm (dose-length product). The mean time between the first and second pass (calculated as the difference between the time stamps at the image displaying the fistula and the same location on the subsequent pass) was 37.7 (SD, 57.51) seconds.
The fistula origin was better visualized on the first pass of imaging in 25/48 cases (52.1%), better visualized on a delayed phase of imaging in 6/48 cases (12.5%), and equally seen on both the first and subsequent phases in 15/48 cases (31.3%). Of 25 cases in which the fistula was better visualized on the first pass, 21/25 (84.0%) fistulas were still at least partially visible on a subsequent delayed pass. Of 6 cases in which the fistula was better visualized on a delayed pass, 4/6 (67%) were partially visible on the earlier pass. Six of 48 (12.5%) fistulas were visible only on a single pass of imaging. Of these, 4/6 (66.7%) were seen only on the first pass, and 2/6 (33.3%) were seen only on a delayed pass. One fistula was found with one pass only, and one fistula was discovered upon contralateral decubitus imaging without a dedicated second injection.
Of the CVFs seen better on the early pass, 18/25 (72%) were on the right and 7/25 (28%) were on the left. Of the CVFs better seen on the delayed pass, 5/6 (83%) were on the right and 1/6 (17%) was on the left.
Clinical and Imaging Findings
Spinal opening pressure was measured in all except 1 patient (47/48). The opening CSF pressure ranged from 4 to 26 cm H2O, with mean and median values of 12.2 and 11.0 cm H2O, respectively. Only 2/48 (4.2%) patients had opening pressure <6 cm H2O.
Preprocedural brain MR imaging was available in 44/48 (91.7%) patients. Pachymeningeal enhancement was observed in 34 patients (77.2%); engorgement of the venous sinus in 32 patients (72.7%); effacement of the suprasellar cistern in 29 patients (65.9%); effacement of prepontine cistern in 30 patients (68.2%); and narrowing of the mamillopontine distance in 30 patients (68.2%). The Bern Score ranged from 0 to 9, with a mean value of 6.0. Four of 44 (9%) patients had a Bern Score of ≤2 (low probability), 5/44 (11.4%) patients had a Bern Score of 3 or 4 (intermediate probability), and 35/44 (79.5%) patients had a Bern Score of ≥5 (high probability). One patient had a Bern Score of 0.
DISCUSSION
This retrospective multi-institutional study found that while most CVFs are visible on first or subsequent phases of dCTM, approximately 1 in 8 were only visible on either the early or delayed phase, but not both. This finding suggests that acquiring >1 phase of imaging increases the sensitivity of dCTM by increasing its temporal resolution. We found that most CVFs filled early, with better visualization in more than one-half of the cases (52.1%) on early-phase imaging. A plausible hypothesis for this finding is that CVF filling is likely a function of the pressure gradient between the subarachnoid space and the surrounding epidural venous plexus, as well as the density of subarachnoid contrast material, both of which are at their peak at the beginning of the procedure. We estimate that the time between injection and scan initiation is approximately 20–30 seconds, including inflation of the HoverMatt. Additionally, in our cohort, the average time between successive scans was 37.7 seconds. This observation aligns with the findings of Mark et al,11 who reported an average time to CVF filling of approximately 9 seconds and average duration of filling of 48.1 seconds using DSM. Given this time to washout, by the second run on CT, many CVFs dissipate. Thus, we advocate for imaging to be performed shortly after contrast injection, with acquisition of at least 1 additional phase to maximize the chances of CVF detection.
Our study also found that CVFs were more common on the right side, which is consistent with prior literature.12 This observation may be related to anatomic or physiologic differences between the normal presence of arachnoid villi or paraspinal veins on the right versus the left, though the exact reasons remain to be elucidated.14
Two of 48 (4.2%) patients in our cohort had an opening pressure of <6 cm H2O, the lower limit used by the International Classification of Headache Disorders guidelines for the diagnosis of headache attributable to low CSF pressure.15 This finding is in keeping with several recent publications demonstrating that low opening pressure is uncommon in patients with SIH.16,17
Finally, in this study, most patients with CVFs had high Bern Scores, a measure of the probability of localizing a CSF leak or CVF on the basis of brain MR imaging features. Specifically, 79.5% of patients had scores of ≥5, and 20.5% of patients had scores of ≤4. Given that our cohort consisted entirely of individuals with confirmed CVFs, the generalizability of this observation to broader populations may be limited due to selection bias.
This study has important limitations. First, resisted inspiration, a technique known to increase the detection of CVF, was performed in only about 19% of the patients because several patients were evaluated before this technique was published, raising the question of whether the use of resisted inspiration could have resulted in improved visualization or increased detection rates of CVFs. Another limitation is related to the inability to determine whether the fistulas would have refilled if the patients were left in the decubitus position and rescanned again after a longer delay. This information could potentially guide the optimal timing and frequency of imaging to maximize CVF detection.
CONCLUSIONS
This study highlights the importance of an imaging protocol in the detection of CVFs that includes early and delayed phases of imaging. Future studies should further investigate the optimal timing and technique for CVF visualization on dCTM and explore the implications of these findings for patient outcomes and clinical management.
Footnotes
Disclosure forms provided by the authors are available with the full text and PDF of this article at www.ajnr.org.
References
- Received August 17, 2023.
- Accepted after revision October 6, 2023.
- © 2024 by American Journal of Neuroradiology


