
Abstract
BACKGROUND AND PURPOSE: Automatic brain parcellation is typically performed on dedicated MR imaging sequences, which require valuable examination time. In this study, a 3D MR imaging quantification sequence to retrieve R1 and R2 relaxation rates and proton density maps was used to synthesize a T1-weighted image stack for brain volume measurement, thereby combining image data for multiple purposes. The repeatability and reproducibility of using the conventional and synthetic input data were evaluated.
MATERIALS AND METHODS: Twelve subjects with a mean age of 54 years were scanned twice at 1.5T and 3T with 3D-QALAS and a conventionally acquired T1-weighted sequence. Using SyMRI, we converted the R1, R2, and proton density maps into synthetic T1-weighted images. Both the conventional T1-weighted and the synthetic 3D-T1-weighted inversion recovery images were processed for brain parcellation by NeuroQuant. Bland-Altman statistics were used to correlate the volumes of 12 brain structures. The coefficient of variation was used to evaluate the repeatability.
RESULTS: A high correlation with medians of 0.97 for 1.5T and 0.92 for 3T was found. A high repeatability was shown with a median coefficient of variation of 1.2% for both T1-weighted and synthetic 3D-T1-weighted inversion recovery at 1.5T, and 1.5% for T1-weighted imaging and 4.4% for synthetic 3D-T1-weighted inversion recovery at 3T. However, significant biases were observed between the methods and field strengths.
CONCLUSIONS: It is possible to perform MR imaging quantification of R1, R2, and proton density maps to synthesize a 3D-T1-weighted image stack, which can be used for automatic brain parcellation. Synthetic parameter settings should be reinvestigated to reduce the observed bias.
ABBREVIATIONS:
- 3D-QALAS
- 3D-quantification using an interleaved Look-Locker acquisition sequence with T2 preparation pulse
- BPV
- brain parenchymal volume
- CoV
- coefficient of variation
- ICV
- intracranial volume
- NQ
- NeuroQuant
- PD
- proton density
- syT1WI
- synthetic 3D-T1-weighted inversion recovery
Various postprocessing programs can be used to quantify specific features of the brain, such as the size of structures or lobes, or tissue characteristics of the entire brain. Unfortunately, each program typically is associated with its own dedicated MR imaging sequence required for optimal performance. To minimize the examination time burden, we aimed to investigate whether quantitative MR imaging data can be used to synthesize the necessary T1-weighted images for automatic brain parcellation. A 3D quantification sequence, called 3D-QALAS, was recently adapted from cardiac1,2 to brain applications3⇓⇓-6 and can measure the R1 and R2 relaxation rates and proton density (PD) at high resolution in a relatively short scan time. By means of these parameter maps, global brain volumes and local tissue characteristics can be measured. Brain parcellation programs such as NeuroQuant (CorTech Labs),7⇓⇓⇓⇓-12 however, cannot work with these maps directly but require a 3D-T1-weighted image stack as input. Such images can be generated from the R1, R2, and PD maps using synthetic MR imaging.13⇓-15 It may, therefore, be possible to collect both the quantitative maps and the necessary input for brain parcellation in a single sequence.
Aims of this study 1) were to compare volume estimation using either a conventionally acquired T1-weighted sequence or a synthesized T1-weighted image stack for NeuroQuant, 2) to compare the volume estimation using NeuroQuant and SyMRI (SyntheticMR), 3) and to investigate the repeatability and reproducibility of volume estimation of NeuroQuant and SyMRI at 1.5T and 3T.
MATERIALS AND METHODS
Subjects
Twelve volunteers, 6 women and 6 men, were prospectively included in the study. Their age was 54 (SD, 14) years, ranging from 29 to 70 years of age (median, 53 years). No medical information was provided other than that they were self-reported healthy, and no subject was excluded on the basis of image appearance, motion artifacts, or potential other issues. The regional ethics review board approved the study (Linköping University, Dnr 2015 13–31). Informed written consent was obtained from all volunteers.
MR Imaging Acquisition Methods
For the NeuroQuant sequence, the recommended settings for the 3D-T1-weighted inversion recovery were used. At 1.5T, a sagittal acquisition was acquired with an FOV = 230 mm and matrix = 192, providing 1.2-mm isotropic resolution, reconstructed to 1.0-mm resolution (matrix = 240), with a coverage of 160 slices. TE was 4.0 ms, TR was 8.6 ms, and the flip angle was 8°. The shot interval was 2300 ms (ETL 153), and the inversion prepulse delay was 1000 ms. For 3T, the parameters were identical, except that the shot interval was 2500 ms and the flip angle was 9° instead. The scan time was 6 minutes 10 seconds for both field strengths.
3D-QALAS consists of 5 segmented 3D gradient-echo acquisitions that are acquired in parallel. The TE was 2.3 ms, and the TR was 5.0 ms, repeated 150 times, resulting in an acquisition time of 750 ms for each acquisition 1–5. The delay time between the acquisitions was set to 150 ms, making the total cycle time 5 × 900 ms = 4.5 seconds. The flip angle was 4°. Before the first acquisition, an R2-sensitizing phase was applied, consisting of a hard 90° radiofrequency pulse, 4 adiabatic 180° refocusing pulses, and a hard −90 pulse (TE = 100 ms). Before the second acquisition, an R1 sensitizing phase was applied, consisting of an adiabatic inversion pulse. The sagittal acquisition orientation, the FOV of 230 mm, the acquisition matrix of 192, the reconstruction matrix of 240, and the number of slices of 160 were set identical to those of the conventional acquisition. The scan time was matched to 6 minutes 10 seconds using a sensitivity encoding factor of 2.2.
The scanners were a 1.5T dStream Achieva and a 3T Ingenia (Philips Healthcare), with a patched software, Release 5.3.0. All subjects were scanned twice and removed from the scanner between the 2 examinations, at both field strengths, resulting in 8 data sets per patient, with a total of 96 scans.
Processing
Processing of the 3D-QALAS data was performed by a prototype version (18Q3) of SyMRI. Processing time was 20 seconds on a regular laptop, generating R1, R2, and PD maps to create the synthetic 3D-T1-weighted inversion recovery (syT1WI) images with the recommended settings from NeuroQuant (shot interval/delay time = 2300/1000 ms and 2500/100 ms at 1.5T and 3T, respectively). The intracranial volume, brain parenchymal volume (BPV), white matter volume, gray matter volume, and CSF volume were automatically calculated by SyMRI. At the time of volume analysis, a newer version of the prototype was released, which was used instead (22Q2).
The 96 T1-weighted and syT1WI image stacks were uploaded to NeuroQuant, and a PDF report was obtained in about 15 minutes per data set. The report provided 13 items: forebrain parenchyma, cortical gray matter, superior lateral ventricle, inferior lateral ventricle, hippocampus, amygdala, caudate, putamen, pallidum, thalamus, cerebellum, intracranial volume, and BPV. The BPV was defined as the sum of the forebrain parenchyma, cortical gray matter, hippocampus, amygdala, caudate, putamen, pallidum, thalamus, and cerebellum. Gray matter, white matter, and CSF volumes were not specified as separate items, and for this study, the gray matter volume was calculated as the sum of cortical gray matter, hippocampus, amygdala, caudate, putamen, pallidum, thalamus, and half the volume of the cerebellum. White matter volume was calculated as BPV minus gray matter volume; and CSF volume, as intracranial volume (ICV) minus BPV.
Statistics
In this study, repeatability was defined as the investigation of multiple measurements using the same method at the same field strength. Repeatability was expressed as a coefficient of variation (CoV), the ratio of the SD, and the mean of the measurements. Reproducibility was defined as the investigation of multiple measurements using different measurements or on different field strengths. The reproducibility was investigated using Bland-Altman statistics (mean, bias, SD) and the correlation coefficient r. Differences in reproducibility were evaluated using a paired t test, in which P < .05 was considered significant.
RESULTS
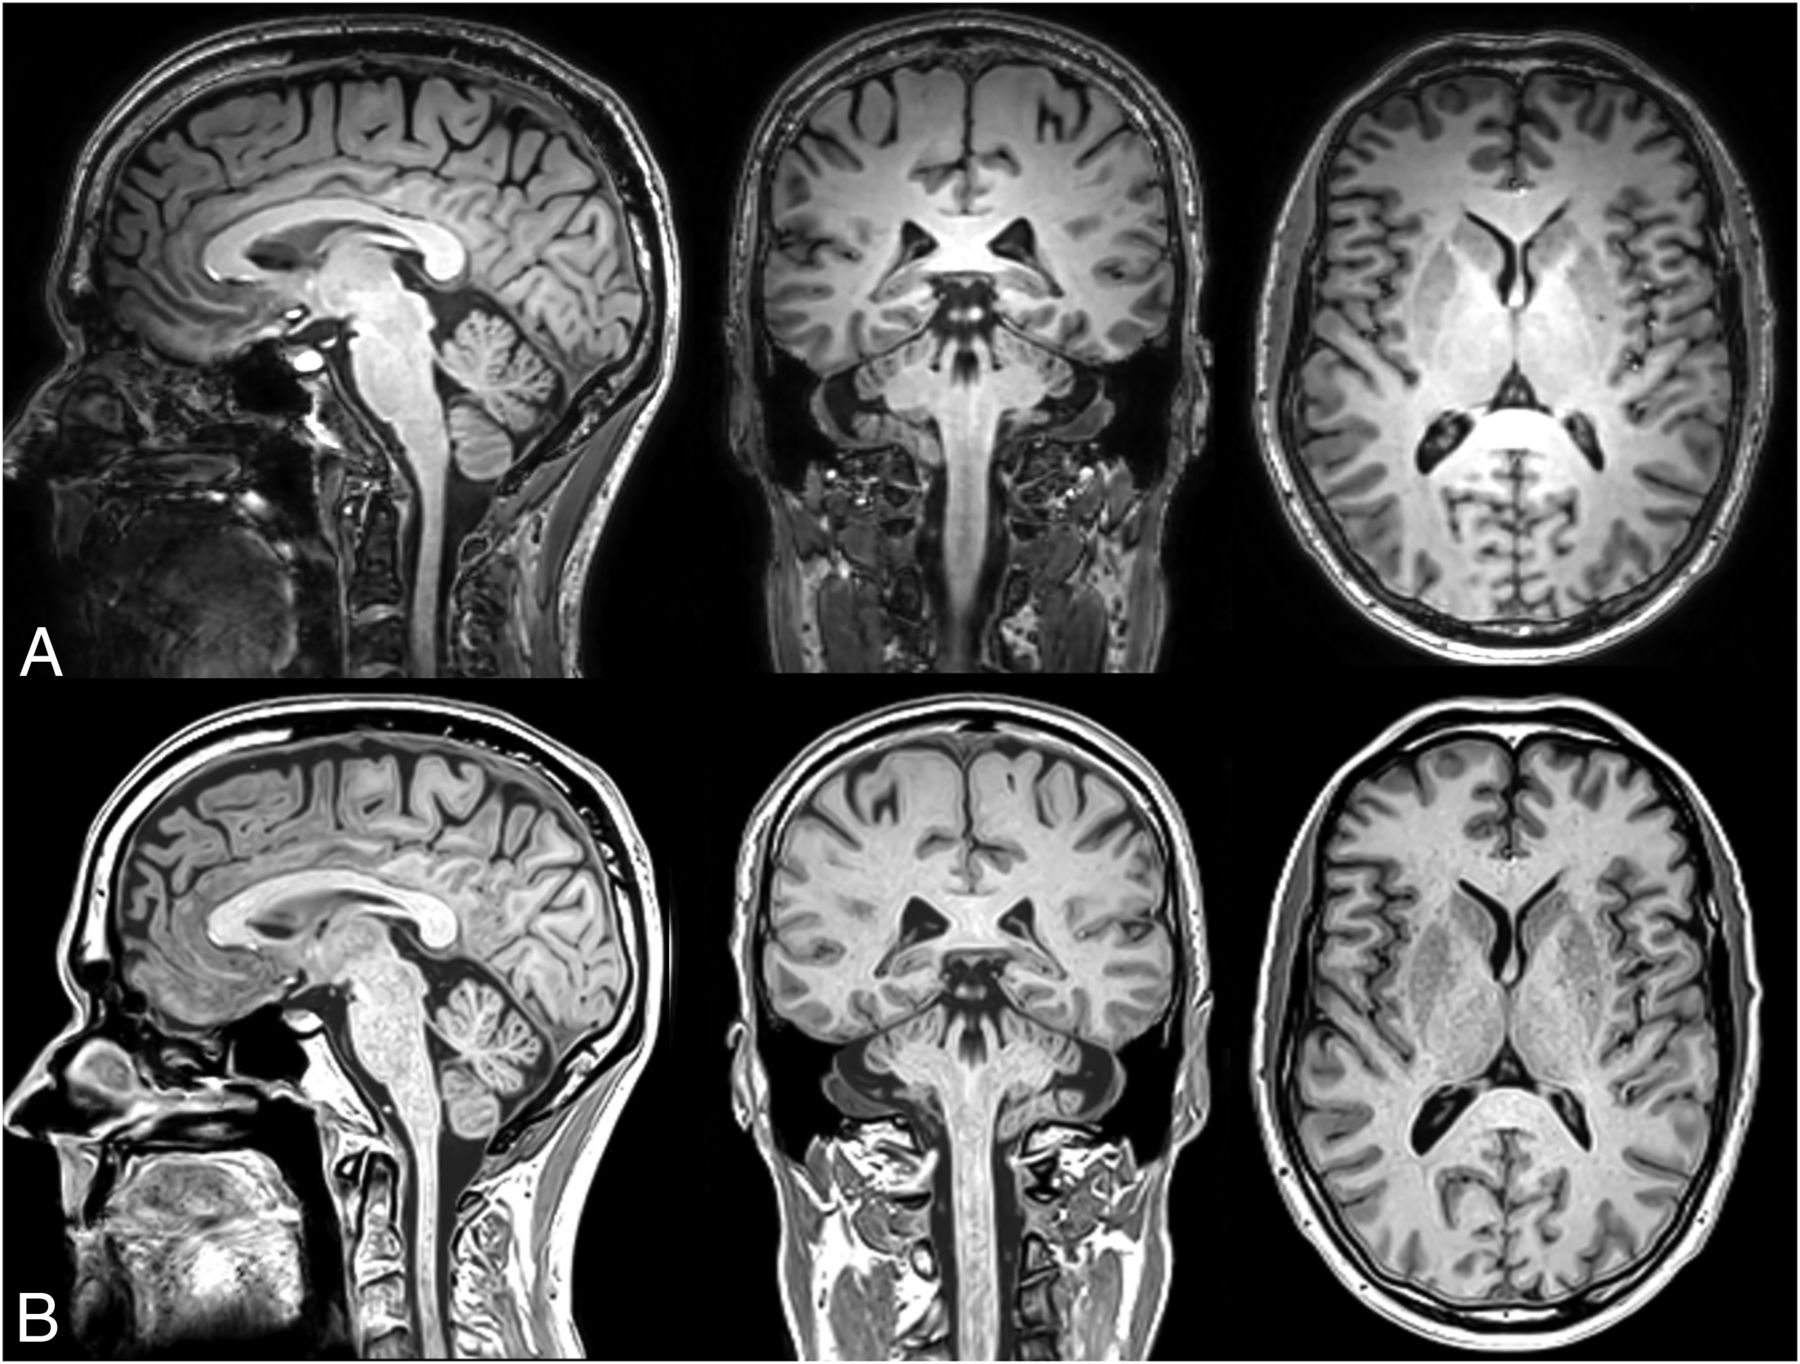
The typical appearance of the conventional and synthetic 3D-T1-weighted images is shown in Fig 1 in sagittal, coronal, and axial reformats. Visual inspection shows a very similar white matter–gray matter contrast, but a somewhat sharper appearance in the synthetic images. Of the 96 data sets uploaded to NeuroQuant, 9 failed to provide segmentation results (9.4%), 5 were based on conventional T1-weighted images (2 at 1.5T and 3 at 3T), and 4 were based on syT1WI (all at 3T). All SyMRI volumes produced a segmentation result.

Representative example of a sagittal, coronal, and axial reformat of the 3D-T1-weighted image stack at 1.2-mm isotropic resolution at a scan time of 6 minutes 10 seconds. The subject is a man, 54 years of age. Upper row (A), conventional T1-weighted NeuroQuant sequence. Lower row (B), synthetic T1-weighted image, created from the R1, R2, and PD maps (SyMRI 22Q2).
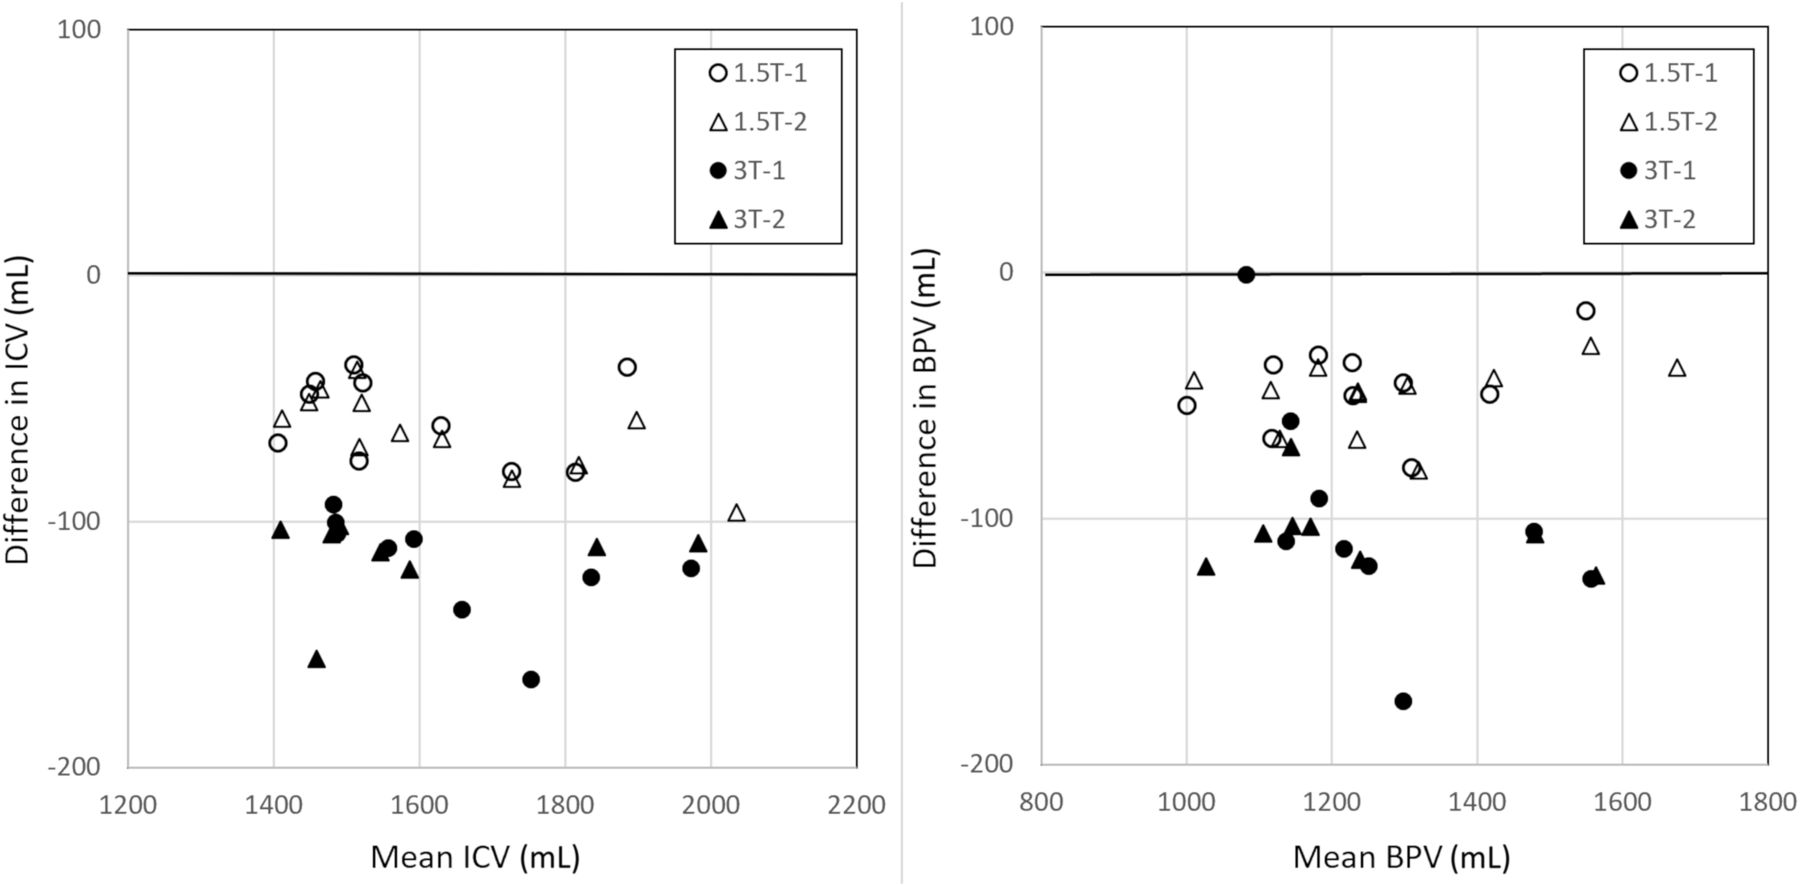
As shown in Table 1, processing with conventional and synthetic T1-weighted images resulted in a consistently smaller ICV for the syT1WI images, on average, 61 mL for 1.5T and 116 mL for 3T (3.8% and 7.2%, respectively) and a smaller BPV (−49 mL and −103 mL, respectively). A Bland-Altman plot for ICV and BPV is shown in Fig 2. The smaller volumes for the syT1WI images are also observed in all brain structures. For most structures, however, the bias was not significant due to the relatively large variation of the segmentation results with respect to their mean volume. Both bias and SD were generally larger at 3T than at 1.5T. A high correlation was found for all the brain structures, with a median of r = 0.97 for 1.5T and r = 0.92 for 3T.
Reproducibility of volume estimation of various brain structures using NeuroQuant with either a conventional or synthetic T1-weighted image stack as inputa

Bland-Atman plot with NQ segmentation results for ICV and BPV, in which T1-weighted and syT1WI were pooled as input data to focus on reproducibility at 2 different field strengths, irrespective of acquisition type. Measurements 1 (circles) and 2 (triangles) were plotted separately for both field strengths. There is a substantial bias, with lower ICV and BPV when using syT1WI. The bias is larger at 3T then at 1.5T.
In Table 2, the repeatability of the segmentation volumes is shown for measurements 1 and 2 at the same field strengths. A small CoV was observed for all brain structures, with a median CoV of 1.2% for both T1-weighted and syT1WI at 1.5T and 1.5% for T1-weighted and 4.4% for syT1WI at 3T. A large CoV, exceeding 10%, was found for the pallidum using T1-weighted imaging at 1.5T and for the lateral ventricles using syT1WI at 3T.
Repeatability of volume estimation of various brain structures using NeuroQuant with either a conventional or synthetic T1-weighted image stack as inputa
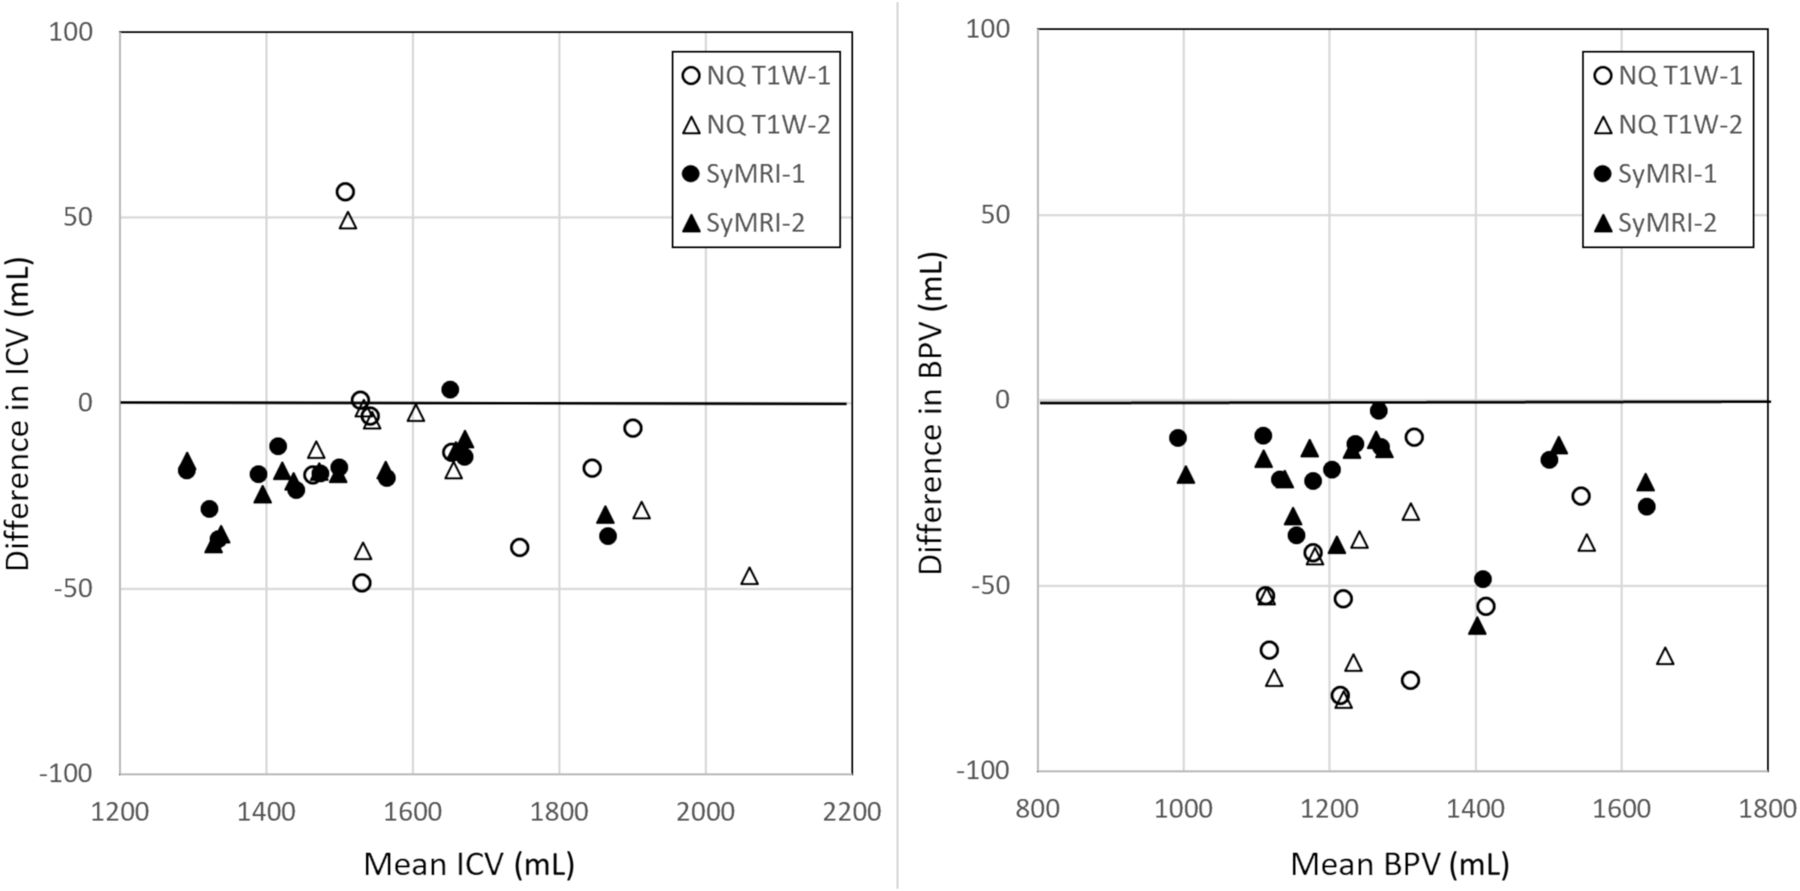
The segmentation results for WM, GM, CSF, BPV, and ICV were compared between 1.5T and 3T. In Table 3, the mean, bias, SD, and correlation coefficient are listed for the conventional T1W (NQ), syT1WI, and SyMRI. Significant differences were observed between the field strengths, especially for the syT1WI NQ. The mean bias for syT1WI was 68 mL, while for T1-weighted imaging, it was only 23 mL. The mean SD of the syT1WI, however, was 22 mL, while for T1-weighted imaging, it was 79 mL. For SyMRI, the mean SD was 22 mL. The correlation of the volumes was lowest for the T1-weighted NQ (mean, 0.82) and highest for syT1WI NQ (mean, 0.96) and SyMRI (mean, 0.96). For illustration, the ICV and BPV are shown in a Bland-Altman plot in Fig 3. The repeatability is shown in Table 4, providing low CoV values for both field strengths.

Bland-Atman plot with segmentation results for ICV and BPV in which data from 1.5T and 3T were pooled to focus on the reproducibility for the 2 different acquisition methods, irrespective of field strength NQ T1-weighted imaging and SyMRI. Measurements 1 (circles) and 2 (triangles) are plotted separately for both methods. There is a bias, with lower ICV and BPV when using 3T. The bias is largest for the BPV using NQ T1-weighted imaging.
Reproducibility of volume estimation of WM, GM, CSF, BPV, and ICV using NeuroQuant and SyMRI, between 1.5T and 3Ta
Repeatability of the volume estimation of WM, GM, CSF, BPV, and ICV using NeuroQuant and SyMRIa
DISCUSSION
Our study showed that it is possible to generate synthetic syT1WIs on the basis of quantification maps of R1, R2, and PD, which are readily processed by NeuroQuant as if they were conventionally acquired T1-weighted images. Four data sets of the 48 with syT1WI data failed to provide a result, though that may be normal behavior in view of the 5 of the 48 conventional T1-weighted image stacks that also failed. Most of the failed stacks were acquired at 3T, but the numbers were too small to be decisive on whether field strength played a role.
A significant bias in the segmentation results between T1-weighted imaging and syT1WI was observed, in combination with a low SD and a high correlation coefficient between them (Table 1). A similar observation was made when comparing the methods on both field strengths (Table 3). These results suggest a field strength–dependent systematic error rather than a random error. The likely reason is the slightly different contrast in the conventional T1-weighted image and syT1WI images. Most voxels in the data sets experience some level of partial volume effect of gray matter, white matter, and CSF, and a slight contrast change could lead to substantial volume changes. To illustrate this point, we placed ROIs in the frontal cortical gray matter and frontal white matter in the conventional and synthetic T1-weighted images, providing estimates of the observed local signal intensity. If contrast is defined as the difference in the signals divided by the mean [2 × (S1–S2) / (S1 + S2)], the conventional T1-weighted image showed a gray matter/white matter contrast of 0.414, and for the synthetic gray matter/white matter contrast, it was 0.385 at 1.5T. The TE, TR, and TI of the synthetic images can be manipulated to alter the contrast. On manipulation, the gray matter/white matter contrast changed −0.38%/ms for TE, 0.025%/ms for TR, and −0.113%/ms for TI.
It can be speculated that identical contrasts could be obtained with either a 116-ms longer TR or a 3.1-ms shorter TI or a combination thereof. At 3T, the conventional T1-weighted imaging had a gray matter/white matter contrast of 0.560, and the synthetic gray matter/white matter contrast was 0.511. The synthetic contrast showed a change of gray matter/white matter contrast of −0.24%/ms for TE, 0.030%/ms for TR, and −0.171%/ms for TI. Identical contrast could be obtained with either a 165-ms longer TR or a 11.3-ms shorter TI or a combination thereof. This illustration shows that especially the inversion delay time has a very sensitive effect on contrast, and the difference in the signal intensity of gray matter and white matter will alter substantially on a minor change of TI on the order of 10–20 ms. Noise (or SNR) should have a random effect on the segmentation procedure and is, therefore, less likely to result in a bias.
In the setup used for the study, the syT1WI processing results showed a higher precision (mean SD, 22 mL versus 79 mL) but a lower accuracy (mean bias, 68 mL versus 23 mL) than T1-weighted imaging. SyMRI showed both high precision (mean SD, 22 mL) and high accuracy (mean bias, 10 mL) between 1.5T and 3T. It may be possible to optimize the chosen scanner settings for the syT1WI to somewhat different values to better match the contrast in the conventional T1-weighted images, thereby reducing the observed bias and obtaining a more similar result in brain parcellation. The level of optimizing must be higher for 3T than for 1.5T. Once the systematic error is reduced, the precision is of the highest importance for clinical use.
The results indicated inferior performance concerning both reproducibility and repeatability at 3T in comparison with 1.5T. On inspection, however, our observed values at 3T may have been dominated by 2 extreme cases of segmentation results. The first case was a woman 70 years of age who at 1.5T had BPVs of 1027 and 1032 mL using T1-weighted imaging, while syT1WI provided 973 and 988 mL, reflective of the average 49-mL bias as seen in Table 1. At 3T, however, 1 case of T1-weighted imaging failed, and the other gave a much higher 1383 mL. For the syT1WI, 1 case also failed, and the other gave a much lower 836 mL. All brain structures were similarly scaled. The second case was a woman 74 years of age, in whom, for example, the superior lateral ventricle had a mean volume of all measurements of 36.5 (SD, 1.1) mL, while 1 measurement provided 23.1 (−12 SD) mL. Measurements were similar for the inferior lateral ventricles, which had 2.08 (SD, 0.15) mL, while one had 1.24 (SD, −5.4) mL.
Combining brain parcellation with R1, R2, and PD maps can provide local characteristics of brain tissue. This result may improve precision diagnosis owing to the objective characterization of both the size and content of each brain structure. Time efficiency to retrieve all the information is important to make the procedure clinically relevant. The studied procedure can reduce the required imaging time to a single acquisition.
A limitation in our study was that the original design dictated that no subject was to be excluded on any grounds such as medical issues or imaging artifacts. The 9 failed NeuroQuant data sets, however, did not provide a result and could, therefore, not be included into the analysis. Omitting 9 pairs could have varying effects for the comparisons. Also, the analysis may be affected by a few extreme cases. The study was not repeated using other scanner settings for syT1WI images to evaluate the effect on bias due to economic reasons. The suggested optimization to reduce the observed bias remains a topic for future work.
CONCLUSIONS
Our study has shown that MR imaging quantification maps of R1 and R2 relaxation and PD can be used to generate a synthetic 3D-T1-weighted image stack that can be used for automatic brain parcellation. A high correlation between the volume results using either conventional or synthetic data and a high repeatability for each method were observed. The exact image parameters to generate the synthetic T1-weighted images must be reinvestigated to reduce the observed bias between the 2 methods.
Footnotes
Disclosure forms provided by the authors are available with the full text and PDF of this article at www.ajnr.org.
References
- Received November 18, 2022.
- Accepted after revision June 14, 2023.
- © 2023 by American Journal of Neuroradiology


Jump to section
Related Articles
Cited By...
- No citing articles found.