
Abstract
BACKGROUND AND PURPOSE: In MS, it is common to acquire brain and spinal cord MR imaging sequences separately to assess the extent of the disease. The goal of this study was to see how replacing the traditional brain T1-weighted images (brain-T1) with an acquisition that included both the brain and the cervical spinal cord (cns-T1) affected brain- and spinal cord–derived measures.
MATERIALS AND METHODS: Thirty-six healthy controls (HC) and 42 patients with MS were included. Of those, 18 HC and 35 patients with MS had baseline and follow-up at 1 year acquired on a 3T magnet. Two 3D T1-weighted images (brain-T1 and cns-T1) were acquired at each time point. Regional cortical thickness and volumes were determined with FastSurfer, and the percentage brain volume change per year was obtained with SIENA. The spinal cord area was estimated with the Spinal Cord Toolbox. Intraclass correlation coefficients (ICC) were calculated to check for consistency of measures obtained from brain-T1 and cns-T1.
RESULTS: Cortical thickness measures showed an ICC >0.75 in 94% of regions in healthy controls and 80% in patients with MS. Estimated regional volumes had an ICC >0.88, and the percentage brain volume change had an ICC >0.79 for both groups. The spinal cord area measures had an ICC of 0.68 in healthy controls and 0.92 in patients with MS.
CONCLUSIONS: Brain measurements obtained from 3D cns-T1 are highly equivalent to those obtained from a brain-T1, suggesting that it could be feasible to replace the brain-T1 with cns-T1.
ABBREVIATIONS:
- cns
- central nervous system
- EDSS
- Expanded Disability Status Scale
- HC
- healthy control
- ICC
- intraclass correlation coefficient
- PBVC
- percentage brain volume change
- SCA
- spinal cord area
- SSIM
- structural similarity index
The pathologic characterization of MS includes focal and diffuse areas of inflammation, demyelination, neuroaxonal loss, and gliosis in the central nervous system (cns). Lesions in the brain and spinal cord are identified with MR imaging, an essential and fundamental technique in the diagnosis, prediction of disease progression, and monitoring and prediction of the response to disease-modifying treatments.1 Actually, brain cortical lesions can be identified from routinely acquired T1-weighted MR imaging in conjunction with FLAIR imaging.2 Lesions in the spinal cord can be outlined with just T1-weighted MR imaging.3 Regarding lesion topography and atrophy quantification, both the brain and spinal cord are assessed separately, requiring the acquisition of 2 images,4 although recent studies have highlighted the relevance of acquiring simultaneous brain and spinal cord MR imaging.5,6 Several attempts have been made to assess the estimation of spinal cord area (SCA) from brain acquisitions, instead of from spinal cord MR imaging, showing that the estimated SCA values differ.7,8 Despite SCAs differing, estimation from brain acquisitions is quite common and has been proposed as an alternative in cases in which spinal cord MR imaging has not been acquired, which is a common situation due to the limited availability of the MR imaging scanner. In this context, we propose a study to investigate whether conventional brain T1-weighted MR imaging (brain-T1) can be replaced by an acquisition that encompasses both the brain and the spinal cord (cns-T1). The proposed cns-T1 is a trade-off between having a larger spinal coverage compared with a brain-T1 acquisition, allowing visualization of the presence of lesions, though it is not as complete as conventional spinal cord MR imaging, which covers down to the conus medullaris. The effect on different brain-derived measures such as cortical thickness, regional volumetry, and changes in the brain volume during a 1-year period has been assessed. The differences in the estimated SCA have also been evaluated.
MATERIALS AND METHODS
Cohort
A group of 36 healthy controls (HCs) and 42 patients with MS was included in the study, with baseline MR imaging. From those, 18 HCs and 35 patients with MS had 12-month follow-up MR imaging. The study was approved by the Vall d’Hebron University Hospital ethics committee, and the participating subjects signed their informed consent (PR(AMI)24/2019).
MR Imaging Acquisition
Images were acquired in a 3T system (Tim Trio; Siemens) with a 12-channel whole-body coil. Acquisition parameters for the 3D T1-weighted images were the following—for brain—T1: TR = 2300 ms, TE = 2.98 ms, TI = 900 ms, 176 slices, FOV = 256 mm, voxel = 1 × 1 × 1 mm3, bandwidth = 240 Hz/px, time = 5 minutes 12 seconds; for cns-T1: TR = 2000 ms, TE = 3.21 ms, TI = 100 ms, 192 slices, FOV = 320 mm, voxel = 1 × 1 × 1 mm3, bandwidth = 150 Hz/px, time = 4 minutes 52 seconds. The parameters for the brain-plus-spine 3D T1-weighted MR imaging were established according to the protocol suggested by Cohen-Adad et al9 and include at least the C7 level. The patient table was moved between the 2 acquisitions so that the center of the image was placed in the isocenter.
MR Image Analysis
Correction for image distortions due to gradient nonlinearity was performed with the Siemens implemented tools on the MR imaging console. The two 3D T1-weighted images were cropped using the robust_fov utility in FSL and bias-field-corrected through the N4 algorithm. The aim of this step was to remove the medulla oblongata, which may affect the performance of brain analysis toolboxes. Then, the brain was segmented with FastSurfer (https://deep-mi.org/research/fastsurfer/).10 Cortical thickness was determined in 62 regions, 31 per hemisphere,11 and global volumes (GM, WM, thalamus, and total intracranial) were also obtained. The thalamus was chosen because it is a structure highly involved in all MS phenotypes with the presence of clinically relevant volume loss.12 For those subjects with baseline and follow-up MR imaging, the percentage brain volume change (PBVC) was calculated with the SIENA toolbox (https://fsl.fmrib.ox.ac.uk/fsl/fslwiki/SIENA).13
To ensure that the quality of the baseline and follow-up images was equivalent, we calculated the structural similarity index (SSIM)14 between them. This task can be accomplished by running SIENA with the -d option, which does not delete the baseline and follow-up images coregistered to the halfway point of both studies (which were used to calculate the PBVC). The SSIM is based on the product of 3 terms that account for the contribution of the luminance, contrast, and structure, and it was computed as implemented in Matlab (MathWorks). Finally, the SCA was estimated with the Spinal Cord Toolbox15 (https://github.com/spinalcordtoolbox/spinalcordtoolbox) by manually labeling the C2-C3 intervertebral level in the 2 acquisitions. Briefly, the spine was segmented with the DeepSeg algorithm and normalized to the multimodal PAM50 atlas to delineate the SCA. The SCA was calculated as the average of 11 sections, centered at the C2-C3 level. The position of the C2-C3 level was defined manually.
Statistical Analysis
The agreement between the measures obtained from the brain-T1 and cns-T1 was obtained by calculating the intraclass correlation coefficient (ICC). Reproducibility of the cortical thickness, regional brain volumes, and the SCA was assessed by calculating the ICC between the baseline and follow-up measures in the HC group. The Cicchetti criteria16 were taken as a reference: excellent agreement for 0.75<ICC <1; good, 0.60<ICC <0.74; fair, 0.40<ICC <0.59, and poor when ICC < 0.4.
For the PBVC, mean cortical thickness, and the SCA, a Bland-Altman plot was used to visualize the agreement between the measures obtained with the 2 sequences for baseline acquisitions. The SSIM values obtained from brain-T1 were compared with those obtained from cns-T1, calculated between baseline and follow-up studies using a paired samples t test. The metrics derived (ICC, SSIM) were assessed separately for the 2 groups, HC and patients with MS. Differences in the SCA, GM, and WM fractions between HCs and patients with MS were assessed using a univariate ANOVA with age and sex as covariates and were considered significant at P < .05. A power analysis was also performed to assess the sample size needed for the SCA and GM and WM fractions with each sequence (α = .05, power = 0.90). Finally, among the group of patients with MS, the association between the SCA and the Expanded Disability Status Scale (EDSS) was assessed through a nonparametric test (Spearman rank correlation). Statistical analysis was performed with the Statistical Package for Social Sciences (SPSS; IBM).
RESULTS
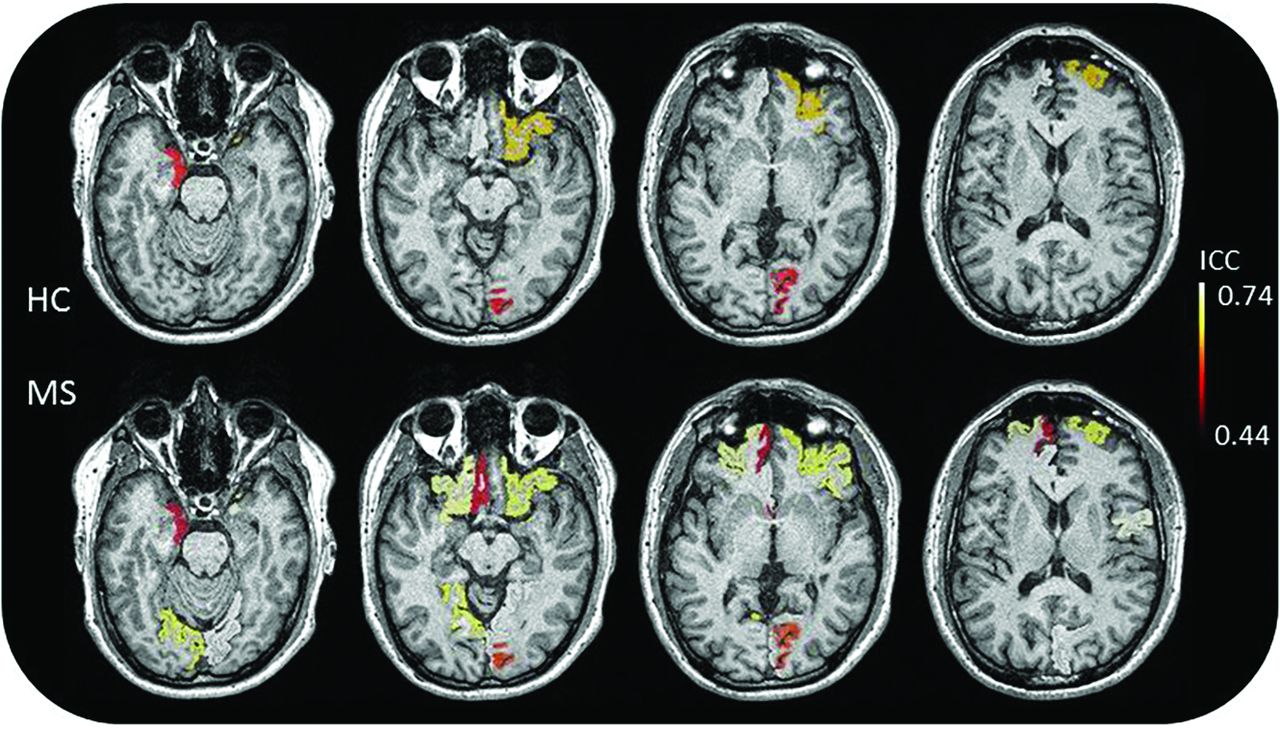
Included patients with MS were mainly classified as having progressive MS (64% secondary-progressive, median EDSS = 5.0; range, 3–8.5; 12% primary-progressive, median EDSS = 3.5; range, 3–5.5), while only 24% had a recent diagnosis of relapsing-remitting MS (<1 year, median EDSS = 2.0; range, 1–3). A total of 11 cns-T1 acquisitions were discarded due to movement (8 in HCs, 3 in patients with MS). The segmentation of the SCA from the brain-T1 was not accurate in 5 HC. A representative section of the two 3D T1-weighted sequences can be seen in Fig 1. The acquisition time of the cns-T1 was in the same range as the acquisition time needed for the brain-T1, around 5 minutes. A standard clinical routine sagittal T1-weighted imaging of the spinal cord lasts around 4 minutes. Thus, acquiring the cns-T1 instead of the brain-T1 does not result in any additional acquisition time, and it saves the time needed for an additional spinal cord T1-weighted MR imaging (4 minutes). When cortical thickness measures were compared, 94% of the regions had excellent agreement in HCs and 80% in patients with MS (Online Supplemental Data). The regions that showed an ICC < 0.75 are represented in Fig 2. Some of the regions that showed the largest disagreement were common for both groups, like the entorhinal, lateral orbitofrontal, and pericalcarine cortices.

Representative sagittal section of the acquired 3D T1-weighted images, brain only (upper image) and brain plus spine (lower image).

Cortical regions segmented with FastSurfer that showed the lowest agreement (ICC < 0.75) in HCs (upper row) and patients with MS (lower row).
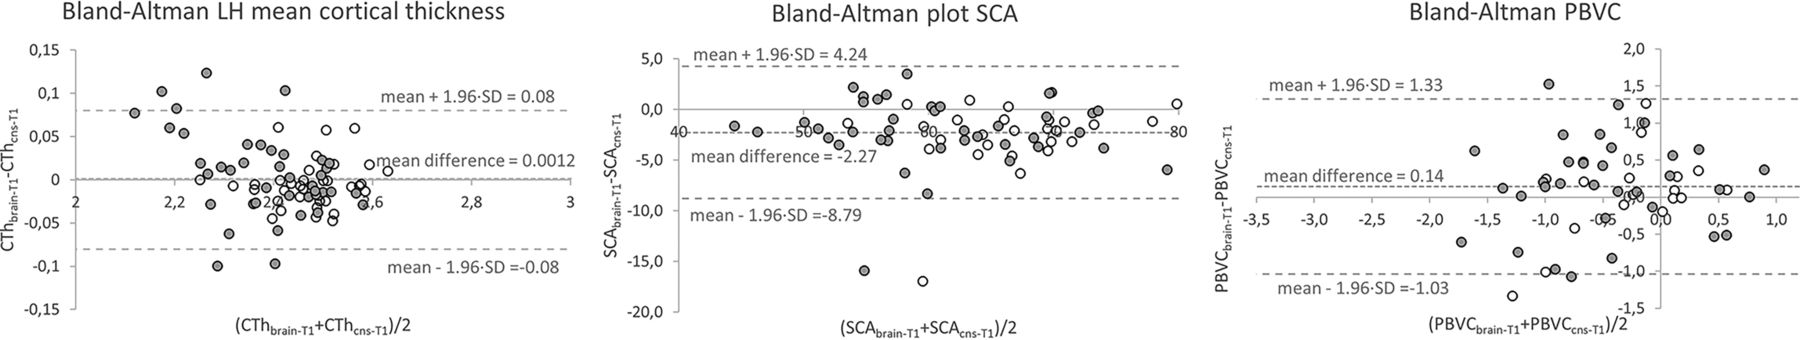
Regarding the agreement in the volumetric measurements, it was excellent for GM, WM, thalamus, and total intracranial volume (Online Supplemental Data). The agreement between the PBVCs obtained from the 2 sequences was fair for the HC group and excellent for the MS group (Fig 3, Online Supplemental Data). The SSIM was significantly higher when comparing images acquired with the cns-T1 and the brain-T1 (Online Supplemental Data) for both HCs (t = –8.52; P < .001) and patients with MS (t = –8.33; P < .001). The Bland-Altman plot indicated that the mean value of the differences was very close to zero (0.14). Finally, the agreement in the SCA measures was good for HCs and excellent for patients with MS (Fig 3, Online Supplemental Data). When we compared the SCA, GM, WM, and thalamus fractions between HCs and patients with MS, they were significantly smaller in patients with MS (P < .003 for all comparisons). The power analysis indicated that the sample size needed was higher for cns-T1 when comparing brain-derived measures (GM fraction, 12 subjects per group for brain-T1 versus 14 for cns-T1; WM fraction, 7 versus 12 subjects per group), while it was lower for the SCA (69 subjects per group for brain-T1 versus 27 for cns-T1). The association between the SCA and the EDSS was significant and slightly weaker when assessed from cns-T1 measures (ρ = –0.320; P = .044) than from brain-T1 (ρ = –0.368; P = .019).

Bland-Altman plots for the mean cortical thickness in the left hemisphere, the SCA, and the PBVC. Empty symbols correspond to HCs; filled symbols correspond to patients with MS. CTh indicates cortical thickness; LH, left hemisphere; PBVCbrain-T1, PBVC derived from brain 3D T1-weighted images; PBVCcns-T1, PBVC derived from brain-plus-spine 3D T1-weighted images.
DISCUSSION
This study assessed whether measures derived from cns-T1 were equivalent to those obtained from a brain-T1. The agreement and reproducibility have been studied for cortical thickness, regional and total intracranial volumes, PBVC between the baseline and follow-up scans, and SCA. To our knowledge, this is the first study that addresses a numeric comparison. Recent studies have compared these 2 acquisitions in voxel-based studies through a Statistical Parametric Mapping (http://www.fil.ion.ucl.ac.uk/spm/software/spm12) approach.5,6
The agreement in the thickness measured in most of the cortical regions was very high, suggesting that the values obtained from brain-T1 were very close to the ones obtained with cns-T1. This result was not the case for a few regions along the midline in the frontal and occipital lobes. The low agreement in the frontal regions can be explained because this area is more commonly affected by image artifacts due to the presence of the eyes, air-filled cavities, and the optic nerve, which may induce changes in susceptibility. Regarding the low agreement in the occipital lobe, the pericalcarine area is the region with the thinnest cortex; hence, small errors in segmentation may have a larger effect in the measured thickness. In general, it seems that the thickness measured in frontal regions is thinner when derived from brain-T1 compared with cns-T1, while the opposite seems to be true in some regions of the occipital and the temporal cortices. One could argue that because the position of the center of the brain relative to the isocenter was not the same in the 2 acquisitions, the differences may be higher along the dorsal-ventral axis, but this does not seem to be the case here. The additional regions that showed a noticeable disagreement in patients with MS were located adjacent to the area of the eye as well as surrounding the quadrigeminal cistern along the central fissure. A possible explanation might be that the enlargement of the CSF compartment, which includes the quadrigeminal cistern, due to the brain atrophy affects image segmentation and could be a plausible explanation in MS. Another plausible explanation is susceptibility skull base bone artifacts, which may depend on the position regarding the isocenter.
The agreement on the global volumetric measures was very high, supporting again brain-T1 acquisitions being replaced by cns-T1. As expected, patients with MS had lower volume fractions. Actually, the sample size needed to perform a study comparing GM and WM fractions was larger when using measures derived from cns-T1 compared with brain-T1, though the differences were not that large.
Regarding the agreement on the estimated PBVC, it was, unexpectedly, very high for the group of patients with MS and low for HCs. One plausible reason could be that the expected PBVC in HCs is very low, and small differences in the values may have a larger effect on the calculated ICC. Another explanation could be that the sample size of the HCs was smaller compared with that in patients with MS, and the possible outliers may have a larger impact on the calculated ICCs. Regarding the equivalence of the compared images (baseline and follow-up) measured through the SSIM, although they were extremely high in both acquisitions, it was significantly higher for cns-T1. Usually, this comparison is performed with measures such as the SNR, though the SSIM takes more factors into account than just the SNR or the contrast. The high SSIM obtained indicates that the 2 images compared to estimate the PBVC were almost identical and that the differences between the 2 acquisitions could not be attributed to this factor.
The agreement in the SCA measures obtained from brain-T1 and cns-T1 in HCs was unexpectedly low. Segmentations were revised visually, and no artifacts could explain the difference found. Finally, because the size of the SCA is relatively small, small variances in the segmentation make an important difference in the measured area. When we compared the SCA between HCs and patients with MS, the sequence used really seemed to play a role because the sample size needed was more than double when using measures derived from brain-T1 compared with cns-T1. The association between the SCA and EDSS in patients with MS revealed by cns-T1 and brain-T1 measures was highly equivalent.
The main advantage of replacing brain-T1 with cns-T1 is that the spinal cord can be assessed without acquiring an additional sequence, which is fundamental for clinical routine. Furthermore, if adding an additional spinal cord sequence is not an option, structural information in this segment can be obtained using the proposed cns-T1, as recommended in the MAGNIMs-CMSC_NAIMS consensus.17
There are limitations in the proposed study. A single center was analyzed, and patients in an early stage of MS were not included. Thus, the differences between patients with MS in an early stage (relapsing-remitting) and those in a more advanced stage (progressive MS) could not be assessed in this study. The role of the spinal cord lesions in estimating the SCA was not assessed in this study and should be considered because it may be a confounding factor. The acquisition protocols were not identical in terms of TE and TR. Brain-T1 was optimized in-house, and cns-T1 parameters were collected from the proposed multicenter study by Cohen-Adad et al.9 The brain volumes were obtained using FastSurfer; the results obtained with other tools, such as Statistical Parametric Mapping, were not studied.
CONCLUSIONS
Taken together, the findings suggest that a brain-T1 acquisition can be replaced by a cns-T1 acquisition, which provides an enlarged view of the spinal cord with no extra MR imaging acquisition time. Patients with MS may benefit from this approach because a qualitative and quantitative assessment of both the brain and the spinal cord is important for diagnosis and monitoring disease progression and treatment response.
Acknowledgments
We thank all subjects participating in the study and the Fundació Esclerosi Múltiple.
Footnotes
This work was funded by the Instituto de Salud Carlos III (PI18/00823).
Disclosure forms provided by the authors are available with the full text and PDF of this article at www.ajnr.org.
Indicates open access to non-subscribers at www.ajnr.org
References
- Received June 14, 2022.
- Accepted after revision February 1, 2023.
- © 2023 by American Journal of Neuroradiology


Jump to section
Related Articles
Cited By...
- No citing articles found.