
Abstract
BACKGROUND AND PURPOSE: Surgical resection of cerebral cavernous malformations close to eloquent regions frequently uses fMRI and DTI for surgical planning to best preserve neurologic function. This study investigates the reliability of fMRI and DTI near cerebral cavernous malformations.
MATERIALS AND METHODS: Consecutive patients with cerebral cavernous malformations undergoing presurgical fMRI and DTI mapping were identified. Each cerebral cavernous malformation was hand-contoured; 2 sequential 4-mm expansion shells (S1 and S2) were created, generating 2 ROIs and 2 contralateral controls. Fractional anisotropy and regional homogeneity measurements were then extracted from each ROI and compared with the contralateral controls. Reliability, accuracy, and precision were compared as appropriate.
RESULTS: Fifty-four patients were identified and included. Errors of fractional anisotropy were significantly lower than those of regional homogeneity in S1 and S2 (P < .001), suggesting that fractional anisotropy is more reliable than regional homogeneity near cerebral cavernous malformations. Proximity to cerebral cavernous malformations worsened the reliability of regional homogeneity (S1 versus S2, P < .001), but not fractional anisotropy (P = .24). While fractional anisotropy was not significantly biased in any ROI (P > .05), regional homogeneity was biased toward lower signals in S1 and S2 (P < .05), an effect that was attenuated with distance from cerebral cavernous malformations (P < .05). Fractional anisotropy measurements were also more precise than regional homogeneity in S1 and S2 (P < .001 for both).
CONCLUSIONS: Our findings suggest that hemosiderin-rich lesions such as cerebral cavernous malformations may lead to artifactual depression of fMRI signals and that clinicians and surgeons should interpret fMRI studies near cerebral cavernous malformations with caution. While fMRI is considerably affected by cerebral cavernous malformation–related artifacts, DTI appears to be relatively unaffected and remains a reliable imaging technique near cerebral cavernous malformations.
ABBREVIATIONS:
- APE
- absolute percentage error
- BOLD
- blood oxygen level–dependent
- CCM
- cerebral cavernous malformations
- DVA
- developmental venous anomalies
- FA
- fractional anisotropy
- PE
- percentage error
- ReHo
- regional homogeneity
- S1
- Shell1
- S2
- Shell2
Cerebral cavernous malformations (CCMs) are well-circumscribed and multilobulated vascular lesions lacking intervening brain parenchyma1 that are often in close proximity to developmental venous anomalies (DVA).2 Although many CCMs are clinically silent and can be managed conservatively,3 some lesions present with hemorrhage or refractory epilepsy,4 which may necessitate neurosurgical or neuroradiosurgical intervention.
Optimal neurosurgical or neuroradiosurgical approaches require a balance between gross total resection and preservation of neurologic function, especially in eloquent brain regions. Historically, fMRI and DTI have been used for surgical planning in eloquent regions.5⇓⇓-8 However, the reliability of these techniques near CCMs depends heavily on the assumption that signals are not influenced by proximity to artifacts caused by vascular lesions. CCMs often have intralesional hemosiderin deposits with higher concentrations on their outer borders, and because fMRI relies on capturing subtle changes in paramagnetism seen with shifting concentrations of oxygenated and deoxygenated hemoglobin, the nearby presence of superparamagnetic substances such as hemosiderin can potentially compromise the reliability of fMRI signals near CCMs. Furthermore, both fMRI and DTI sequences are echo-planar-based techniques, which could also make them both susceptible to paramagnetism-related artifacts near vascular anomalies.9 To date, the overall reliability of fMRI and DTI techniques for surgical planning near CCMs is unclear.
This study investigates the reliability of fMRI and DTI near CCMs. We hypothesize that proximity to CCMs may impair the accuracy and precision of fMRI and DTI and that fMRI may be more prone to artifacts than DTI.
MATERIALS AND METHODS
Consecutive patients who underwent presurgical mapping with fMRI and DTI were retrospectively identified from June 2008 to June 2019 at a single institution performed at Università degli Studi Gabriele d’Annunzio, Chieti e Pescara, at the Department of Imaging and Neuroscience. Written informed consent was obtained from all patients before undergoing MR imaging, and this study was approved by the local Ethics Committee.
Patients with a diagnosis of CCM were then selected, and all subjects without a diagnosis of CCM were excluded.
Additional exclusion criteria were the following: 1) the presence of multiple brain CCMs; 2) the presence of prior brain surgery leading to significant distortion of images; 3) a CCM located within the infratentorial compartment; or 4) a study performed on magnets with field strengths lower than 3T (Fig 1).

Flow chart of study selection.
Data Acquisition and Study Design
All patients underwent a standardized multimodal imaging protocol that included conventional and advanced MR images obtained during a single imaging session (Table 1).
MR imaging parameters for conventional and advanced sequences
Images were acquired with a 3T MR imaging system (Achieva X-Series; Philips Healthcare) using a sensitivity encoding 8-channel head coil.
DTI, fMRI, and conventional MR imaging sequence images from the scanner were converted to a Neuroimaging Informatics Technology Initiative (NifTi) compressed format using the dcm2nii tool from MRIcron (https://www.nitrc.org/projects/mricron).
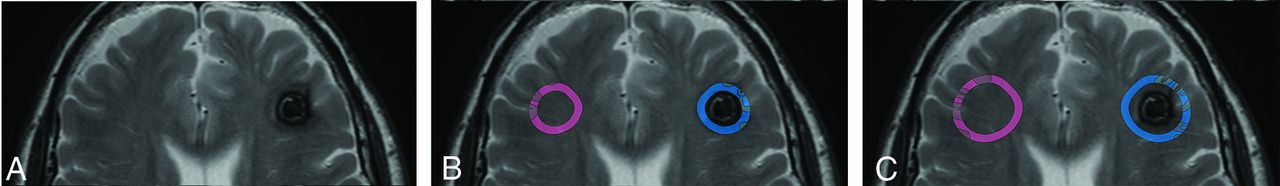
Each CCM was hand-contoured on T2 sequences using the open-source software ITK-SNAP (http://www.itksnap.org/pmwiki/pmwiki.php),10 and on the basis of the T2 segmentation, 2 sequential expansion shells (S1 and S2) were created with a thickness measuring 4 mm, generating 3 different ROIs surrounding the lesions. Subsequently every ROI was flipped in the normal contralateral hemisphere with the following originally created algorithm, obtaining a total of 6 ROIs per subject. Shells were computed by 2 sequential dilations and subtraction of the main ROI. Flipped control ROIs were obtained by registration to Montreal Neurological Institute space (which assures symmetric space) and then flipped back to the original space. Registration among spaces was performed using Advanced Normalization Tools (ANTs, http://stnava.github.io/ANTs/) (Fig 2).11

Conventional T2 TSE showing a left frontal subcortical cavernous hemangioma. White and gray matter segmentations of ROIs of the first and second expansion shells (4 mm each) are seen in light blue. On the contralateral hemisphere, computation of control ROIs is shown in light red.
Volumetric segmentation of 3D fast-field echo sequences was performed with the FreeSurfer image analysis suite (http://surfer.nmr.mgh.harvard.edu/) using procedures described in prior publications.12⇓⇓-15 Voxels corresponding to gray matter within the ROIs were automatically segmented to calculate regional homogeneity (ReHo).
Denoising steps were applied to DTI acquisitions then a low b-value volume was extracted and skull-stripped. DTI indexes were computed using FSL Toolbox dtifit (https://fsl.fmrib.ox.ac.uk/fsl/fslwiki/FDT/UserGuide#DTIFIT) with tensor fitting with weighted least squares after eddy current correction and gradient direction rotation. Voxels with fractional anisotropy (FA) values outside the range (0,1) or negative diffusion were marked and excluded from the ROIs.
ReHo.
Whole-brain time courses from residuals of the general linear model on task-based fMRI acquisitions were extracted using the FSL Toolbox FEAT pipeline (https://fsl.fmrib.ox.ac.uk/fsl/fslwiki/FEAT)16,17 after section time and motion correction. Affine registration from EPI space to structural space was performed using white-matter boundary methods (BBR; https://fsl.fmrib.ox.ac.uk/fsl/fslwiki/FLIRT_BBR#:∼:text=The%20white-matter%20boundary%20is%20mapped%20to%20the%20EPI,pair%20is%20used%20to%20calculate%20the%20cost%20function) implemented on FSL Toolbox FLIRT.16⇓⇓⇓⇓⇓-22
Analysis of Functional NeuroImages (AFNI; https://afni.nimh.nih.gov/),23 the Functional and Tractographic Connectivity Analysis Toolbox (FATCAT),24 and 3dReHo (https://afni.nimh.nih.gov/pub/dist/doc/program_help/3dReHo.html)25 were used to extract regional homogeneity from ROIs.
Qualitative Data Acquisition
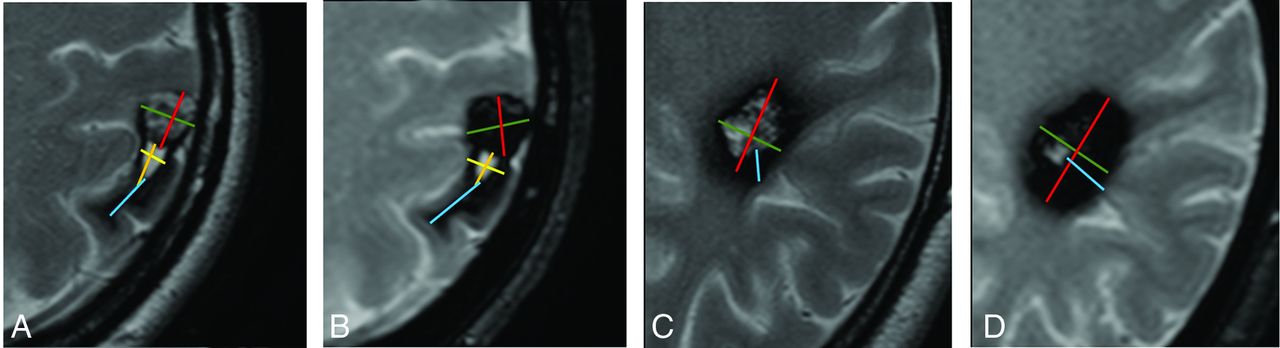
Using conventional MR imaging sequences, 2 neuroradiologists with 5 and 9 years of experience performed a qualitative evaluation of each CCM in a consensus reading assessing the following characteristics (Fig 3): 1) signs of rupture; 2) the presence of a nearby developmental venous anomaly; 3) the presence of edema; 4) baseline T1 signal hyperintensity; 5) T2 signal hyperintensity; 6) T2 hemosiderin ring features (categorized as regular, irregular, continuous, discontinuous); 7) the thickness of the hemosiderin ring (measured on T1, T2, T2*, and SWI); 8) maximum axial diameters of the lesion (measured on T1, T2, T2*, and SWI); and 9) the presence of intra- or extralesional hematoma. If a hematoma was present, then they also collected the following additional variables: 10) the maximum thickness of the wall of the hematoma (measured on T1, T2, T2*, and SWI); and 11) the maximum axial diameters of the hematoma (measured on T1, T2, T2*, and SWI).

Images exemplifying qualitative data analysis in 2 different patients (A and C) with T2 TSE and T2 gradient sequences (B and C). A 43-year-old woman with a superficial, previously ruptured left parietal CCM with a collection of qualitative characteristics. CCM maximum diameters (red and green, A and B), hematoma maximum diameters (yellow and orange, A and B), and maximum thickness of hemosiderin rim thickness (light blue, A and B). A 52-year-old man with a left subcortical CCM with measurement of maximum diameters (green and red, C and D) and maximum hemosiderin rim thickness (light blue, C and D).
Statistical Analysis.
To assess the reliability of ReHo and FA in each ROI, we calculated the absolute percentage error (APE) by dividing measurements in CCMs, S1, and S2 by measurements in their respective contralateral (control) ROIs. APEs were compared within and between imaging modalities using the Wilcoxon matched-pairs signed-rank test. Adjusted P values were calculated using the Bonferroni method; values < .05 were statistically significant. To assess bias, percentage error (PE) was log-transformed and outliers were removed using the ROUT method with a Q of 1%; normal distribution was confirmed by visual inspection as well as the Anderson-Darling test. One-sample t tests were performed to identify significant bias in each ROI from contralateral controls; P values < .05 were statistically significant. Welch t tests were performed to identify significant differences within and between modalities; adjusted P values (calculated using the Bonferroni method) < .05 were statistically significant. Finally, to assess variance, we performed F-tests of equal variances on normalized PEs, and comparisons were made within and between modalities. The Bonferroni method raw P values were multiplied by the number of comparisons to keep the same .05 significance threshold. Adjusted P values (calculated using the Bonferroni method) < .05 were statistically significant.
RESULTS
Patient Characteristics
Fifty-four patients were identified and included in our study (Online Supplemental Data). Forty-one percent were men, the median age was 42 years, and 85% of patients were right-handed. Thirty-seven percent of lesions were on the left side, 65% were in the frontal lobe, and 85% were superficial. Lesions had a median maximum diameter of 16 mm, and the median border thickness was 3.2 mm. Forty-three percent of lesions had a nearby DVA, and 56% of CCMs were ruptured.
Absolute Error (Overall Reliability)
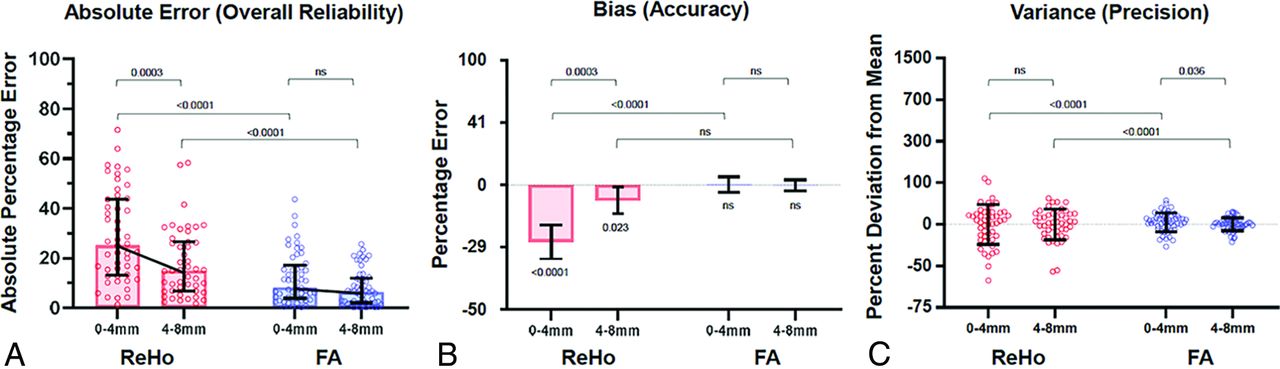
To assess the overall reliability of fMRI and DTI, we compared ReHo and FA measurements in CCMs, S1 (0–4 mm from the CCM borders), and S2 (4–8 mm from CCM borders) with measurements in their respective contralateral control ROIs. APRs were calculated, and these errors were compared between groups (Table 2 and Fig 4A). Here, we found that ReHo had significantly higher absolute errors than FA in S2 (15.0% versus 6.5%, adjusted P < .001) and S1 (25.1% versus 9.2%, adjusted P < .001). Proximity to CCMs significantly worsened the reliability of ReHo, with significantly higher errors in S1 than S2 (adjusted P < .001). On the other hand, proximity to CCMs did not seem to significantly impact the reliability of FA (adjusted P = .12) (Table 2).
Errors, bias, and variance of ReHo and FA measurements near CCMsa

Error, bias, and variance of ReHo and FA measurements near CCMs. A, Absolute errors of each ROI compared with their contralateral controls (median with interquartile range and adjusted P values from the Wilcoxon matched-pairs signed-rank test). B, Biases of each ROI compared with their contralateral controls. Mean with standard error of mean is shown. P values from 1-sample t tests are shown below the bars, and adjusted P values from Welch t tests are shown above the bars (C). Variances of each ROI compared with their contralateral controls and SDs are shown. Adjusted P values from F-tests for equality of variance are shown. P values or adjusted P values > .05 were deemed nonsignificant and marked as ns.
Bias (Accuracy)
To identify sources of error for ReHo and FA measurements, we assessed both modalities for possible measurement biases in CCMs, S1, and S2 (Table 2 and Fig 4B). Statistically, bias represents a deviation of the average of measurements from a theoretic mean, suggesting systemic over- or underestimation of true signals. Here, we found that ReHo measurements were significantly biased toward lower signals in S1 and S2 (P < .001 and P = .02, respectively). Furthermore, this effect was increased with proximity to CCMs, as seen by a significantly larger bias in S1 than in S2 (−27.2 versus −8.3%, adjusted P < .001). On the other hand, FA measurements were not significantly biased toward higher or lower signals in CCMs, S1, or S2, and there were no differences in bias of FA measurements among ROIs (P > .99). Finally, ReHo was significantly more biased than FA in S1 (−27.2% versus −0.3%, respectively; adjusted P < .001), but not in S2 (adjusted P = .16) (Table 2).
Variance (Precision)
We also assessed the variance of measurements to investigate whether differences in precision may have contributed to the differences in overall reliability between ReHo and FA measurements (Table 2 and Fig 4C). Statistically, variance represents the spread of measurements around the measurement mean, providing a quantification of noise or inherent imprecisions within measurement techniques. Here, we found that FA was significantly more precise than ReHo in S1 and S2 (adjusted P < .001 for both). We also found that for ReHo, there were no significant differences in precision between S1 and S2 (P = .31), whereas for FA, S2 had lower variance than S1 (P = .03) (Table 2).
Qualitative Associations
Finally, we investigated whether qualitative characteristics of CCMs (eg, CCM location, size, border thickness, border morphology, T2-signal intensity within CCMs, nearby DVA, CCM rupture, and so forth) may have impacted the reliability of either imaging technique. We did not identify any characteristics of CCMs that significantly impacted the overall reliability of ReHo or FA measurements.
DISCUSSION
fMRI and DTI are cornerstones of optimal presurgical planning for CCMs near eloquent brain areas;5⇓⇓-8,26⇓⇓⇓⇓⇓⇓-33 however, the reliability of these techniques near vascular lesions such as CCMs is not well-understood. In this study, we show the following: 1) fMRI is prone to significant error near CCMs, likely due to hemosiderin-induced artifactual depression of blood oxygen level–dependent (BOLD) signals; and 2) DTI is largely accurate near CCMs and does not appear to be significantly compromised by CCM-related artifacts. These findings are original, and they provide valuable insight into how to optimize preoperative planning for CCMs. DTI and fMRI are often considered unreliable near vascular malformations and are frequently overlooked by both neuroradiologists and neurosurgeons when considering preoperative planning protocols. Although relatively surprising given the relative paucity of studies34⇓-36 that have tried to address this matter, our findings, especially the consistent, quantifiable reliability of DTI, should encourage its frequent use in clinical practice.
ReHo, a mathematic technique to assess whether the BOLD signal of a given voxel is similar to that of its neighbors, was chosen as our primary measurement.25 Neuronal firing often occurs in regional clusters, which can present as concordant BOLD signals across multiple neighboring voxels. Thus, higher ReHo values indicate higher concordance signals of a given voxel with its neighbors, which can be a marker of resting-state functional connectivity.37 Our results demonstrate that ReHo values are prone to large errors near CCMs, likely driven by CCM-related artifacts. Hemosiderin, a superparamagnetic blood-degradation product rich in Fe3+ can cause substantial signal distortions near CCMs and alter BOLD signals. Given that BOLD signals rely on measuring subtle changes in paramagnetism, the overwhelming superparamagnetism of hemosiderin near CCMs can significantly compromise the sensitivity of fMRI to detect subtle paramagnetic shifts. Substantial BOLD signal distortions near CCMs can result in low values of ReHo due to increased heterogeneity; thus, it is not surprising that our findings show high measurement errors of ReHo near CCMs and that these errors attenuate with distance from CCMs.
In stark contrast, FA measurements near CCMs are largely accurate. Unlike BOLD signals, DTI signals do not directly assess changes in paramagnetism; thus, hemosiderin deposits near CCMs would be expected to have little impact on DTI measurements. Of note, because fMRI and DTI both use echo-planar sequences, they may have gross geometric image distortions from susceptibility artifacts due to relatively long gradient-echo trains.9 However, we did not observe significant measurement errors near CCMs for DTI, suggesting that this phenomenon likely plays a minimal role and that the errors seen with fMRI are likely unrelated to this general limitation of echo-planar-based imaging.
Most interesting, qualitative characteristics postulated to contribute to signal artifacts near CCMs were not significantly associated with differences in errors for either fMRI or DTI. While the lack of statistical significance is likely due to the nature of the sample size and the lack of statistical power, it is also possible that there may be some degree of underlying change in the brain parenchyma near CCMs that gives rise to changes in MR imaging signals. For example, hemosiderin rims can cause neuronal hyperexcitability and have been proposed as a possible etiology of epilepsy. Thus, functional derangements and astrogliosis38 near CCMs may ensue, causing changes in fMRI and DTI signals. While this hypothesis might be plausible, our study is not conceived or powered to assess the degree of astrogliosis adjacent to CCMs and its potential interactions with fMRI. Furthermore, fMRI and DTI both had some imprecision near CCMs, also contributing to overall errors. Unlike the artifactual signal depression seen with ReHo, these imprecisions were not strongly associated with proximity to CCMs; thus, they may be intrinsic to their specific signal resolutions. Low precision can potentially be overcome with the use of multishot sequences or parallel imaging. Despite reduction of the echo-train length and the use of stronger magnets that could improve precision, these strategies may exponentiate susceptibility-related artifacts.
Our study has limitations. First, while resting-state fMRI allows us to reliably compare signals to contralateral control ROIs, task-based fMRI may provide more valuable and direct information on the functional relevance of areas near CCMs. Nonetheless, our observation that BOLD signals may be depressed near CCMs would also be expected to affect task-based fMRI. Second, we used resting periods during task-based fMRI studies for our analysis. This methodology exposes our data to potential inaccuracies as changes in cerebral blood flow, thus, BOLD signals, may persist after tasks and create signal biases during resting states. Next, our use of contralateral ROIs as controls relies on the assumption that the human brain is symmetrically organized. While past studies provide evidence for organizational symmetry,39⇓-41 there are inevitably differences between hemispheres within each subject. Finally, our study population included MR imaging examinations obtained during 11 years, and changes in study protocols with time may introduce heterogeneity.
CONCLUSIONS
Our results are consistent with the hypothesis that hemosiderin-rich lesions such as CCMs may lead to artifactual depression of fMRI signals and that clinicians and surgeons should interpret fMRI studies near CCMs with caution. While fMRI is significantly affected by CCM-related artifacts, DTI appears to be relatively unaffected and remains a reliable imaging technique near CCMs. Future studies should further elucidate the mechanisms underlying these findings and develop mitigating strategies to improve the accuracy and precision of these imaging modalities.
Footnotes
Disclosure forms provided by the authors are available with the full text and PDF of this article at www.ajnr.org.
References
- Received August 8, 2022.
- Accepted after revision December 19, 2022.
- © 2023 by American Journal of Neuroradiology


Jump to section
Related Articles
Cited By...
- No citing articles found.