
Abstract
BACKGROUND AND PURPOSE: Controversy exists as to whether ADC histograms are capable to distinguish human papillomavirus–positive (HPV+) from human papillomavirus–negative (HPV–) oropharyngeal squamous cell carcinoma. We investigated how the choice of b-values influences the capability of ADC histograms to distinguish between the two tumor types.
MATERIALS AND METHODS: Thirty-four consecutive patients with histologically proved primary oropharyngeal squamous cell carcinoma (11 HPV+ and 23 HPV–) underwent 3T MR imaging with a single-shot EPI DWI sequence with 6 b-values (0, 50, 100, 500, 750, 1000 s/mm2). Monoexponentially calculated perfusion-sensitive (including b=0 s/mm2) and perfusion-insensitive/true diffusion ADC maps (with b ≥ 100 s/mm2 as the lowest b-value) were generated using Matlab. The choice of b-values included 2 b-values (ADCb0–1000, ADCb100–1000, ADCb500–1000, ADCb750–1000) and 3–6 b-values (ADCb0–750–1000, ADCb0–500–750–1000, ADCb0–50–100–1000, ADCb0–50–100–750–1000, ADCb0–50–100–500–750–1000). Readers blinded to the HPV– status contoured all tumors. ROIs were then copied onto ADC maps, and their histograms were compared.
RESULTS: ADC histogram metrics in HPV+ and HPV– oropharyngeal squamous cell carcinoma changed significantly depending on the b-values. The mean ADC was lower, and skewness was higher in HPV+ than in HPV– oropharyngeal squamous cell carcinoma only for ADCb0–1000, ADCb0–750–1000, and ADCb0–500–750–1000 (P < .05), allowing distinction between the 2 tumor types. Kurtosis was significantly higher in HPV+ versus HPV– oropharyngeal squamous cell carcinoma for all b-value combinations except 2 perfusion-insensitive maps (ADCb500–1000 and ADCb750–1000). Among all b-value combinations, kurtosis on ADCb0–1000 had the highest diagnostic performance to distinguish HPV+ from HPV– oropharyngeal squamous cell carcinoma (area under the curve = 0.893; sensitivity = 100%, specificity = 82.6%). Acquiring multiple b-values for ADC calculation did not improve the distinction between HPV+ and HPV– oropharyngeal squamous cell carcinoma.
CONCLUSIONS: The choice of b-values significantly affects ADC histogram metrics in oropharyngeal squamous cell carcinoma. Distinguishing HPV+ from HPV– oropharyngeal squamous cell carcinoma is best possible on the ADCb0–1000 map.
ABBREVIATIONS:
- AJCC
- American Joint Committee on Cancer
- AUC
- area under the curve
- HNSCC
- head and neck squamous cell carcinoma
- HPV+
- human papillomavirus positive
- HPV–
- human papillomavirus negative
- OPSCC
- oropharyngeal squamous cell carcinoma
Infection with human papillomavirus (HPV) is a well-documented risk factor for oropharyngeal squamous cell carcinoma (OPSCC).1 The literature suggests that HPV-positive (HPV+) OPSCC is a distinct tumor entity with an improved response to radiation therapy and a better outcome in comparison with HPV-negative (HPV–) OPSCC.2,3 As a result, the latest editions of the American Joint Committee on Cancer (AJCC) and the TNM Classification of Malignant Tumors staging manuals use different OPSCC staging criteria depending on HPV status.4,5 The HPV status is established by p16 immunohistochemistry complemented by polymerase chain reaction to detect HPV DNA or by in situ hybridization for virus DNA and oncoprotein E6/E7 messenger RNA.6
Several studies have shown that HPV+ OPSCC differs from HPV– OPSCC in terms of not only pathogenesis and prognosis but also histopathologic characteristics and microstructural heterogeneity.7,8 DWI allows quantification of the Brownian motion of water molecules in vivo, and ADC values, expressed in square millimeter per second, are inversely correlated with cellular density. ADC metrics could, therefore, serve as imaging biomarkers in head and neck squamous cell carcinoma (HNSCC), with the advantage of being able to evaluate the entire tumor noninvasively in vivo, thus avoiding the inconsistency inherent to invasive tissue sampling.
Some investigators found that HPV+ OPSCCs have lower mean ADC values than HPV– OPSCCs, most likely because of differences in the cellular microenvironment.8⇓⇓-11 However, these observations have not been confirmed by others.12,13 ADC metrics are influenced by DWI acquisition protocols, choice of b-values, scanner characteristics that may vary among vendors, and lesion segmentation techniques that are operator-dependent.11,14,15 When ADC values are calculated with a monoexponential decay model including b=0 as the lowest b-value, molecular diffusion is influenced by tissue perfusion effects. Although these tend to increase ADC values, they can be corrected for using either higher b-values or multiple b-values.16 From a practical point of view, monoexponential ADC calculation using 2 b-values reduces the acquisition time in clinical routine as opposed to the acquisition of multiple b-values.
The effect of perfusion on ADC maps used as cancer biomarkers is not completely clear and may vary from one tumor to another. Not surprising, the choice of the right number and type of b-values for the assessment of HNSCC is still somewhat controversial, and varies among 2,8⇓-10 3,12,13 or 6 b-values.17,18 It has been recommended that for monoexponentially calculated ADCs with 2 b-values, the lowest b-value should be in the range of 100–150 s/mm2 and the highest b-value should be between 500 and 1000 s/mm to obtain a “perfusion-insensitive” and thus a “true diffusion” ADC estimation.14 However, some studies evaluating ADC characteristics of HPV+ and HPV– OPSCC are based on ADCs calculated monoexponentially with 2 b-values only, namely 0 s/mm2 and 1000 s/mm2. To the best of our knowledge, it is not yet clear whether in patients imaged for HNSCC, ADC maps calculated with several b-values (“multi-b ADC maps”) allow a better distinction between HPV+ and HPV– OPSCC than maps calculated only with 2 b-values and whether the perfusion effect on the ADC calculation, which occurs with b=0, has a role in this context.
The purpose of the current study was to investigate how the choice of b-values influences the ability of ADC histogram metrics to differentiate HPV+ from HPV– OPSCC and which combination of b-values performs best for distinguishing between the 2 tumor types. We, therefore, compared histograms of ADC maps obtained with 2 b-values, multiple b-values, and different combinations thereof and correlated the results with the HPV– status.
MATERIALS AND METHODS
Patient Inclusion Criteria
This retrospective study was approved by the Institutional Ethics and Research Committee and was performed according to the guidelines of the Helsinki II declaration. Informed consent was waived. The inclusion criteria for patients in this study were 3-fold: 1) consecutive adult patients imaged in our institution for histologically proved primary OPSCC, 2) HPV status determined by p16 immunohistochemistry (nuclear and cytoplasmic staining of ≥70% of neoplastic cells required for HPV– positivity)19 and polymerase chain reaction for HPV DNA, and 3) MR imaging examinations obtained on the same scanner with a 6 b-value DWI sequence allowing retrospective calculation of ADC maps with different b-value combinations. During 24 months, 49 consecutive patients with OPSCC underwent MR imaging with the above-mentioned DWI sequence. Fifteen patients were excluded from the study because of previous radiation therapy (n = 11), lack of documentation of the HPV– status (n = 2), tumor size too small for segmentation (n = 1), or dental hardware artifacts impairing DWI quality (n = 1). Therefore, 34 patients with primary OPSCC fulfilled the inclusion criteria.
MR Imaging Protocol
Images in all patients were obtained on a 3T Ingenuity TF PET/MR imaging (Philips Healthcare) system with a routine imaging protocol, which included morphologic sequences covering the area between the skull base and the thoracic inlet (axial T1 and T2, coronal T2 STIR, axial and coronal T1 after IV injection of a gadolinium-based contrast agent) and 2 single-shot EPI DWI sequences with 6 b-values (0, 50, 100, 500, 750, 1000s/mm2), each DWI sequence covering 12 cm in the craniocaudal direction, ie, a first sequence covering the suprahyoid neck followed by a second sequence covering the infrahyoid neck. The EPI DWI sequences had the following parameters: FOV = 230 × 254 mm2, acquired resolution = 2 × 2 × 3mm3, reconstructed resolution = 1.3 × 1.3 × 3 mm3, TE/TI/TR = 73/230/6859 ms, sensitivity encoding acceleration factor = 2, slices = 40, total acquisition time = 4 minutes 7 seconds. Because we were interested in the DWI characteristics of primary OPSCC, only the sequences covering the primary tumors were used for analysis.
Generation of ADC Maps with Different b-Values
Reconstruction of ADC maps with different b-value combinations using the monoexponential decay model was performed with an in-house-developed Matlab software program (Matlab release 2009b 32 bit; MathWorks). When only 2 b-values were considered for monoexponential ADC calculation (4 combinations in this study), we used the following formula: ADC = (ln SIb1 – ln SIb2)/(b2 – b1), where b1 and b2 were the 2 b-values used. When using multiple b-values (5 combinations in this study), multi-b ADC (ADCmultiple-b) was calculated by fitting the linearized version of the monoexponential decay model to the data on the basis of the following formula: SIb / SI0 = exp (– b × ADCmultiple-b), where SIb is the signal intensity in the pixel measured for each b-value and SI0 is the signal intensity in the pixel without diffusion-weighted sensitization (b=0). This type of ADC calculation was chosen because it corresponds to the least-squares exponential fitting model used widely for multiple b values and as provided in clinical routine by all MR imaging vendors. Calculations using the biexponential or the stretched exponential model were not considered on the basis of the current recommendations20 and because the monoexponentially calculated ADC has been shown to be the most reliable diffusion parameter in different tumor types.21,22 Table 1 shows the choice and combination of b-values for each calculated ADC map.
Choice of b-values for each calculated ADC map
Tumor Segmentation
The OsiriX MD, Version 11, software (Pixmeo) was used for ROI placement. Freehand ROIs were drawn by 2 subspecialty board-certified head and neck radiologists (with >10 years' experience) on the basis of side-by-side visualization of axial T2, contrast-enhanced T1, b=1000, and ADC images. The ADC maps used for segmentation were the ADC maps generated automatically by the MR imaging scanner (6 b-values) and used in clinical routine. Both radiologists were blinded to the HPV status and clinical data. The freehand ROIs encompassed the largest cross-sectional tumor areas on 2 consecutive axial slices without excluding necrotic portions.8,10 Tumor areas for ROI placement were selected on the basis of the agreement of both readers, and ROI boundaries were drawn in consensus. The reasons for contouring the largest cross-sectional tumor areas on 2 consecutive slices were as follows: First, other studies evaluating ADC values in HPV+ and HPV– OPSCC also used the same approach;8,10 second, because whole-tumor segmentation is time-consuming and because we aimed to use a method that would be feasible during clinical routine, this choice appeared as a good compromise between contouring only 1 largest cross-sectional area (with potentially too few pixels for analysis) and whole-tumor segmentation.
Quantitative and Semiquantitative (Visual) Analysis
The same ROIs were then copied on all ADC maps (Online Supplemental Data), and a csv file containing all pixel information from the ROIs was then exported from OsiriX to Matlab. ADC histogram parameters resulting from the combined voxel data from both ROIs into 1 large histogram were analyzed for each ADC map separately (ie, for each investigated b-value combination). The evaluated parameters included the following: mean ADC, skewness, and excess kurtosis. Comparison between histogram parameters in HPV– and HPV+ OPSCCs was done for all combinations of b-values. Receiver operating characteristic curves and areas under the curve (AUCs) were calculated to assess the diagnostic performance for distinguishing HPV+ from HPV– OPSCC. In addition, to avoid overly optimistic estimates of AUCs resulting from analysis of the full data set, we used a leave-one-out cross-validation approach with linear discriminant analysis as a model. The linear discriminant analysis score function was estimated on the training set after leaving 1 observation out. The process was repeated for all observations, and each of the left-out observations was predicted across this estimated score function. By means of the linear relation between the linear discriminant analysis scores and the original observations, the optimal threshold was calculated to determine the sensitivity, specificity, and accuracy for each ADC map.
Furthermore, to visually evaluate differences between tumors on the studied ADC maps, we generated a customized color map (Online Supplemental Data). This customized map aimed to facilitate visual (semiquantitative) assessment of possible differences between ADC pixel values and their distribution. Visual assessment of tumor ROIs on the color-coded ADC maps was done by the same 2 radiologists without knowledge of the HPV– status, and discrepancies between the scores were solved by consensus. A 5-point Likert scale (1 = definitely HPV–, 2 = probably HPV–, 3 = indeterminate, 4 = probably HPV+, 5 = definitely HPV+) was used. Criteria for visual ROI scoring included perceived tumor heterogeneity and ADC values, both presumed lower in HPV+ OPSCCs.
Statistical analysis was performed with R (Version 3.3.2; RStudio: Integrated Development for R; https://www.rstudio.com/products/rstudio/download/). Differences between the 2 tumor groups (HPV+ and HPV– OPSCC) were assessed with a significance level set at P < .05.
RESULTS
Among the 34 patients included in this study, 23 patients had HPV– OPSCC and 11 patients had HPV+ OPSCC. Patient and tumor characteristics are shown in Table 2.
Patient and tumor characteristics
Table 3 summarizes the results of pair-wise comparisons between ADC histogram parameters of HPV+ versus HPV– OPSCC for all investigated ADC maps on the basis of the ROIs drawn in consensus by the 2 readers. A significantly lower mean ADC was found in HPV+ OPSCC versus HPV– OPSCC only for 3 b-value combinations (ADCb0–1000, ADCb0–750–1000, and ADCb0–500–750–1000), however, not for the other 6 combinations. Likewise, ADC skewness was significantly higher in HPV+ OPSCC than in HPV– OPSCC for the same b-value combinations, however, not for all other combinations. ADC excess kurtosis was significantly higher in HPV+ OPSCC than in HPV– OPSCC for all b-value combinations excepting 2 pure diffusion ADC maps (ADCb500–1000 and ADCb750–1000). The results of pair-wise comparisons are equally illustrated as boxplots in the Online Supplemental Data.
Comparison of ADC histograms in HPV+ versus HPV– OPSCC for each b-value combinationa
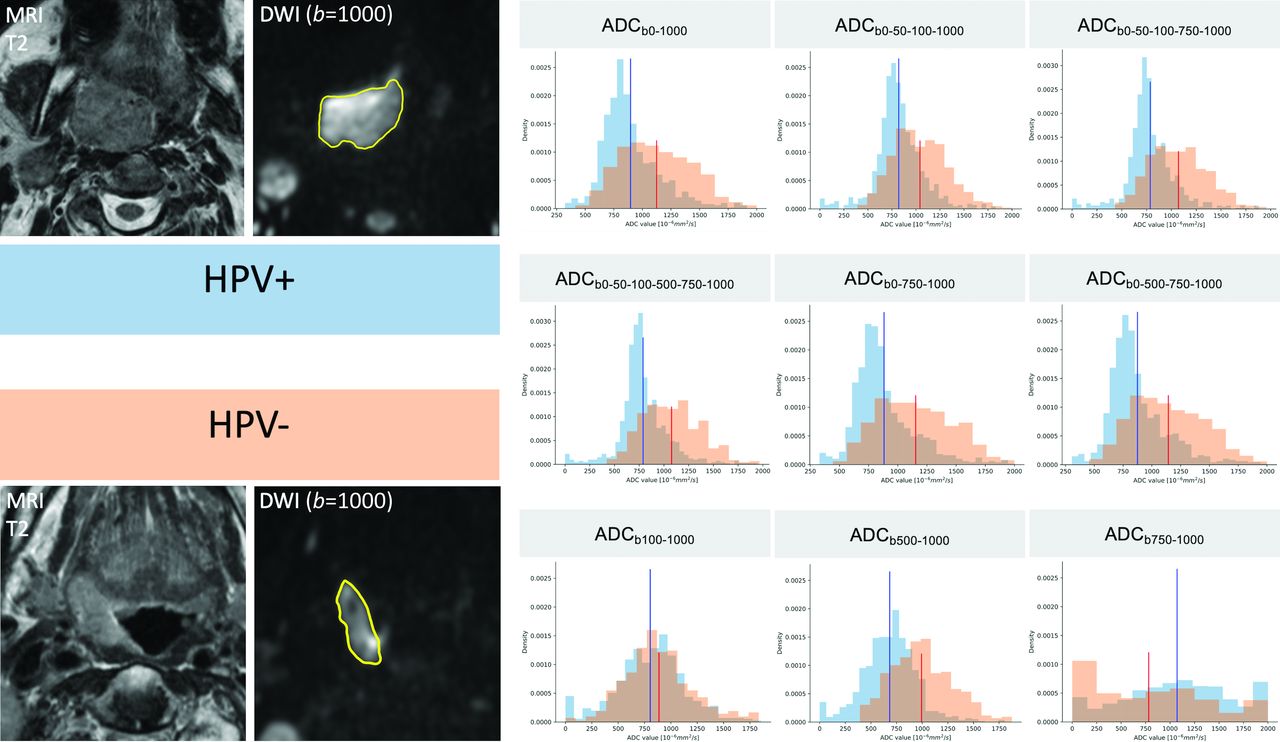
Depending on the choice of b-values, ADC histogram shapes showed significant changes for the same tumor ROI. While HPV+ and HPV– OPSCC could be distinguished from one another on the basis of their different histogram shapes on ADC maps calculated with b=0, this was not the case for the perfusion-insensitive ADCb100-1000, ADCb500–1000, and ADCb750–1000 maps due to overlapping metrics (Fig 1).

ADC histogram changes caused by b-value choice illustrated in 2 different patients with OPSCC. T2 and corresponding b=1000 images with tumor ROIs (in yellow) are shown on the left side of the figure. The histograms in blue were obtained from the pixel values of the HPV+ OPSCC ROI, and the histograms in orange, from the pixel values of the HPV– OPSCC ROI. ADC mean values are indicated in blue for the HPV+ OPSCC and in red for the HPV– OPSCC, respectively. On ADC maps with b=0, HPV+ OPSCC histograms have lower ADC mean values, a slender peak (leptokurtic shape), and a right skew, whereas HPV– OPSCC histograms have higher ADC mean values, lower kurtosis (flatter shape), and a more symmetric shape (Gaussian distribution). On ADC maps with b=0, the histograms of the 2 tumors can be easily distinguished one from another. This is hardly possible on perfusion-insensitive ADC maps (ADCb100-1000, ADCb500-1000, ADCb750-1000) due to overlapping metrics.
Receiver operating curve analyses to discriminate between HPV+ and HPV– OPSCC were performed for all parametric ADC maps. Table 4 illustrates the AUCs for the ADC maps with statistically significant differences between HPV+ and HPV– OPSCC for all 3 evaluated metrics, ie, ADC mean, skewness, and kurtosis (Table 3), as well as for the ADCb100-1000 recommended in the literature.14 Pair-wise comparisons showed that the highest diagnostic performance to distinguish HPV+ from HPV– OPSCC was achieved with excess kurtosis on a mixed perfusion-diffusion map, ie, the ADCb0-1000 map (AUC = 0.893; sensitivity = 100%, specificity = 82.6%, threshold = 0.641). The AUC of excess kurtosis on the ADCb0–1000 map was superior to the AUC of excess kurtosis on the other ADC maps (P < .05). However, for ADC mean and skewness, the respective AUCs on ADCb0-1000, ADCb0-750–1000, and ADCb0–500–750–1000 were similar (P < .05). In contrast, ADC mean and skewness on ADCb100–1000 could not distinguish HPV+ from HPV– OPSCC (P < .05).
Diagnostic performance of ADC maps capable of distinguishing HPV+ from HPV– OPSCC on the basis of ADC mean, skewness, and kurtosisa
The Online Supplemental Data show the same data as in Table 4 but with AUCs calculated with leave-one-out cross-validation and linear discriminant analysis as a model. Results were similar for all maps, albeit with slightly different thresholds.
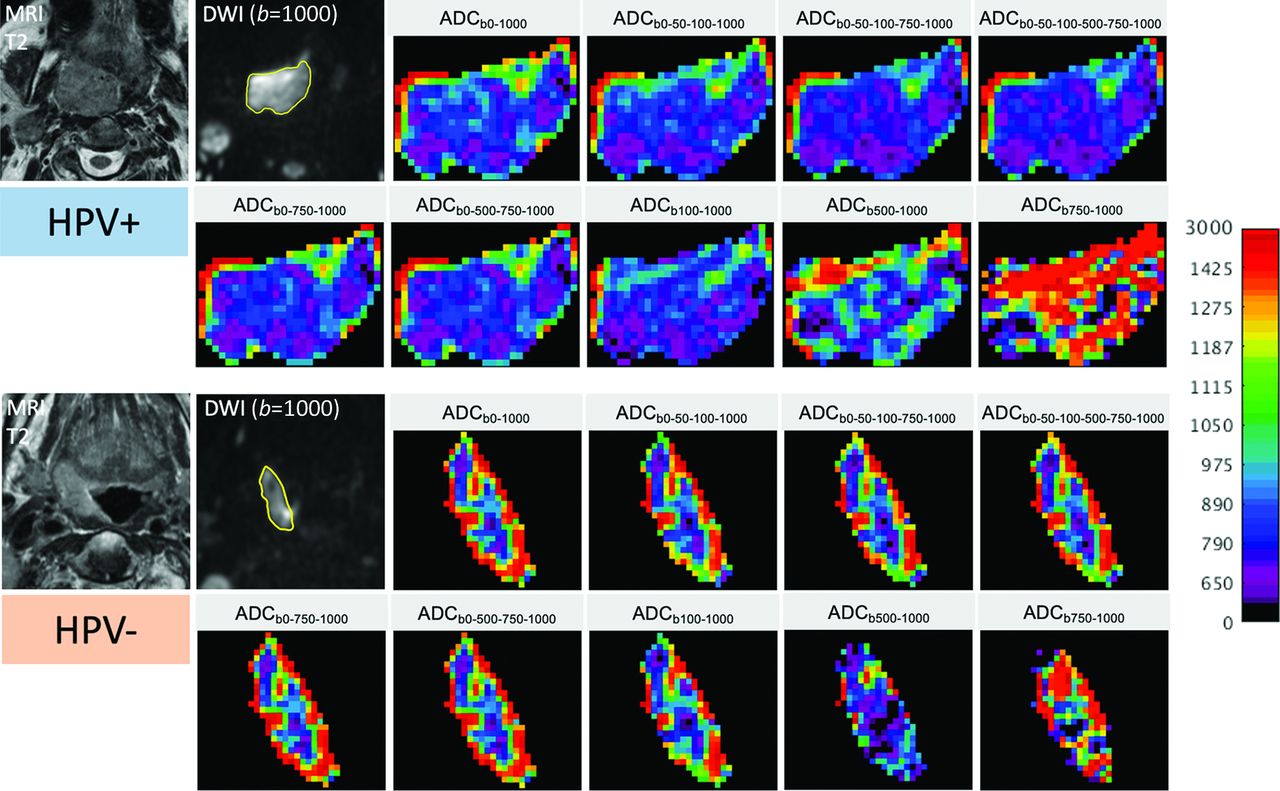
By means of the customized color map for all tumors, discrepant scores regarding the distinction between HPV+ and HPV– OPSCC were present in 10% of readings (31 of 306 ADC maps). These discrepant readings were solved by consensus. On the basis of a consensus reading, a clearly visible difference between HPV+ and HPV– OPSCCs was found on most ADC maps in terms of heterogeneity and ADC mean values; however, this difference disappeared on the perfusion-insensitive pure diffusion ADC maps calculated with b ≥ 500 (Fig 2). The AUC for visually distinguishing HPV+ from HPV– OPSCC (semiquantitative assessment by the 2 readers in consensus using a 5-point Likert score) was highest for ADCb0–1000 (AUC = 0 .723) and ADCb0–50–100-1000 (AUC = 0.715) and lowest for ADCb500–1000 (AUC = 0.649) and ADCb750–1000 (AUC = 0.514), respectively.

Color-coded maps in 2 different patients with OPSCC (same patients as in Fig 1) illustrating changes in ADC pixel values and distribution caused by the choice of b-values. T2 images and corresponding b=1000 images with tumor ROIs (in yellow) are shown on the left. The upper 2 rows on the right show the color-coded ADC maps of the HPV+ OPSCC, while the lower 2 rows show the respective maps of the HPV– OPSCC. For all images, the same color map with the same quantitative scale (0–3000 ×10−6mm2/s) was used to display the original gray levels. Note the clearly visible difference between HPV+ versus HPV– OPSCC on the ADC maps with b=0, with HPV+ OPSCC having lower ADCs and less ROI heterogeneity than HPV– OPSCC. This difference disappears on maps calculated with higher b-values only, and the distinction between the 2 tumor types is visually hardly possible on maps calculated with b ≥ 500. The 2 readers correctly identified the HPV+ and the HPV– OPSCC on the first 7 ADC maps; they failed, however, to correctly distinguish between the 2 tumor types on the last 2 ADC maps.
DISCUSSION
HPV+ OPSCC is a distinct tumor entity with a better treatment response in comparison with HPV– OPSCC.2,3 Several authors have pointed out that noninvasive analysis of tissue-specific parameters with DWI may have implications in the context of personalized treatment and follow-up concepts. Previous studies have indicated that quantitative analysis of textural ADC features may be a useful in vivo biomarker for the assessment of OPSCC, allowing a more comprehensive analysis of tumor tissue than localized biopsy.8,10 Our study focused specifically on OPSCC because from a clinical point of view, it appears important to investigate tumors from specific sites separately because their characteristics may vary and treatment may differ from one site to another. From a radiologic point of view, there is an interest in optimizing the performance of DWI sequences to better understand differences between HPV+ and HPV– OPSCC at pretreatment imaging and during follow-up while reducing time-consuming MR imaging protocols to the necessary minimum. The results published in the literature vary concerning the ability of ADC values to distinguish HPV+ OPSCC from HPV– OPSCC. Some authors have demonstrated significant differences between mean ADC values in HPV+ versus HPV– OPSCC,8⇓-10 and a recent meta-analysis based on 5 studies concluded that mean ADC values are lower in HPV+ OPSCC than in HPV– OPSCC.11 Other authors, however, could not confirm the usefulness of ADC quantification in the context of OPSCC.12,13
The results of our study indicate that the choice of b-values is extremely important in DWI sequences because some b-value combinations fail to successfully distinguish HPV+ from HPV– OPSCCs, whereas other combinations have a high diagnostic performance in this respect. In particular, using only b-values of ≥100 for ADC calculation appears to be ineffective regarding this specific question. ADC values calculated with high b-values only are perfusion-insensitive, whereas ADC values calculated with b=0 and b=1000 reflect mixed perfusion-diffusion phenomena. It, therefore, appears that the perfusion component of ADC calculation may actually play a more important role in distinguishing HPV+ from HPV– OPSCC than previously thought. Leaving out b=0 values from ADC calculation leads to significant changes in histogram metrics and, as a consequence, the ADC histograms in HPV+ and HPV– OPSCCs tend to overlap, thereby hindering distinction between the 2 tumor types (Fig 1). This finding may explain the conflicting results of previous studies because only EPI DWI protocols with b=0 reported differences in mean ADC values between HPV+ OPSCC and HPV– OPSCC, whereas those without b=0 did not. This perfusion-related effect is most pronounced on mean ADC and skewness, whereas excess kurtosis appears to be a more robust feature because it retains statistical significance on most ADC maps, including the ADCb100-1000 map (Table 3).
So far, only very few authors have reported a higher ADC excess kurtosis in HPV+ OPSCC compared with HPV– OPSCC.8,10 Our study confirms this observation. This higher excess kurtosis observed on most ADC maps can be explained by the fact that HPV+ OPSCCs tend to be more homogeneous tumors; therefore, the number of pixels with the same ADC value in a tumor ROI is higher than in the ROI of a more heterogeneous tumor with variable cellularity and variable amounts of keratinization and/or necrosis, such as HPV– OPSCS.8 In addition, it appears that the ADCb0–1000, ADC b0–750–1000, and ADC b0–500–750–1000 maps are the most robust to distinguish HPV+ from HPV– OPSCC as on these 3 maps, all studied parameters (mean, skewness, kurtosis) revealed significant differences between the 2 tumor types. Furthermore, when using a customized color scale to distinguish HPV+ from HPV– OPSCC, differences in ADC values and ROI heterogeneity were particularly well visualized on ADC maps with b=0, whereas both tumor types showed similar features on the perfusion-insensitive ADC maps calculated with b ≥ 500 (Fig 2). Finally, our study showed equally that by means of a classic monoexponential model, the acquisition of b=0 and b=1000 was sufficient for distinguishing HPV+ from HPV– OPSCC. Therefore, acquiring multiple b-values did not offer advantages in comparison with ADCb0-1000. This result has practical implications because it allows decreasing DWI acquisition times in clinical routine. The time invested in acquiring multiple b-values could thus be used for other sequences or to improve spatial DWI resolution.
Our study has several limitations, and some elements inherent in all methodologies of texture analysis may limit the reproducibility of our observations. First, technical parameters of MR imaging equipment may differ from one vendor to another, making direct comparisons difficult. Second, segmentation is an operator-dependent process and may lead to different definitions of ROIs. Third, the sample size in this study is small. Finally, the focus on OPSCC enhances clinical specificity, but it also limits data generalization to HNSCC arising from other sites. The data of the present study, which focused on primary OPSCC, showed that tumor heterogeneity as reflected by ADC maps can be influenced by the choice of b-values on EPI DWI sequences. Therefore, further work is needed to determine which microstructural tissue properties are precisely responsible for the observed differences. Future studies may also determine the place of the most appropriate b-value choice in ADC quantification for the follow-up of OPSCC.
CONCLUSIONS
Our study based on a small population of patients with OPSCC showed that ADC mean, skewness, and kurtosis derived from perfusion-sensitive ADC maps calculated with b=0 and b=1000 can distinguish HPV+ from HPV– OPSCC, whereas mean and skewness from ADC maps calculated with only b ≥ 100 values (perfusion-insensitive maps) cannot. The acquisition of multiple b-values did not improve differentiation of HPV+ from HPV– OPSCC.
Footnotes
This study was part of a clinical research project supported by the Swiss National Science Foundation under grant SNSF No 320030_173091/1.
Disclosure forms provided by the authors are available with the full text and PDF of this article at www.ajnr.org.
Indicates open access to non-subscribers at www.ajnr.org
References
- Received November 30, 2021.
- Accepted after revision March 26, 2022.
- © 2022 by American Journal of Neuroradiology


Jump to section
Related Articles
Cited By...
- No citing articles found.