
Abstract
BACKGROUND AND PURPOSE: Thrombectomy up to 24 hours after stroke onset in patients with specific ischemic brain volumes remains a challenge, because many stroke centers do not apply specialized software to calculate ischemic volumes at advanced imaging. We aimed to establish the association between relative filling time delay on CTP source imaging and ischemic volume parameters and the infarct penumbra to core volume mismatch in patients with acute ischemic stroke.
MATERIALS AND METHODS: Consecutive patients with acute ischemic stroke and with M1 segment MCA with or without terminal ICA occlusions on baseline CTA and CTP within 24 hours of stroke symptom onset were included. Ischemic volumes were analyzed with software based on CTP maps. Relative filling time delay was classified into 4 grades—grade 0: relative filling time delay = 0 seconds; grade 1: relative filling time delay >0 to ≤4 seconds; grade 2: relative filling time delay >4 to ≤8 seconds; and grade 3: relative filling time delay > 8 seconds. Differences in ischemic volume parameters among relative filling time delay grades were tested.
RESULTS: We recruited 138 patients (median age, 69 years; 62.3% male). Different median volumes of the infarct core (grade 0, 7.3 mL; grade 1, 23.3 mL; grade 2, 45.7 mL; grade 3, 135 mL [P < .001]) and the penumbra (grade 0, 47.6 mL; grade 1, 90 mL; grade 2, 110 mL; grade 3, 92 mL [P = .043]) were observed among relative filling time delay grades. Target mismatch (defined by the criteria of the DEFUSE 3 trial) was identified in 71.7% of the patients (99/138). A relative filling time delay grade ≤ 1 independently predicted target mismatch, with a sensitivity of 0.79 (95% CI, 0.7–0.87) and a specificity of 0.66 (95% CI, 0.49–0.8).
CONCLUSIONS: Relative filling time delay grade based on CTP source imaging is a simple and effective parameter for evaluating ischemic volumes and target mismatch in patients with acute ischemic stroke. Further studies that compare relative filling time delay grade with clinical functional outcomes are necessary.
ABBREVIATIONS:
- DAWN
- DWI or CTP Assessment with Clinical Mismatch in the Triage of Wake-Up and Late Presenting Strokes Undergoing Neurointervention with Trevo
- DEFUSE 3
- Endovascular Therapy Following Imaging Evaluation for Ischemic Stroke 3
- ICV
- infarct core volume
- rFTD
- relative filling time delay
- TMM
- target mismatch
The importance of estimating the ischemic core volume through advanced imaging for endovascular treatment selection in an extended time window was immediately recognized with the success of the DAWN (DWI or CTP Assessment with Clinical Mismatch in the Triage of Wake-Up and Late Presenting Strokes Undergoing Neurointervention with Trevo) trial1 and the DEFUSE 3 (Endovascular Therapy Following Imaging Evaluation for Ischemic Stroke 3) trial.2 Surrogate parameters calculated by specialized software (RAPID; iSchemaView) based on CT perfusion or MR imaging are currently recommended for selecting candidates for endovascular treatment between 6 and 24 hours after last known well.
CTP has been used in stroke trials for the triage of patients for reperfusion treatment on the basis of the target mismatch (TMM) between the volume of salvageable tissue (penumbra) and unsalvageable tissue (core) according to perfusion thresholds.3⇓-5 However, to the best of our knowledge, only 10 of 982 stroke centers in China use RAPID. For those hospitals who have no application of RAPID or other specialized software, it is not possible to select patients with TMM for endovascular treatment between 6 to 24 hours time window after stroke onset.
The relative filling time delay (rFTD) based on CTP source imaging and assessed in the Sylvian fissures represents the abundance of leptomeningeal collateral supply and is a simple and reliable visual rating method to quantify cerebral collateral circulation. Cao et al6 found that an rFTD ≤ 4 seconds independently predicted favorable clinical outcome and small infarction size after recanalization therapy (thrombolysis with or without thrombectomy) in patients with stroke with large vessel occlusion. Notably, rFTD is a visual method with no software requirement, which, in most hospitals, can be used by radiologists to quickly identify potential patientsfor thrombectomy. We aimed to establish the association of rFTD and ischemic volume parameters and infarct penumbra to core volume mismatch in patients with acute ischemic stroke.
MATERIALS AND METHODS
Patients
We identified patients with acute ischemic stroke from our prospectively recorded stroke data base who had presented to our institution between January 2012 and July 2019 within 24 hours of stroke symptom onset and received multimodal CT imaging before treatment. Patients with proximal MCA occlusion with or without ICA occlusion, in addition, were recruited for inclusion in our study. Demographic, clinical, and radiologic data were recorded and included age, sex, onset-to-CT time, blood pressure, and baseline NIHSS score. Risk factors, such as smoking history, hypertension, diabetes mellitus, hyperlipidemia, history of stroke or transient ischemic attack, and atrial fibrillation, were also recorded. The study was performed with the informed consent of the patients or their next of kin, and with ethics approval from the institutional review board of our institution.
CT Scanning and Image Processing
Whole-brain perfusion and angiography were performed at the time of the emergency before therapy by using a 256-section CT scanner (Brilliance iCT; Philips Healthcare) between January 2012 and March 2015, or by using a 64-section CT scanner (Discovery CT750 HD; GE Healthcare) between April 2015 and July 2019. A 40-mL bolus of nonionic contrast media was injected at a rate of 5 mL/s. CT scanning was initiated 5 seconds (Brilliance) or 7 seconds (Discovery) after a contrast agent bolus, as follows: Jog mode, 80 kVp/150 mAs (Brilliance) and shuttle mode, 80 kVp/220 mAs (Discovery); 13 cycles for 50 seconds (Brilliance) and 26 cycles for 34 seconds (Discovery); and 325 slices (Brilliance) or 312 slices (Discovery).
Imaging Analysis
CTA images were reviewed first to identify patients with complete occlusion of the MCA with or without ICA. For these patients, unprocessed CTP source imaging was reviewed on a standard PACS to identify the rFTD between the normal MCA Sylvian branches and the rFTD in the affected hemisphere. The rFTD was calculated as the time difference between the first appearance of contrast in each Sylvian fissure. The rFTD was divided into 4 grades—grade 0: rFTD = 0 seconds; grade 1: rFTD >0 to ≤4 seconds; grade 2: rFTD >4 to ≤8 seconds; grade 3: rFTD >8 seconds. Two raters (Y.L., L.Y.) were blinded to all clinical information and follow-up data at the time of reading the scans. Differences between the raters (Y.L., L.Y.) were reviewed by a senior neuroradiologist (W.C.) to determine consensus rFTD grade.
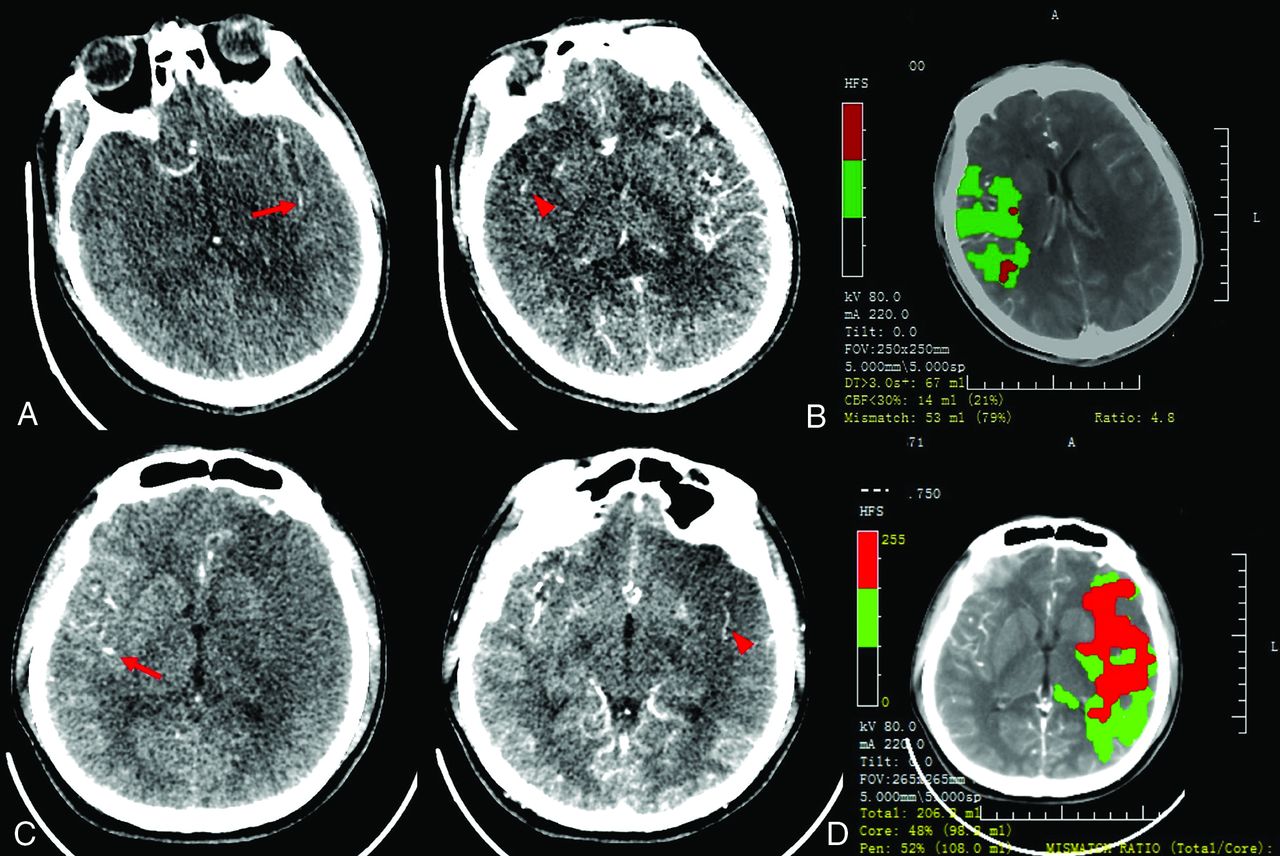
Ischemic volumes of the infarct core, penumbra, and hypoperfused lesion were calculated by commercial software MIStar (Apollo Medical Imaging Technology) based on CTP maps. The mismatch ratio was calculated as hypoperfused lesion volume to infarct core volume. “Target mismatch” was defined by using the imaging criteria of the DEFUSE 3 trial (hypoperfusion volume to infarct core volume [ICV] > 1.8, with an absolute ICV of <70 mL and absolute volume difference between the penumbra and the infarct core of >15 mL) (Fig 1).2

Case 1. A 46-year-old man with acute occlusion of the right MCA. CTP source imaging (SI) from a 256-section CT scanner showed that the first detection of contrast in the affected right hemisphere (red arrowhead) was delayed by 1 cycle (4 seconds for 1 cycle) after the first detection of contrast in the left Sylvian fissure (red arrow). The relative filling time delay (rFTD) was 4 seconds, which corresponds to a grade of 1 (A). Mismatch imaging calculated by software demonstrated a target mismatch between hypoperfusion volume (67 mL) and core volume (14 mL) (B). Case 2. A 24-year-old man with acute occlusion of the left MCA. CTP-SI from a 64-section CT scanner showed that the first detection of contrast in the affected left hemisphere (red arrowhead) was delayed by 5 cycles (1.3 seconds for 1 cycle) after the first detection of contrast in the right Sylvian fissure (red arrow). The rFTD was 6.5 seconds, which corresponded to a grade of 2 (C). Mismatch imaging showed a large core volume of 98 mL and no TMM (D).
Statistics Analyses
Statistical analyses were performed by using SPSS, Version 23 (IBM). P < .05 was considered to indicate statistical significance. Differences in patient characteristics and ischemic volume parameters among the rFTD grades were tested by using the χ2 test for categoric variables and the Kruskal-Wallis test for continuous variables. Receiver operating characteristic analysis was performed to determine the optimal threshold. Multivariate binary logistic regression was used to assess the association of rFTD grade ≤ 1 with TMM, ICV < 70 mL, and ICV < 51 mL. Predictors with P < 0.1 were included in multivariate binary logistic regression, whereas at least 5 outcome events for every predictor in each of the 3 final models was required to avoid overfitting.7 The area under the curve for each of the 3 multivariate models and for each of the 3 outcomes were calculated with receiver operating characteristic analysis. The agreement of rFTD grades between the observers was tested by using the intraclass correlation coefficient in total and by each CT scanner type. Differences in the intraclass correlation coefficients between the 2 CT scanner types were analyzed by using the Fisher Z-test.
RESULTS
Patient Characteristics
Between January 2012 and July 2019, 655 patients within 24 hours of stroke symptom onset received multimodal CT imaging before treatment. Of those, 138 patients (135 onset within 12 hours, 3 onset between 12 and ∼24 hours) with acute occlusion identified in the MCA with or without ICA occlusion were recruited. The median age was 69 years (interquartile range, 59–76 years), with 62.3% male (n = 86). There were 44.2% patients (n = 61) who underwent CTP on a 256-section scanner between January 2012 and March 2015 and 55.8% (n = 77) who underwent CTP on a 64-section scanner between April 2015 and July 2019.
Comparison of Ischemic Volume Parameters among rFTD Grades
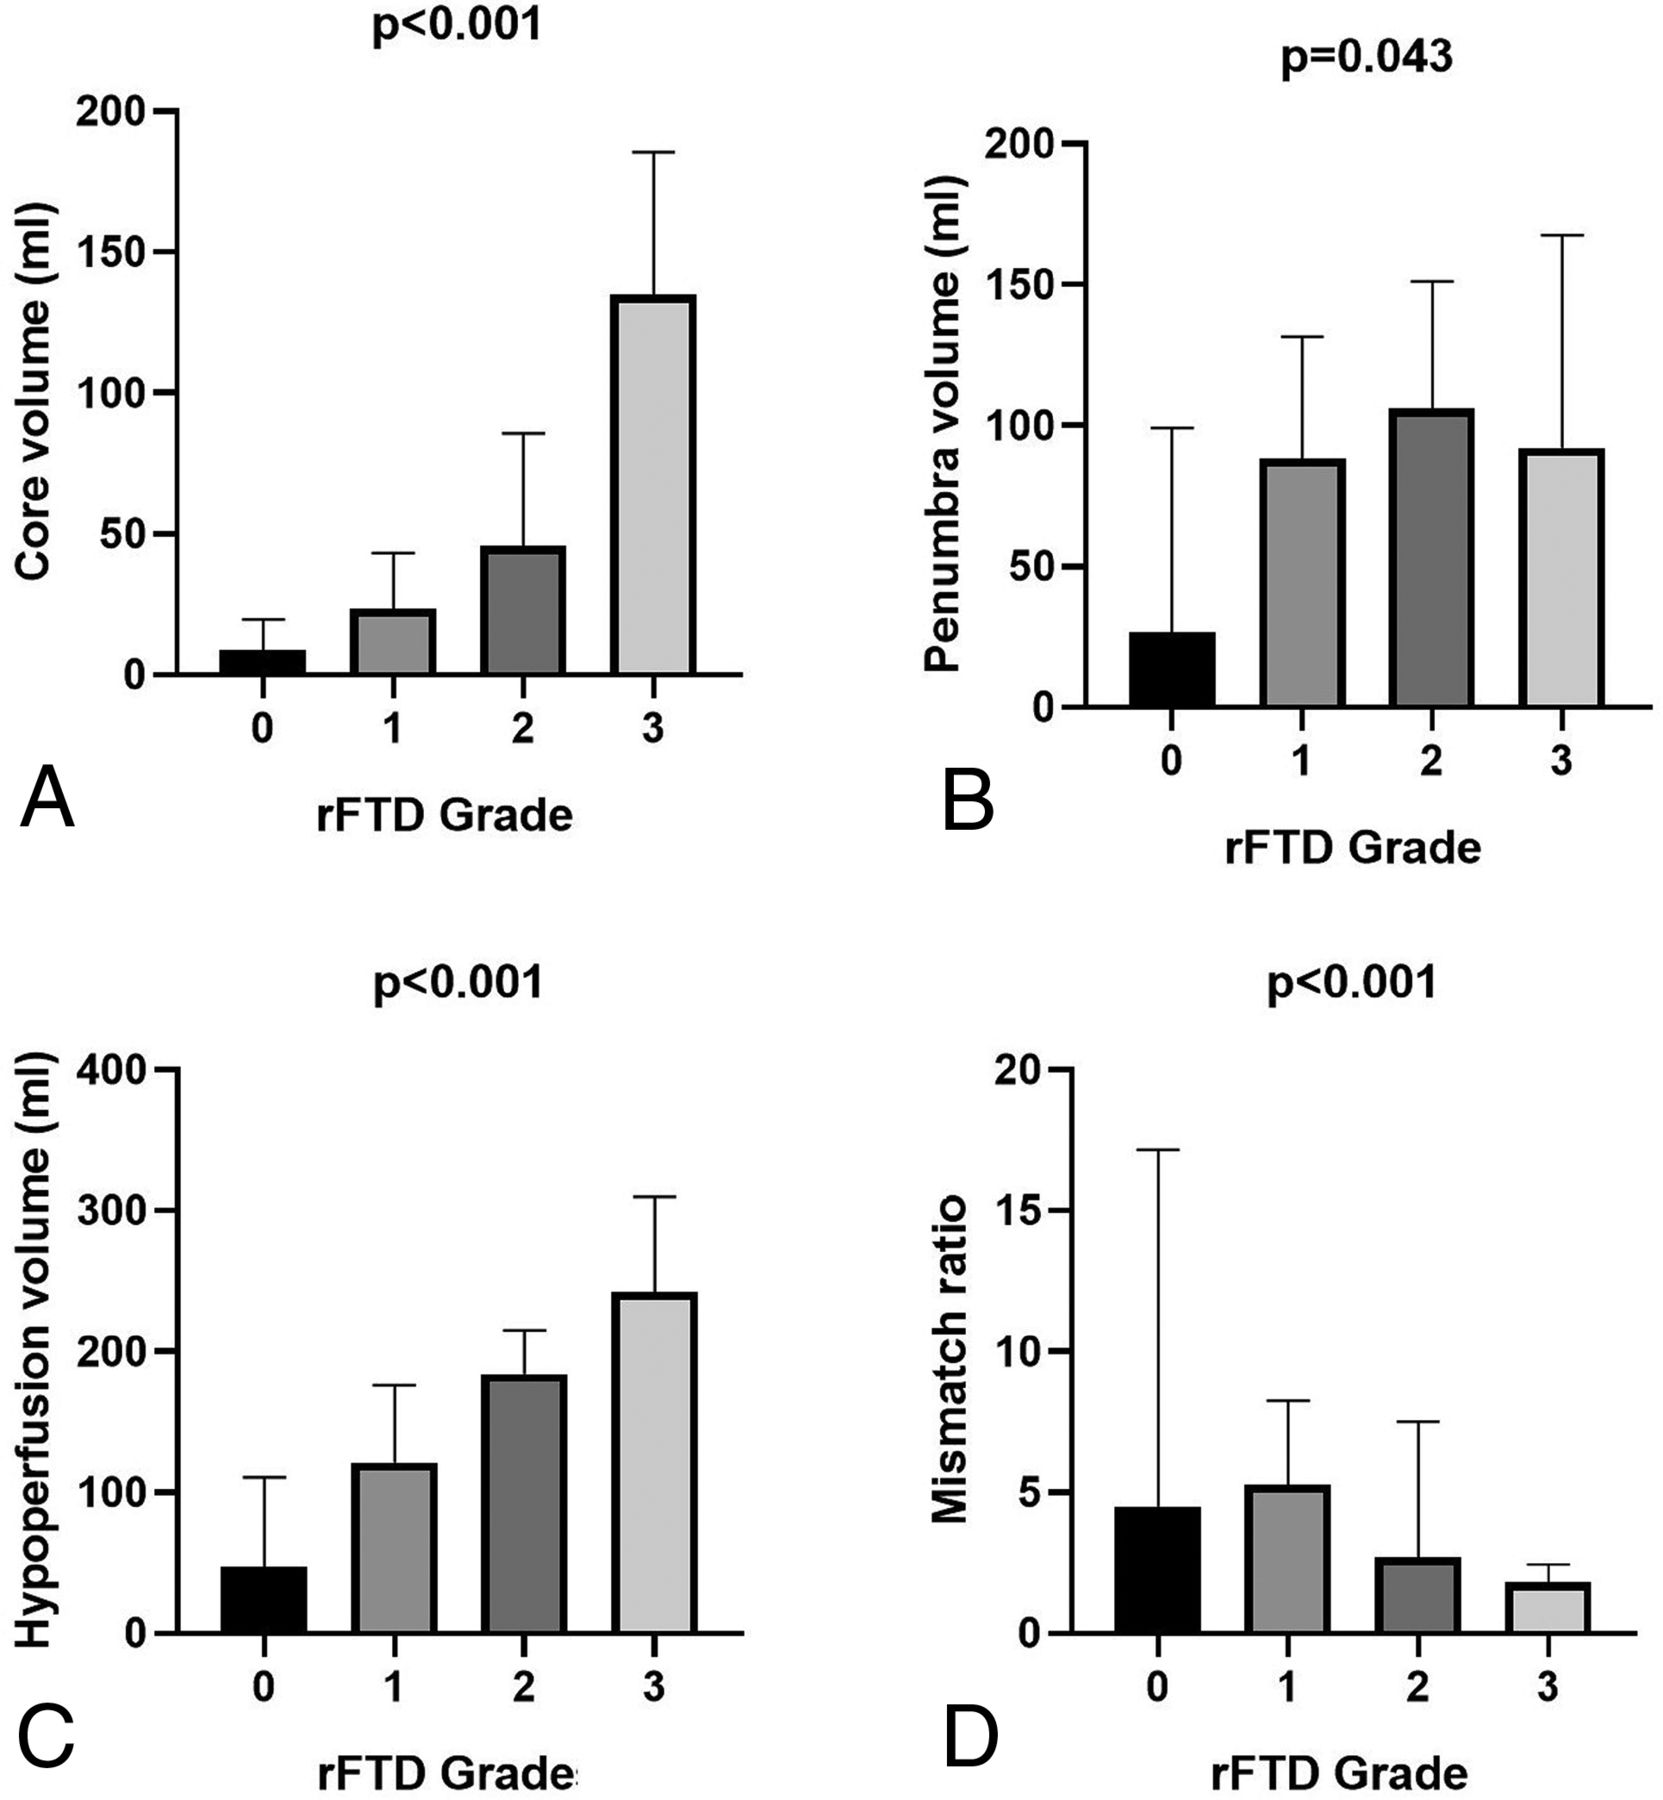
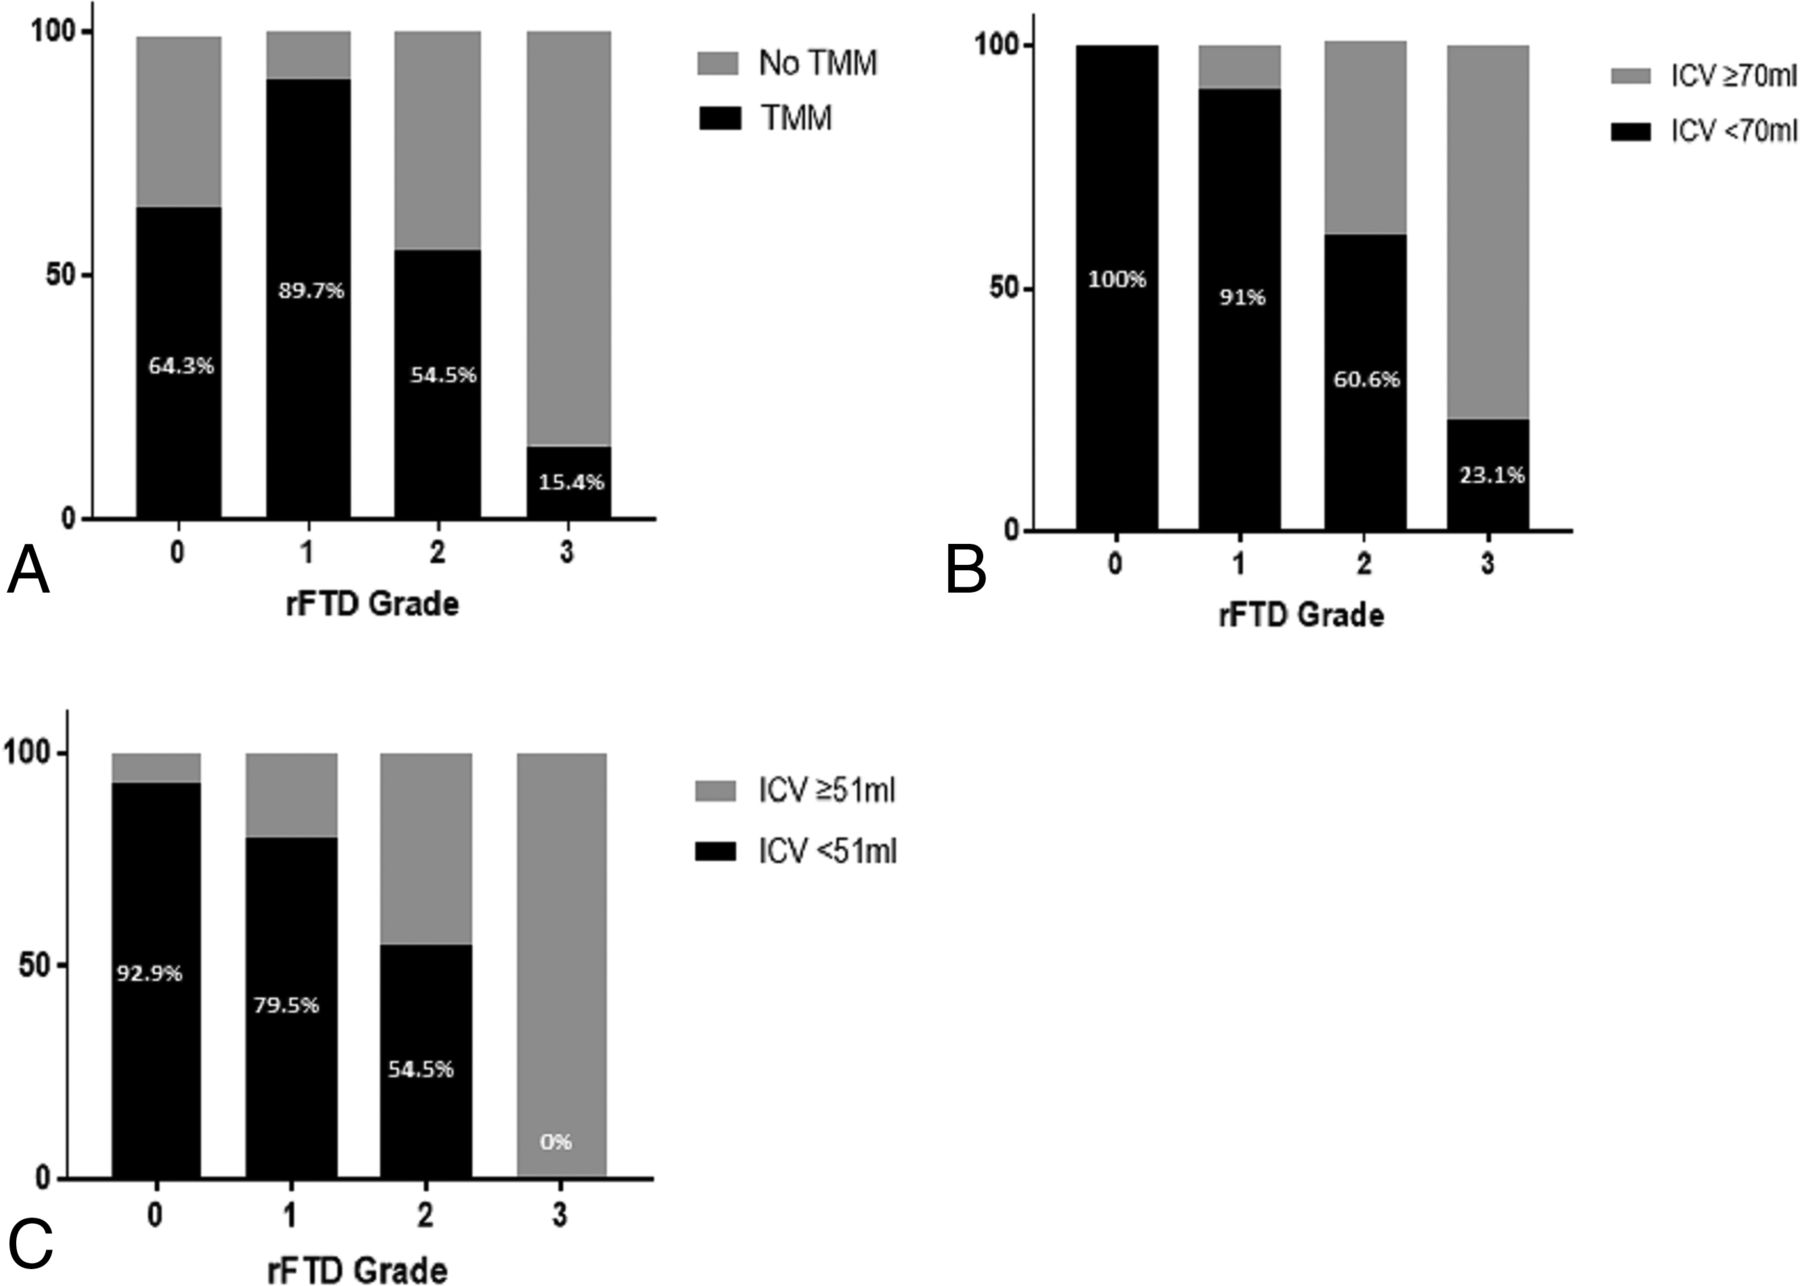
The characteristics of all the patients and patients stratified by rFTD grades are listed in Table 1. Different median ICVs (grade 0, 7.3 mL; grade 1, 23.3 mL; grade 2, 45.7 mL; grade 3, 135 mL [P < .001]), penumbra (grade 0, 47.6 mL; grade 1, 90 mL; grade 2, 110 mL; grade 3, 92 mL [P = .043]), hypoperfused lesion (grade 0, 55.5 mL; grade 1, 121.6 mL; grade 2, 186.5 mL; grade 3, 242 mL [P < .001]), and mismatch ratio (grade 0, 5; grade 1, 5.4; grade 2, 2.6; grade 3, 1.8 [P < .001]) were observed among the rFTD grades (Fig 2). The percentages of TMM (grade 0, 64.3% [n = 9]; grade 1, 89.7% [n = 70]; grade 2, 54.5% [n = 18]; grade 3, 15.4% [n = 2] [P < .001]), ICV < 70 mL (grade 0, 100% [n = 14]; grade 1, 91% [n = 71]; grade 2, 60.6% [n = 20]; grade 3, 23.1% [n = 3] [P <.001]), and ICV < 51 mL (grade 0, 92.9% [n = 13]; grade 1, 79.5% [n = 62]; grade 2, 54.5% [n = 18]; grade 3, 0 [n = 0] [P <.001]) were different among the rFTD grades (Fig 3).

Comparison of ischemic volume parameters, including infarct core (A), penumbra (B), and hypoperfusion (C), and the mismatch ratio of hypoperfusion to core volume (D) among relative filling time delay grades.

Percentages of target mismatch (A), infarct core volume < 70 mL (B), and ICV < 51 mL (C) among relative filling time delay grades.
Characteristics of all included patients and patients stratified by rFTD grade
Predictive Value of rFTD for TMM and ICV
In the receiver operating characteristic analysis, rFTD grade was associated with TMM (area under the curve 0.71; 95% CI, 0.6–0.83; P < .001), ICV <70 mL (area under the curve 0.81; 95% CI, 0.72–0.9; P < .001), and ICV <51 mL (area under the curve 0.76; 95% CI, 0.67–0.85; P < .001). The optimal thresholds determined by the Youden index were grade 1 for TMM, ICV < 70 mL, and ICV < 51 mL.
The patients were then dichotomized into positive versus negative TMM, ICV < 70 mL versus ≥ 70 mL, and ICV < 51 mL versus ≥51 mL (On-line Table). The patients with TMM were associated with a lower baseline NIHSS score (12.5 versus 19; P < .001) and a higher proportion of rFTD grades ≤ 1 (79.8% versus 33.3% ; P < .001). Patients with ICV < 70 mL were associated with a lower NIHSS score (13 versus 19; P < .001), a lower proportion of diabetes (27.8% versus 50%; P = .022), and a higher proportion of rFTD grades ≤ 1 (78.7% versus 23.3%; P < .001). The patients with ICV < 51 mL were associated with less hypertension (60.2% versus 77.8%; P = .041), a lower NIHSS (13 versus 18; P < .001), and a higher proportion of rFTD grades ≤ 1 (80.6% versus 37.8%; P < .001). The distribution of the site of arterial occlusion was different between ICV < 70 mL and ICV ≥ 70 mL (MCA, ICA, MCA + ICA: 70.4%, 25.9%, 3.7% versus 36.7%, 53.3%, 10%; P = .003) and between ICV < 51 mL and ICV ≥ 51 mL (MCA, ICA, MCA + ICA: 72%, 25.8%, 2.2% versus 44.4%, 44.4%, 11.1%; P = .003).
Multivariate Regression Analysis for TMM, ICV < 70 mL, and ICV < 51 mL
Multivariate regression analyses, including rFTD grades ≤ 1 and variables with prespecified univariate values of P ≤ .1, demonstrated areas under the curve of 0.83, 0.88, and 0.84 for predicting TMM, ICV < 70 mL, and ICV < 51 mL, respectively. After adjustment for confounding variables, rFTD grade ≤ 1 was independently associated with TMM (OR 6.25; 95% CI, 2.48–15.72; P < .001), ICV < 70 mL (OR 9.73; 95% CI, 3.11–30.35; P < .001), and ICV < 51 mL (OR 5.84; 95% CI, 2.3–14.83; P < .001). The rFTD grade ≤ 1 predicted TMM with a sensitivity of 0.79 (95% CI, 0.7–0.87) and a specificity of 0.66 (95% CI, 0.49–0.8), predicted ICV < 70 mL with a sensitivity of 0.78 (95% CI, 0.69–0.86) and a specificity of 0.76 (95% CI, 0.57–0.9), and predicted ICV < 51 mL, with a sensitivity of 0.8 (95% CI, 0.71–0.88) and a specificity of 0.62 (95% CI, 0.42–0.72) (Table 2).
Multivariate regression analysis of the independent association between rFTD grade ≤ 1 and TMM, ICV < 70 mL, and ICV < 51 mL
Reliability Assessment
The intraclass correlation coefficient of rFTD grades between the 2 observers was 0.83 in total, 0.92 in rFTD on 256-section and 0.76 on 64-section CT scanners, which represents excellent agreement.8 The difference in intraclass correlation coefficient between 256-section and 64-section CT scanners was significant, with a P < .001.
DISCUSSION
Our study demonstrates that rFTD grade is associated with ischemic brain volumes, including infarct core, penumbra, and hypoperfusion tissue, in patients with acute ischemic stroke and with anterior circulation large cerebral artery occlusion. The rFTD grade ≤ 1 (rFTD ≤ 4 seconds) is a good marker in predicting TMM, ICV < 70 mL, and ICV < 51 mL, with high sensitivities and specificities.
It is now well known that poor baseline collaterals are associated with a larger ischemic core and worse functional outcomes. The DAWN trial used mismatches between clinical and imaging (estimated ischemic core volume by using CTP or DWI up to 50 mL) parameters to determine endovascular treatment candidacy between 6 and 24 hours from symptom onset. The DEFUSE 3 trial used perfusion-core mismatch and a maximum core size estimated up to 70 mL as imaging criteria to select patients with anterior circulation large vessel occlusion 6–16 hours from symptom onset. Our study established the associations between rFTD grade with 2 thresholds of ICV (<70 mL and <51 mL) and TMM (defined with the imaging criteria of the DEFUSE 3 trial). This assessment of rFTD grade on CTP source imaging can predict ICV and TMM without the need for dedicated software solutions while reducing the time required for computer data processing.
Automated CTP software is limited by the incidence of unreliable generation, for example, RAPID software was reported to fail to form perfusion maps in 3% to ∼13% of patients.9⇓-11 Unreliable automated CTP maps are mainly due to contrast bolus flow issues and motion artifacts. Dehkharghani et al12 reported that 8.1% of patients had uninterpretable automated CTP maps strictly due to motion artifacts. However, assessing rFTD based on CTP source imaging is robust to motion in patients who are uncooperative. Because rFTD is normalized to contralateral delay, factors such as contrast injection and cardiac output, which affect the absolute delay to filling, are negated. These characteristics can make the assessment of rFTD feasible in patients with various conditions and can serve as an alternative solution when automated software fails to generate reliable CTP maps.
A previous study suggested that rFTD ≤ 4 seconds independently predicts a favorable clinical outcome and small size of the infarction after recanalization therapy.6 However, thus far, few clinical trials have used this marker to evaluate collateral status before treatment. The association between ischemic volume parameters and rFTD ≤ 4 seconds is unclear. Thus, we analyzed the predictive power of rFTD grade ≤ 1 (equal to rFTD ≤ 4 seconds). We found that the sensitivities of rFTD grade ≤ 1 in predicting the 3 imaging criteria were very similar, whereas the specificity decreased (from high to low specificity) in the sequence of ICV < 70 mL, TMM, and ICV < 51 mL. Lower specificity of rFTD grade ≤ 1 for the prediction of TMM can be explained by the definition of TMM in the DEFUSE 3 trial, which required a mismatch ratio of >1.8 and an absolute volume between the penumbra and the infarct core > 15 mL in addition to an ICV < 70 mL. These criteria may potentially exclude patients who have excellent collateral flow, with very low ischemia tissue volume but are unable to achieve TMM.
Software packages can under- or overestimate ischemic volumes. A recent analysis of the accuracy of predicting final infarct volume by using RAPID demonstrated that RAPID corresponded to a median absolute error (9 mL) and overestimated the core volume in a few cases.13 Core volume may be overestimated in cases of ultra-early reperfusion. In the International Stroke Perfusion Imaging (INSPIRE) registry, which relied on MIStar automated perfusion software, the optimal CTP threshold for estimating the ischemic core volume was different for patients treated by thrombectomy (regional cerebral blood flow [rCBF] < 20%) versus patients treated with alteplase alone (rCBF < 30%).14 In addition, ischemic penumbra may be misclassified due to either technical or flow-related patterns. Most of the fully automated software packages do not have adequate postprocessing tools to subtract the miscalculated volumes, including skull base penumbral artifacts.9 Tools are needed in the manual (nonautomated) versions of CTP when artifacts are recognized. As a visual method, rFTD can serve as a quick double-check when errors in processing are suspected and could, consequently, increase radiologist confidence.
The time for RAPID processing was constant for each site based on the exact acquisition protocol and hardware configuration, with a median across the range of scanner platforms at the 20 trial sites of 5 minutes 20 seconds (range, 3–10 min).9 However, in our protocol, rFTD requires no more than 1 minute of evaluation by a clinician, which reduces the time required for radiologic assessment.
There are several available clinical rating scales that have been designed to assess the collateral status of stroke while also predicting clinical outcome and infarct size. Multiphase CTA is an imaging tool that provides 3 time-resolved images of pial arterial filling, captured 8 seconds apart, over the whole brain. A previous study established the value of multiphase CTA in predicting ICV.15 However, collateral flow filling with a relative delay time shorter than 8 seconds cannot be distinguished by using multiphase CTA. The rFTD grading that we derived is characterized by a range of 4 seconds between each grade, which allows more precise assessment of collateral flow.
In this study, we found that the interrater reliability of rFTD was impacted by the time of each scanning cycle according to different CT scanners and scanning modes. Jog mode on 256-section CT requires ∼4 seconds per cycle (13 cycles for 50 seconds), whereas shuttle mode on 64-section CT requires only 1.3 seconds per cycle (26 cycles for 34 seconds). Shorter cycle times make it more challenging for observers to determine the earliest appearance of contrast filling in the Sylvan fissure and to rate the rFTD. For example, in our study, the raters had less confidence in determining whether the rFTD was 3.9 seconds (grade 1) or 5.2 seconds (grade 2) when using the shuttle mode of 64-section CT than in determining whether the rFTD was 4 seconds (grade 1) or 8 seconds (grade 2) when using the Jog mode of a 256-section CT scanner. Jog mode contributes to a higher interrater reliability of rFTD grade, though the precision of rFTD is lost. The rFTD cannot be assessed within the range of 4 seconds, which may cause more information pertaining to early collateral flow in acute stroke to be lost.
Our study is limited by the small and selected population of patients with ischemic stroke with large artery occlusion in the anterior circulation. In our study, most patients (135/138) exhibited onset within 12 hours, whereas only 3 patients exhibited onset between 12 and ∼24 hours. The non-normal distribution of onset time among the included patients may potentially impact the result. Also, the agreement between the raters in grading rFTD could have been impacted by the scanning mode of CTP. A shorter scanning cycle time brings about more challenges for raters in determining the time point of the earliest contrast appearance in the Sylvan fissure.
CONCLUSIONS
The rFTD grade based on CTP source imaging is a simple and effective tool for evaluating ischemic volume parameters and TMM in patients with acute ischemic stroke without the need for any special software. Future studies are needed to evaluate the use of the rFTD grade for selecting patients in the appropriate time window for comparison with selection by specialized software and to prospectively study the clinical outcomes of these patients.
References
- Received February 4, 2020.
- Accepted after revision June 10, 2020.
- © 2020 by American Journal of Neuroradiology


Jump to section
Related Articles
Cited By...
- No citing articles found.