
Abstract
BACKGROUND AND PURPOSE: Increased contrast enhancement has been used as a marker of malignant transformation in low-grade gliomas. This marker has been found to have limited accuracy because many low-grade gliomas with increased contrast enhancement remain grade II. We aimed to investigate whether MR spectroscopy can contribute to the diagnosis of malignant transformation in low-grade gliomas with increased contrast enhancement.
MATERIALS AND METHODS: Patients with low-grade gliomas who had contemporaneous MR spectroscopy and histopathology for tumor regions with increased contrast enhancement between 2004 and 2015 were retrospectively reviewed. Clinical data collected were sex and age, Karnofsky Performance Scale, histologic subtypes, isocitrate dehydrogenase 1 mutation status, disease duration, adjuvant therapy, and post-radiation therapy duration. Imaging data collected were contrast-enhancement size, whole-tumor size, MR spectroscopy metabolite ratios, and tumor grades of regions with increased contrast enhancement. Diagnostic values of these factors on malignant transformation of low-grade gliomas were statistically analyzed.
RESULTS: A total of 86 patients with 96 MR spectroscopy studies were included. Tumor grades associated with increased contrast enhancement were grade II (n = 42), grade III (n = 27), and grade IV (n = 27). On multivariate analysis, the NAA/Cho ratio was the only significant factor (P < .001; OR, 7.1; 95% CI, 3.2–16.1) diagnostic of malignant transformation. With 0.222 as the cutoff value, the sensitivity, specificity, and accuracy of NAA/Cho for diagnosing malignant transformation were 94.4%, 83.3%, and 89.6%, respectively.
CONCLUSIONS: MR spectroscopy complements conventional MR imaging in the diagnosis of malignant transformation in a subgroup of low-grade gliomas with increased contrast enhancement.
ABBREVIATIONS:
- LGG
- low-grade glioma
- MT
- malignant transformation
- WHO
- World Health Organization
Low-grade gliomas (LGGs) are grade II World Health Organization (WHO) primary brain tumors, accounting for 14.6% of gliomas in population-based studies.1 LGGs may remain clinically and radiographically stable for years after initial diagnosis and treatment. However, at an unpredictable time, some may show MR imaging features suggestive of disease progression, eg, enlargement of nonenhancing tumor and an increase of enhancement on postgadolinium T1-weighted images. At the time of imaging progression, the tumors may remain WHO grade II or may have progressed to WHO grade III or IV, ie, malignant transformation (MT). Definitive diagnosis of MT requires histopathologic examination, but due to potential surgical risk and costs, increased contrast enhancement is frequently used as a surrogate marker for MT in clinical practice, research studies, and clinical trials of LGG. In the widely used Response Assessment in Neuro-Oncology criteria,2 an increase of enhancement is also regarded as MT, thus disease progression.
However, a recent study showed that up to 18% of LGGs with increased contrast enhancement remained WHO grade II.3 Despite having a sensitivity of 92%, increased contrast enhancement had a specificity of 57% for the detection of MT. Besides, increased contrast enhancement may also be due to treatment-related changes.4,5 In a consensus article recently published by the Society for Neuro-Oncology and the European Association of Neuro-Oncology,6 the limited accuracy of increased contrast enhancement as an indicator of MT in LGGs has also been recognized. Therefore, using increased contrast enhancement as a marker of MT may result in overtreatment of patients whose tumors remain low-grade, errors in the results of research studies, and misinterpretation of clinical benefits of new therapies. In light of the limited implications of increased contrast enhancement, it is crucial to search for imaging markers that can diagnose MT accurately.
Conventional MR imaging sequences such as T1WI, T2WI, FLAIR, and postcontrast T1WI provide only anatomic information. In contrast, proton MR spectroscopy (MRS) offers unique metabolic information of brain tumor biology and enables quantitative assessment of tissue metabolites such as Cho (a marker of cellular membrane turnover), Cr (a marker of energetic systems and intracellular metabolism), NAA (a marker of neuronal and axonal viability and density), lactate (a marker of anaerobic metabolism), and lipids (a marker of cellular breakdown or necrosis).7 MR spectroscopy is used as an adjunct to conventional MR imaging because it helps in differentiating brain tumor from other lesions, identifies optimal biopsy sites in heterogeneous gliomas, monitors treatment response, and differentiates treatment-related changes and tumor recurrence.8
Previous studies have demonstrated the utility of MR spectroscopy in predicting or prognosticating MT and survival of those with LGGs.9-15 To the best of our knowledge, the role of MR spectroscopy in diagnosing MT among LGGs with increased contrast enhancement has not been investigated. In the present study, using histopathology as the criterion standard, we aimed to determine the value of MR spectroscopy to diagnose MT in a group of patients who had a prior diagnosis of LGG and an increase in contrast enhancement on follow-up MR imaging.
MATERIALS AND METHODS
Patients
This retrospective study was performed after institutional review board approval (Chang Gung Memorial Hospital). Patients were retrospectively selected from the brain tumor database of our institution if they met all the following criteria: 1) prior pathologic diagnosis of LGG with follow-up MR imaging studies performed between 2004 and 2015 showing increased contrast enhancement; 2) having undergone surgery due to increased contrast enhancement with a pathologic diagnosis of grade II, III, or IV glioma; 3) availability of MR spectroscopy from brain regions with increased contrast enhancement; and 4) confirmed removal of the brain regions with increased contrast enhancement on follow-up MR imaging.
Increased contrast enhancement was defined as emergence of new contrast enhancement in previously nonenhancing tumors or regions thereof, new separate lesions with contrast enhancement, or at least a 25% increase in the size of enhancement for tumors with enhancement at baseline. Baseline referred to the first follow-up MR imaging after the last operation. Increased contrast enhancement was confirmed by neuroradiologists who compared the baseline MR imaging and the one before the next operation. Patients with multiple operations for separate instances of increased contrast enhancement were included as long as they had not already experienced MT and each event of increased contrast enhancement was treated independently.
Histopathologic diagnosis was made by a board-certified neuropathologist according to the 2000 WHO classification of CNS tumors before 2007 and thereafter based on the 2007 WHO classification. Patients younger than 18 years of age at initial diagnosis or with a diagnosis of radiation necrosis due to increased contrast enhancement were excluded. Patients were also excluded if their MR spectroscopy showed poor spectral resolution or inclusion of normal-appearing brain or edema in the VOIs.
Clinical and Imaging Information
Patient medical records were retrospectively reviewed to collect clinical information including sex, age and Karnofsky Performance Scale score at the time of increased contrast enhancement, histologic subtypes (diffuse astrocytoma, oligoastrocytoma, or oligodendroglioma), isocitrate dehydrogenase 1 (IDH-1) mutation status, disease duration (time interval between first histopathologic diagnosis of LGG and increased contrast enhancement), adjuvant therapy received before increased contrast enhancement, post-radiation therapy duration (time interval between end of radiation therapy and increased contrast enhancement), and tumor grades associated with increased contrast enhancement.
The first follow-up MR imaging studies after the last operation were reviewed for baseline residual tumor. MR spectroscopy metabolites measured in brain regions with increased contrast enhancement were recorded. The size of the contrast enhancement was measured by determining the product of the largest diameter and its perpendicular length on single postcontrast transverse T1-weighted or MPRAGE images. The size of whole tumor, which included both enhancing and nonenhancing components, was measured on transverse FLAIR or T2-weighted images. If multiple lesions were present, the largest 3 were selected and their products were summed. Follow-up studies, either intraoperative or postoperative MR imaging, were reviewed to confirm removal of brain regions with increased contrast enhancement. All imaging reviews were performed by 2 neuroradiologists. Differences were resolved by consensus.
Conventional MR Imaging and MR Spectroscopy Protocols
Preoperative MR imaging and MR spectroscopy studies were performed on a single occasion using 1.5T (Magnetom Espree; Siemens) or 3T (Magnetom Tim Trio; Siemens) clinical MR imaging scanners. Intraoperative MR imaging studies were performed with a 1.5T unit (Magnetom Espree). Typical pulse sequences used included transverse T1WI (TR/TE, 250/2.46 ms; section thickness, 4 mm; gap, 1 mm; matrix, 256 × 256; and FOV, 220 × 220 mm), transverse T2WI (TR/TE, 4000/90 ms; section thickness, 4 mm; gap, 1; flip angle, 120°; echo-train length, 17; matrix, 512 × 358; and FOV, 220 × 220 mm), transverse and coronal FLAIR (TR/TE/TI, 8200/85/2500 ms; section thickness, 4 mm; gap, 1 mm; matrix, 320 × 256; and FOV, 220 × 220 mm), postcontrast T1WI in transverse, coronal, and sagittal planes as well as 3D-MPRAGE (TR/TE/TI, 2530/4.03/1100 ms; section thickness, 1 mm; matrix, 256 × 256; and FOV, 256 × 224 mm) with intravenous administration of 0.1 mmol per kilogram of body weight gadopentetate dimeglumine (Magnevist; Bayer HealthCare Pharmaceuticals).
To better guide VOI placement, we performed all MR spectroscopy studies after contrast medium administration. Postcontrast T1WI or MPRAGE in axial, coronal, and sagittal planes was used to define VOIs. The location of the VOIs was carefully chosen by an on-site neuroradiologist to include as much of the enhancing regions as possible and avoid inclusion of necrosis, cysts, hemorrhage, edema, calcifications, and normal-appearing brain. Single-voxel MR spectroscopy studies were performed using a point-resolved spectroscopy sequence with automated shimming and water suppression. For MR spectroscopy performed on 3T machines, the acquisition parameters were the following: TR/TE, 2000/135 ms; flip angle, 90°; voxel size, 15 × 15 × 15 mm3; average, 128. For MR spectroscopy performed on a 1.5T machine, the acquisition parameters were the following: TR/TE, 1500/135 ms; flip angle, 90°; voxel size, 16 × 18 × 20 mm3; average, 192. The levels of metabolites in the VOIs were determined using the workstation software (Leonardo; Siemens). Peak integrals were obtained using a Levenberg-Marquardt fitting routine for principal peaks including lactate, NAA, Cr, and Cho at 1.33, 2.02, 3.02, and 3.22 ppm, respectively. The peak-area metabolite ratios Cho/Cr, NAA/Cr, NAA/Cho, and lactate/Cr were calculated. Because NAA was not detectable in some patients, the Cho/NAA ratio was not calculated.
Statistical Analysis
Clinical and imaging factors thought to be associated with MT were analyzed by univariate analysis. Categorical variables were tested with χ2 analysis, and continuous variables were tested with the Student t test. Selected variables with P values < .05 by univariate analysis were subjected to multivariate analysis using logistic regression with a forward stepwise selection procedure. Odds ratios and 95% CIs were calculated to demonstrate the relative risk of each significant factor for MT. Areas under the curve and cutoff values of statistically significant variables were determined by receiver operating characteristic curve analysis. Cutoff values with the highest sensitivity and lowest false-positive rates were chosen for the calculation of sensitivity, specificity, and accuracy of each significant variable. A commercially available statistical software package (SPSS 22; IBM) was used for analysis, and P values < .05 were considered a statistically significant difference.
RESULTS
Between 2004 and 2015, a total of 222 patients with LGGs were regularly followed up in our institution after initial diagnosis and treatment. On follow-up MR imaging studies, 139 patients had 161 instances of increased contrast enhancement and proceeded to an operation. Six instances with a pathologic diagnosis of radiation necrosis were excluded. For the rest of the 155 instances, the pathologic diagnosis was grade II diffuse glioma (n = 59), grade III (n = 53), and grade IV (n = 43). MR spectroscopy was available in 47 of 57 grade II, 34 of 52 grade III, and 29 of 43 grade IV gliomas. Among the 110 MR spectroscopy studies, 14 were excluded due to poor spectral resolution (2 grade II, 5 grade III, and 2 grade IV), inclusion of normal brain in VOIs (1 grade II and 1 grade III), or brain regions with increased contrast enhancement that were not removed (2 grade II and 1 grade III). Successful removal of brain regions with increased contrast enhancement was confirmed in 33 instances with intraoperative MR imaging, in 30 with postoperative MR imaging performed within 1 week, and in 33 with postoperative MR imaging performed between 2 and 12 weeks. The final study population consisted of 86 patients with 96 MR spectroscopy studies (42 grade II, 27 grade III, and 27 grade IV). Seventy-five MR spectroscopy studies were performed on 3T MR imaging, and 21, on 1.5T.
Clinical and imaging data are shown in Table 1. Among these 96 instances, 63 (65.6%) occurred in male patients. The mean age and Karnofsky Performance Scale scores at the time of increased contrast enhancement were 46.3 years (range, 20–83) and 89.5 (range, 50–100), respectively. Initial histologic subtypes were diffuse astrocytoma (n = 30), oligoastrocytoma (n = 27), and oligodendroglioma (n = 39). Eighty-one instances had baseline residual tumors. IDH1 mutation status was available in 68 (70.8%) instances with 61 (89.7%) being IDH1-mutant. Median disease duration was 5.2 years for those remaining with grade II, and 5.1 years for those with MT. Adjuvant therapy administered before an increase of contrast enhancement included radiation therapy (n = 75), Carmustine implants (n = 9), and temozolomide (n = 16). Median post-radiation therapy duration was 53.5 months (range, 3.5–206 months). NAA was not detectable in 3 instances of MT (1 grade III and 2 grade IV). Lactate was present in 14 (33.3%) instances that remained grade II and 21 (38.9%) of MT.
Clinical and imaging data of patients with low-grade gliomas demonstrating increased contrast enhancement
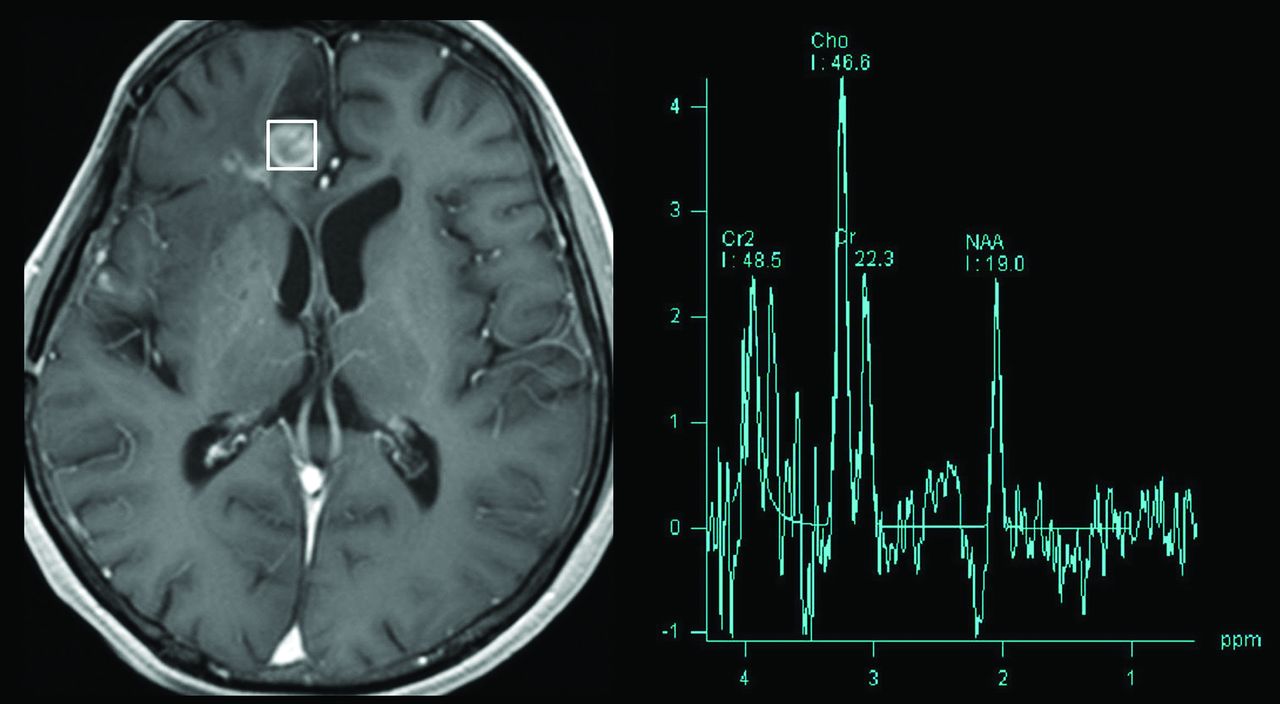
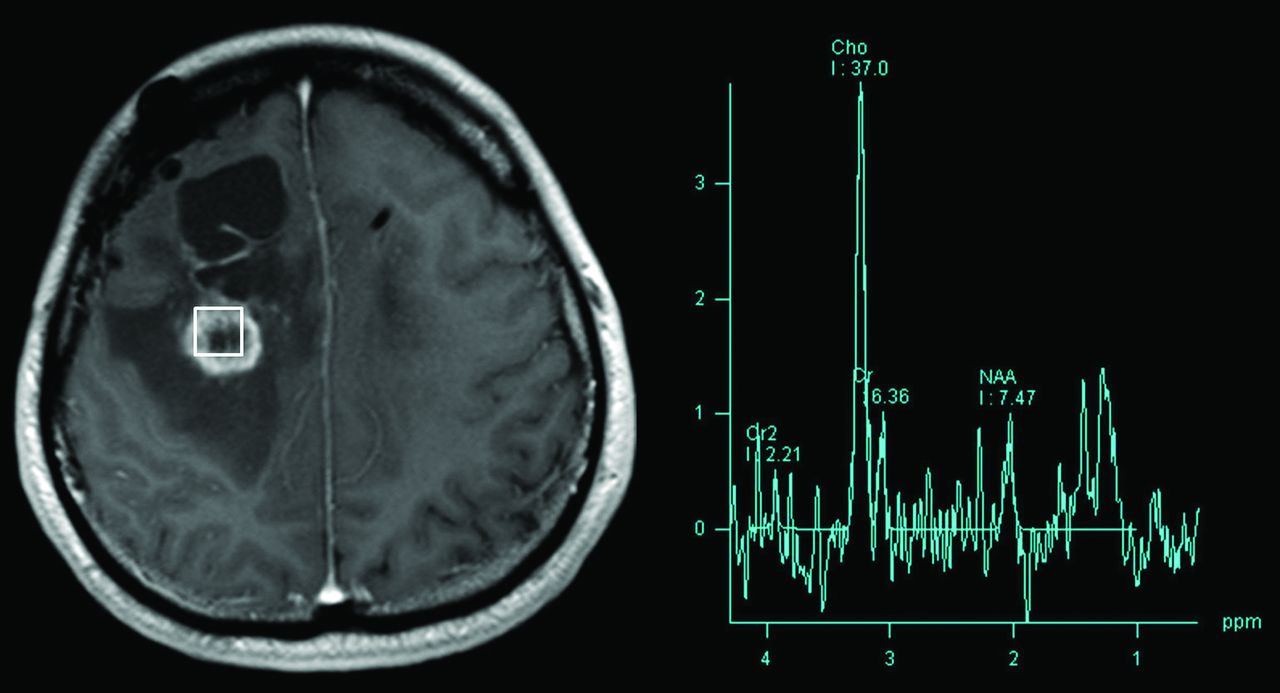
Table 2 illustrates the results of univariate analysis in which baseline residual tumor (P = .044) and previous adjuvant radiation therapy (P = .037) were associated with MT. LGGs with MT had significantly larger whole-tumor size (P = .007), larger contrast-enhancement size (P = .001), higher Cho/Cr ratio (P = .015), lower NAA/Cho ratio (P < .001), and lower NAA/Cr ratio (P = .033) compared with those without MT. Figures 1 and 2 illustrate measurements of metabolite levels in a LGG preserving grade II histology and an LGG with MT, respectively.

Measurement of metabolite levels using single-voxel MR spectroscopy in a low-grade glioma with increased contrast enhancement but preserved grade II histology. Transverse contrast-enhanced T1WI (left) shows an enhancing nodule in the right frontal lobe, posterior to the surgical cavity. A 15 × 15 × 15 cm3 VOI was placed over the enhancing brain region. Spectrum (right) obtained with TE = 135 ms shows an increase in the Cho peak and a decrease in the NAA peak. The NAA/Cho ratio is 0.41.

Measurement of metabolite levels using single-voxel MR spectroscopy in a low-grade glioma with increased contrast enhancement and malignant transformation. Transverse contrast-enhanced T1WI (left) shows an enhancing nodule in the right medial frontal lobe, posterior to the surgical cavity. A 15 × 15 × 15 cm3 VOI was placed over the enhancing brain region. Spectrum (right) obtained with TE = 135 ms shows an increase in the Cho peak and a decrease in the NAA peak. The NAA/Cho ratio is 0.20.
Univariate analysis of factors associated with malignant transformationa
On multivariate analysis, the NAA/Cho ratio (P < .001; OR, 7.1, 95% CI, 3.2–16.1) was the only variable predictive of MT among LGGs with increased contrast enhancement. On receiver operating characteristic curve analysis (Fig 3), the discriminative power of NAA/Cho measured with an area under the curve was 0.922 (P < .001; 95% CI, 0.86–0.98). With 0.222 as the cutoff value, the sensitivity, specificity, and accuracy of NAA/Cho in diagnosing MT were 94.4%, 83.3%, and 89.6%, respectively.

Receiver operating characteristic curve analysis of the diagnostic performance of the NAA/Cho ratio in differentiating LGG preserving grade II histology and LGG with MT.
DISCUSSION
Our study showed that among patients with a prior diagnosis of LGG, increased contrast enhancement on MR imaging can be seen in LGGs that remained grade II or those that underwent MT. NAA/Cho ratios measured in regions with increased contrast enhancement were significantly lower in LGGs with MT compared with those that remained grade II. Thus, the NAA/Cho ratio may diagnose MT among LGGs with increased contrast enhancement.
The median time to MT in the present study was 5.1 years, which correlates well with previous reports in which it ranged from 2.7 to 5.4 years.16,17 Previously identified prognostic factors for MT include older age, male sex, multiple tumor locations, tumor size ≥5 cm, adjuvant temozolomide, presence of residual tumor, astrocytoma histology, and IDH wild-type.16-18 However, in our study, none of these factors were helpful in making the diagnosis of MT. We speculate that this discrepancy could be due to different criteria for MT. In our study, MT was diagnosed with histopathology, while in other studies, a significant proportion of MT cases were diagnosed with only MR imaging.
Increased contrast enhancement has been used as an indicator of MT in several clinical guidelines for LGG.2,19,20 However, our results do not support this observation. In the present study, the percentage of LGGs that remained grade II despite having increased contrast enhancement was 37% (59 of 161), higher than the previously reported 18%.3 In a recent study, the sensitivity and specificity of increased contrast enhancement for diagnosing MT were 92% and 57%, respectively.3 Because of the low specificity, the authors suggested that histopathologic confirmation at the time of imaging progression should be attempted to guide subsequent therapy. However, an operation may not always be possible; therefore, noninvasive imaging markers play an important role in patient care. In our study, NAA/Cho was found to be diagnostic of MT and showed similar sensitivity (94.4%) but a higher specificity (83.3%).
Previous studies have tried to predict the outcome of LGG, particularly in the early course of the disease. Studies show that MR spectroscopy performed at baseline9,10 or at recurrence11,12 may predict progression-free survival and MT of LGG. MR spectroscopy may differentiate clinically stable LGGs from those that progress as a result of MT.14,15 The NAA/Cho ratio was found to be the best MR spectroscopy marker for LGG progression, with a sensitivity of 53.9%.13 The Cho/NAA ratio was shown to reliably differentiate recurrent glioma from post-radiation injury.4,5 Those studies demonstrated the potential of MR spectroscopy in prognosticating or predicting survival of those with LGG. However, their diagnostic and therapeutic impact on patient care was limited due to inconsistent MR spectroscopy techniques and variable methods of choosing VOI locations, and most important, many MT cases were not histologically proved. In our study, we investigated the diagnostic performance at the time of increased contrast enhancement. With histology as the criterion standard, we found that MR spectroscopy could diagnose MT with high diagnostic performance (area under the curve = 0.924).
We found that MR spectroscopy was useful for diagnosing MT. There were several reasons for this finding, including the use of a single-voxel technique. Precise measurements of metabolite levels in brain regions with increased contrast enhancement were essential for differentiation between LGGs with preserved grade II histology and those with MT. Therefore, spectral contamination by adjacent normal brain, edema, and fat should be minimized because it could introduce significant measurement errors. Compared with multivoxel MR spectroscopy, single-voxel MR spectroscopy has a shorter acquisition time, better shimming, a higher signal-to-noise ratio, and better spectral quality. Moreover, it is less susceptible to contaminations from adjacent tissues. In our study, MR spectroscopy was performed after administration of a gadolinium contrast medium because increased contrast enhancement better guides VOI placement, allows consistency in choosing the VOI location, and thus improves the reproducibility of metabolite measurements. Finally, locations of VOIs were decided by an on-site neuroradiologist, possibly helping to achieve good spectral quality.
In this study, patients with LGGs with increased contrast enhancement who did not proceed to an operation were excluded. Initially, this exclusion may appear as selection bias, but given the low specificity of increased contrast enhancement, this seeming limitation is actually the strength of our study. LGGs that progressed with only enlargement of nonenhancing tumors were not included in this study because they need different methods for choosing VOI location, and the MT rate for this group was 23%, much lower than the 82% for those with increased contrast enhancement.3 Although we did not perform image-guided tissue sampling, we reviewed the intraoperative or postoperative MR imaging studies to confirm removal of brain regions with increased contrast enhancement. This step decreases the chances of tumor grade misclassification. A trend toward lower myo-inositol levels in high-grade gliomas compared with low-grade gliomas was reported.21 Further studies using short-TE MR spectroscopy are needed to determine the utility of myo-inositol in diagnosing MT because our MR spectroscopy spectra obtained at a TE of 135 ms were not useful in demonstrating this metabolite. In the present study, NAA levels of LGGs with MT were lower than those that remained grade II. In some LGGs with MT, NAA was even undetectable. Therefore, NAA/Cho rather than Cho/NAA ratios were calculated. We speculate that a lower level or absence of NAA, which reflects more severe neuronal destruction, may be the principal metabolite change in MT. Further studies are needed to support our observations.
CONCLUSIONS
MR spectroscopy complements conventional MR imaging in the diagnosis of malignant transformation in a subgroup of low-grade gliomas with increased contrast enhancement. MR spectroscopy may reduce the need for an operation and help in clinical decision-making for low-grade gliomas with increased contrast enhancement.
Footnotes
This work was supported, in part, by grants from the National Science Council Taiwan (NSC98-2314-B-182A-051-MY3 and NSC101-2314-B-182-084 to C.H.T.).
Disclosures: Cheng Hong Toh—RELATED: Grant: National Science Council Taiwan, Comments: research grant.* *Money paid to institution.
Indicates open access to non-subscribers at www.ajnr.org
References
- Received February 18, 2020.
- Accepted after revision June 4, 2020.
- © 2020 by American Journal of Neuroradiology


Jump to section
Related Articles
Cited By...
- No citing articles found.