
Abstract
BACKGROUND AND PURPOSE: Fast and accurate quantification of globe volumes in the event of an ocular trauma can provide clinicians with valuable diagnostic information. In this work, an automated workflow using a deep learning-based convolutional neural network is proposed for prediction of globe contours and their subsequent volume quantification in CT images of the orbits.
MATERIALS AND METHODS: An automated workflow using a deep learning -based convolutional neural network is proposed for prediction of globe contours in CT images of the orbits. The network, 2D Modified Residual UNET (MRes-UNET2D), was trained on axial CT images from 80 subjects with no imaging or clinical findings of globe injuries. The predicted globe contours and volume estimates were compared with manual annotations by experienced observers on 2 different test cohorts.
RESULTS: On the first test cohort (n = 18), the average Dice, precision, and recall scores were 0.95, 96%, and 95%, respectively. The average 95% Hausdorff distance was only 1.5 mm, with a 5.3% error in globe volume estimates. No statistically significant differences (P = .72) were observed in the median globe volume estimates from our model and the ground truth. On the second test cohort (n = 9) in which a neuroradiologist and 2 residents independently marked the globe contours, MRes-UNET2D (Dice = 0.95) approached human interobserver variability (Dice = 0.94). We also demonstrated the utility of inter-globe volume difference as a quantitative marker for trauma in 3 subjects with known globe injuries.
CONCLUSIONS: We showed that with fast prediction times, we can reliably detect and quantify globe volumes in CT images of the orbits across a variety of acquisition parameters.
ABBREVIATIONS:
- ACD
- anterior chamber depth
- AVD
- average volume difference
- CNN
- convolutional neural network
- HD
- Hausdorff distance
- IGVD
- inter-globe volume difference
- WL
- window level
- WW
- window width
- MRes-UNET2D
- 2D Modified Residual UNET architecture
- HU
- Hounsfield unit
Open-globe injuries are traumatic full-thickness defects of the ocular wall. Although frequently diagnosed on clinical evaluation, open-globe injuries involving the sclera may not be obvious on clinical examination and require surgical exploration for definitive diagnosis and repair.1,2 When thorough ocular examination of the anterior segment is limited by periorbital edema and hemorrhage, blepharospasm, or hyphema, imaging can be helpful to establish the diagnosis of occult open-globe injury.3 CT is the preferred imaging technique for assessment of the extent and severity of suspected traumatic injury to the globe.4,5 Direct CT imaging findings include altered globe contours or volumes, evidence of scleral discontinuity, or intraocular foreign bodies or gas.6 An additional indirect imaging finding is alteration of anterior chamber depth (ACD), which may either be decreased or increased depending on anterior or posterior segment location of injury, respectively.7,8 However, CT has been shown to have low sensitivity for the detection of open-globe injury, ranging from 51%–79%, limiting its value as a screening tool.9⇓-11 In a case series specifically evaluating occult open-globe injuries, CT had similar low sensitivity ranging from 56%–68%.6
Accurate and reliable quantification of globe volumes in the event of an ocular trauma can provide clinicians with valuable diagnostic information.6 Manual segmentation of the globe contours by radiologists, though considered the criterion standard, is a time-consuming and labor-intensive process.12,13 Furthermore, it is also observer dependent. Automated techniques for globe detection can remedy the pitfalls of manual segmentation.14
Previous works have proposed the use of semiautomated and automated techniques to measure ocular volume from CT images in the context of surgical planning. Bekes et al12 proposed a geometric model–based segmentation of the globes along with lenses, optic nerves, and optic chiasms in CT images. Because of the lack of a criterion standard, they did not report Dice scores. However, they estimated accuracy using the simultaneous truth and performance-level estimation algorithm published by Warfield et al15 and reported mean sensitivity values of 97.41% and 98.04% and specificity values of 98.42% and 97.90% for the left and the right globes, respectively. Harrigan et al13 used optimized registration and fusion methods for a multi-atlas framework16 for automated detection of optic nerves along with eye globes and muscles on clinically acquired CT images. They reported mean Dice and Hausdorff distance (HD) of 0.84 and 5.27 mm, respectively. Another work by Aghdasi et al17 segmented the optic nerve, globe, and extraocular muscles for skull-based surgeries in a 2-step process. The approximate boundaries of the globe were first determined followed by 2D shape fitting of the voxels inside the boundary. On 30 publicly available datasets, they reported an average Dice of 0.81 and 0.79 and 95% HD of 3 mm and 2.89 mm for the right and the left globes, respectively.
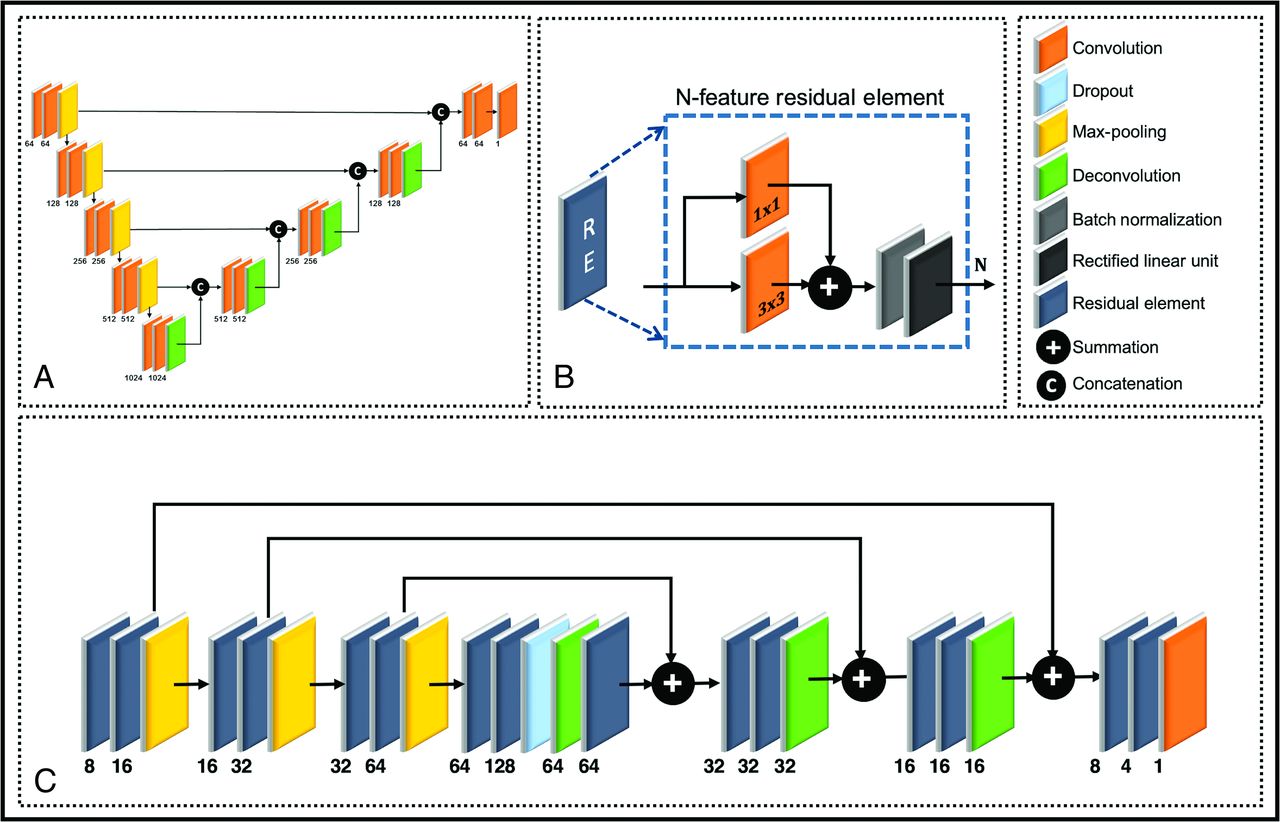
Convolutional neural networks (CNNs), widely popular in medical image segmentation tasks, are currently the state of the art in several object detection tasks.18⇓-20 UNET (Fig 1A),21 a fully connected deep learning CNN with its multiscale encoder–decoder type architecture, is a popular choice in many of these semantic segmentation problems. Another popular architecture, ResNet,22,23 is a single-scale setup that improves gradient back-propagation flow with increased speed of convergence24 by learning residual features.

A, Architectures for (A) a standard 2D UNET and (C) a Modified Residual UNET 2D (MRes-UNET2D). B, The multiscale architecture in MRes-UNET2D consists of a series of (B) residual elements at every resolution level. The contextual information is propagated by using a series of long-and short-range skip connections. The input to the architecture consists of preprocessed axial CT images of the orbits, and the output image contains contours for the left and right globes.
In this work, we combine the multiscale framework of UNET with elements that learn residual features and propose a fully automated workflow that allows for fast, accurate, and robust detection of globe contours. The proposed approach uses a deep learning–based CNN, 2D Modified Residual UNET architecture (MRes-UNET2D), and axial CT images of the orbits to predict globe contours, which are then used to quantify globe volumes.
MATERIALS AND METHODS
Convolutional Neural Network
Figure 1C shows the MRes-UNET2D used in this work. The network uses high-resolution 2D axial CT images of the orbits as inputs and yields contours for the globes, which are then used to compute globe volumes. The feature analysis path of the architecture uses a series of residual elements to generate multiscale abstract representations of the input images. The residual element used in our work,25 shown in Fig 1B, uses a convolution layer, a short-range skip connection, followed by batch-normalization26 and a rectified nonlinear activation. A dropout27 layer is introduced between the analysis and synthesis paths to improve regularization.
The synthesis path of the architecture allows accurate localization by reconstructing high-resolution feature maps while adding contextual information from the corresponding level in the analysis path using long-range skip connections. A final convolution layer combines the feature maps in the native resolution space to yield pixel-wise probability maps for the labels of interest. All convolutions in the main architecture consist of 2D convolution kernels with kernel size of 3 × 3.
Study Population and Imaging Protocol
A cohort of 107 consecutive CT orbit subjects (age, 45 ± 20 years; 63 men and 44 women) older than 18 years of age, imaged over a 3-year period between January 2015 and December 2017, were identified retrospectively with the approval of the local institutional review board. These subjects presented no imaging or clinical evidence of open-globe injuries. CT images from these subjects came from 3 different CT scanners from 2 different manufacturers, Aquilion (Toshiba Medical Systems) (77 subjects), Somatom Definition AS+ (22 subjects), and Somatom Definition Flash (Siemens) (8 subjects). CT images for each subject were acquired according to the following clinical protocol: 120 kVp, 150 mAs, matrix size of 512 × 512, field of view ranging from 125 to 240 mm, and in-plane resolution ranging from 0.25 mm to 0.46 mm. The section thickness used was either 1 or 2 mm.
Three observers, consisting of a neuroradiologist with certificate of added qualification and 2 residents, agreed on a protocol to mark the globe contours on the CT images by using an in-house Matlab (MathWorks)-based graphical user interface. This included manually tracing the boundary pixels of the globes on axial cross-sections while excluding eyelids, insertions of the extraocular muscles, and optic nerves. The observers used the sagittal cross-sections for reference. The graphical user interface provided the observers with tools to adjust the window level (WL), window width (WW), and zoom level, and edit or delete contours to accurately trace the boundaries at a pixel level. No further processing was done on the contours after they were finalized by the observers.
The subjects in our study were randomly split into 3 groups: 80 subjects in the training cohort, 18 subjects in test cohort 1, and 9 subjects in test cohort 2. To measure interobserver variability, each observer annotated the left and the right globe contours for subjects in test cohort 2, blinded to the annotations by others. A consensus observer was generated by using a majority voting scheme on the individual observer contours. The subjects in the training cohort and test cohort 1 were randomly split between the 3 observers.
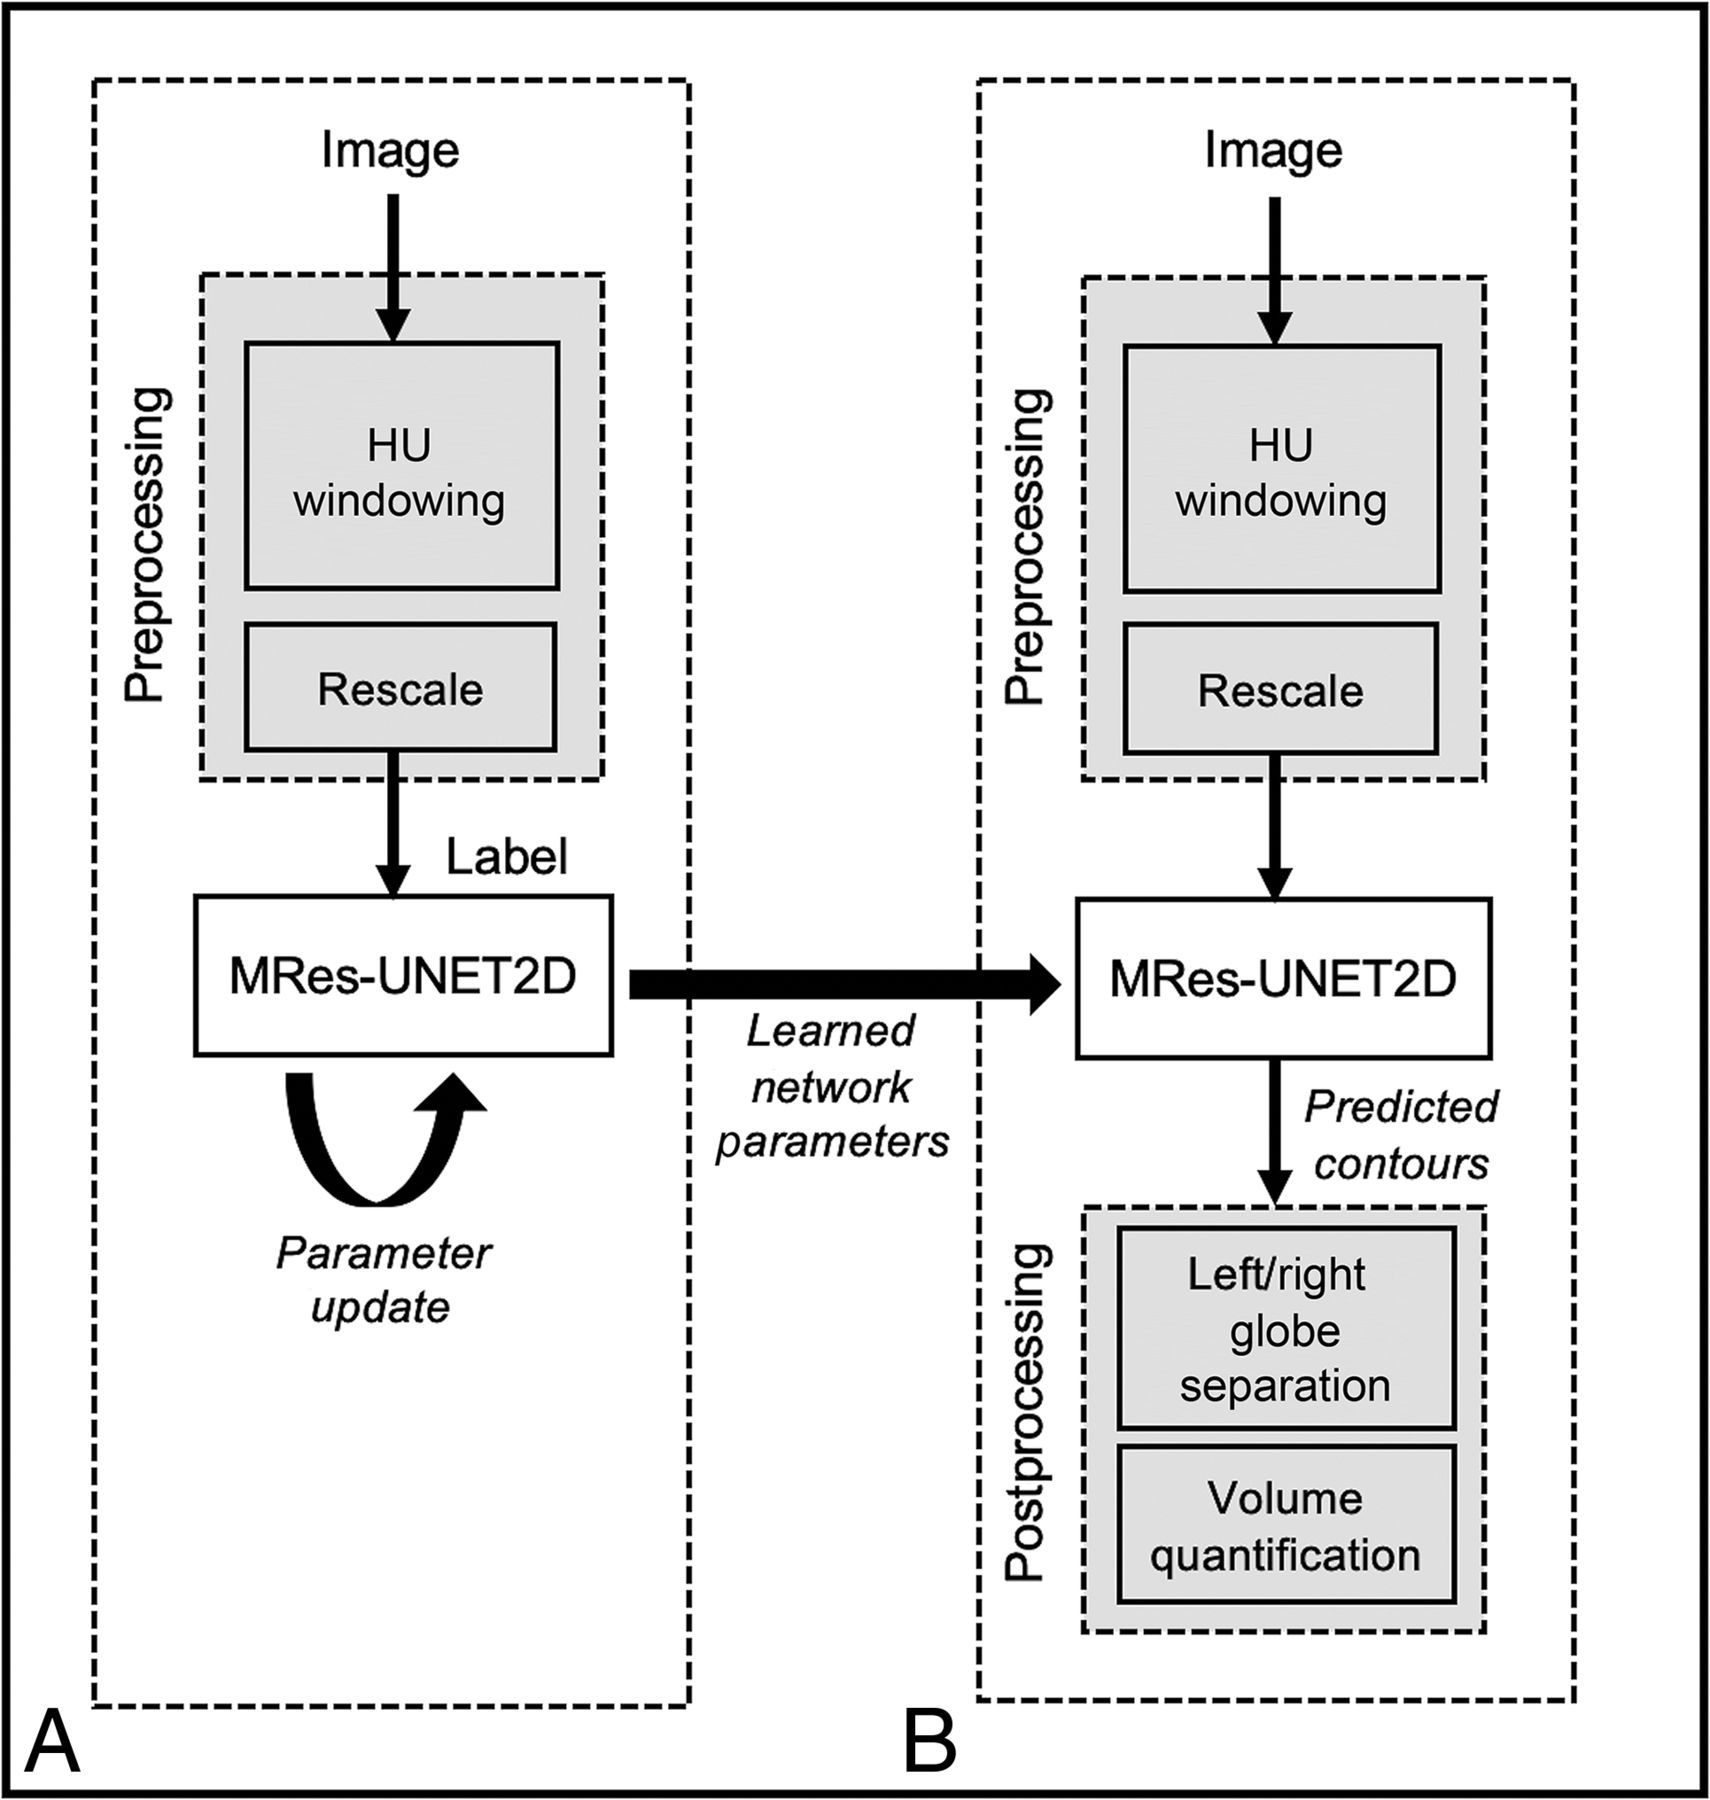
An overview of the proposed workflow is shown in Fig 2 for the training and test phases. All images undergo an image preprocessing step, which consists of adjusting the WW and WL to enhance soft tissue contrast between the globes, background muscle, and bone, followed by rescaling of image intensities for each subject to have intensities in the range of [0, 1].

A, Train phase and (B) test phase of the MRes-UNET2D architecture. The deep learning model’s parameters are updated by using image–label pairs in the training set. After the loss converges, the learned network parameters are used to predict the globe contours on test images.
From the 80 subjects in the training cohort, 74 subjects, with 2610 images, were used to train the deep learning model; 6 subjects, with 216 images, were used for validation. Data sampling was performed for an equal representation of images with and without globes in the training data. The following 2D augmentation schemes were used: random in-plane translations (±10 pixels in each direction), in-plane rotations selected uniformly from [−15°, 15°], left/right image flips, 2D elastic deformations, and image zoom. During the training process, augmented images were generated in run time on every training image batch. Any 3 of the aforementioned augmentation schemes were randomly selected, and an augmented image was generated by sequentially applying the selected schemes on each image in a training batch.
Network Implementation
A Dice similarity-based loss function was used to maximize the overlap between the predicted globe masks and the ground truth masks. We used the following definition of Dice loss:

Here,  and
and  refer to the ground truth and the predicted posterior values at the
  pixel, respectively.
Two different window settings were used to study the impact of Hounsfield unit (HU) windowing on model performance. The WL and WW ([WL, WW]) for the 2 experiments were selected to be [50, 200] and [0, 200] HU. In these experiments, the training images retained their original image resolutions, which ranged from 0.25 mm to 0.46 mm in-plane. We also trained an additional model in which all training image volumes were resampled to a common grid by using cubic spline interpolation. This was done to test if resampling the images to a common resolution provides any improvement to the performance of the model. The resolution for the common grid was obtained from the average resolution of the training set: 0.3 mm in-plane and 2-mm section thickness.
All experiments were implemented in Python by using Keras (https://keras.io) with TensorFlow28 computational backend. The training was performed on a Linux server running Ubuntu, with a Tesla P100 (NVIDIA) and 16-GB VRAM. The MRes-UNET2D architecture, with approximately 133,000 trainable weights, was trained with the following parameters: optimizer = ADAM,29 maximum epochs = 120, batch size = 5, learning rate = 1e−3, decay factor = 0.1. The learning rate was optimized for Dice loss by monitoring the training and the validation loss curves for convergence for a range of learning rates along with performance evaluation on the validation images. The MRes-UNET2D model used in this work is also available at https://github.com/spacl-ua/globe-volumes.
We also implemented a standard UNET21 architecture for comparison. The convolution layers were zero-padded, with 3 × 3 convolution kernels, to yield predictions, which were the same size as input. The cross-entropy loss function used in the original paper was modified to a binary cross-entropy loss for the binary classification problem. The training and the validation images for this UNET were the same as those used for training the MRes-UNET2D model with HU windowing set to [WL = 50, WW = 200]. The training parameters for UNET were as follows: optimizer = ADAM,29 maximum epochs = 120, batch size = 5, learning rate = 1e−3, and decay factor = 0.1.
Network Evaluation
The generalizability of the models was evaluated by using the following performance metrics: Dice, precision, recall, 95% HD, and volume difference. These evaluation metrics are defined as follows:


Here GT refers to the ground truth and P to the predictions from the network. The one-sided HD between point sets  and
and is
is . We used the 95th percentile (
 of HD, referred to as 95% HD, because it is slightly more stable to small outliers compared with taking the maximum value.
  and
and  refer to the total globe volumes computed from the predicted globe contours and ground truth for a subject, respectively. Higher values of Dice, precision, and recall imply good performance. Lower values of 95% HD imply smaller deviation in the predicted contour compared with the ground truth.
Pair-wise Dice similarity scores were calculated on test cohort 2 between the annotations from the 3 observers, the consensus observer, and the predictions from MRes-UNET2D. For each subject, we also calculated the inter-globe volume difference (IGVD), which is the volume difference in milliliters between the left and the right globe.

To test the generalizability of MRes-UNET2D on cases with suspected globe injuries, we also evaluated the model on 3 subjects with varying degrees of globe injuries, with conspicuity on CT imaging ranging from subtle to obvious. These 3 cases were outside of our study cohort and were identified by the radiologists retrospectively as test cases with globe injuries.
Statistical Analysis
A nonparametric Kruskal-Wallis test was performed to determine whether there were any significant differences in the performance of MRes-UNET2D between different image preprocessing settings. This test was repeated to compare for significant differences between the standard UNET and MRes-UNET2D. A 2-sided paired Wilcoxon signed rank test was performed to assess the null hypothesis that the difference in globe volumes predicted by MRes-UNET2D on test cohort 1 and ground truth annotations come from a distribution with zero median. The significance level was selected as .05 for all of these tests. A Bland-Altman analysis was performed to assess the agreement in the computed globe volumes per hemisphere between the human observers, MRes-UNET2D, and the consensus observer. To determine the variation between observers, reproducibility coefficient and coefficient of variation statistics were computed. We also tested for the null hypothesis that the IGVD values from MRes-UNET2D, consensus observer, and the 3 observers come from the same distribution by using the nonparametric Kruskal-Wallis test.
RESULTS
The training of our deep learning model, MRes-UNET2D, took approximately 5 hours. In the test phase, the end-to-end prediction time for a volume (512 × 512 × 40) was approximately 5 seconds on 2 NVIDIA P100 GPUs. The actual prediction time, excluding the pre- and postprocessing times, was approximately 680 ms per volume. Figure 3A shows representative axial CT images corresponding to 2 different window settings. The training and the validation loss curves for 1 instance of the MRes-UNET2D are shown in Fig 3B.

A, Representative axial CT images of the orbits with 2 different HU window settings [window level (WL), window width (WW)] = [50,200] (left) and [0,200] (right). B, Dice loss evolution curves over epochs for 1 of the MRes-UNET2D models.
A comparison of the effect of preprocessing on the performance of the MRes-UNET2D on test cohort 1 is shown in Table 1. The first 2 columns correspond to the different window settings. The third column shows the performance of the network when all images are resampled to a common grid of 0.3-mm resolution in-plane and 2-mm section thickness. Results of the nonparametric Kruskal-Wallis tests indicated that we were unable to reject the null hypothesis that the Dice scores (P = .39), average volume difference (AVD) (P = .57), or 95% HD (P = .87) from MRes-UNET2D for the different image preprocessing schemes come from the same distribution. Overall, we observe that slight variations in preprocessing did not result in any significant differences in model performance. For subsequent evaluations, we selected the model with windowing [50, 200] because on average, it yielded the smallest HD and AVD with improved Dice overlap scores among the 3 models.
Evaluation of MRes-UNET2D and UNET2D on test cohort 1 (n = 18)a
Figure 4 shows the manual annotation (red) and globe contour predictions from MRes-UNET2D (blue) on a few representative CT images. On average, MRes-UNET2D achieved Dice scores of 0.95 with respect to the ground truth, with high precision and recall values of 96% and 95%, respectively. The average 95% HD was only 1.5 mm, with a 5.3% error in the estimation of total globe volume. The 2-sided paired Wilcoxon signed rank test revealed no significant differences (P = .72) in the median globe volumes from the ground truth and MRes-UNET2D predictions on test cohort 1.

Globe contour predictions from MRes-UNET2D. The predicted contours are overlaid in blue on representative axial CT images of the orbits from 2 test subjects. The manual annotations are overlaid in red for reference. The inset shows a close-up comparison of the predictions.
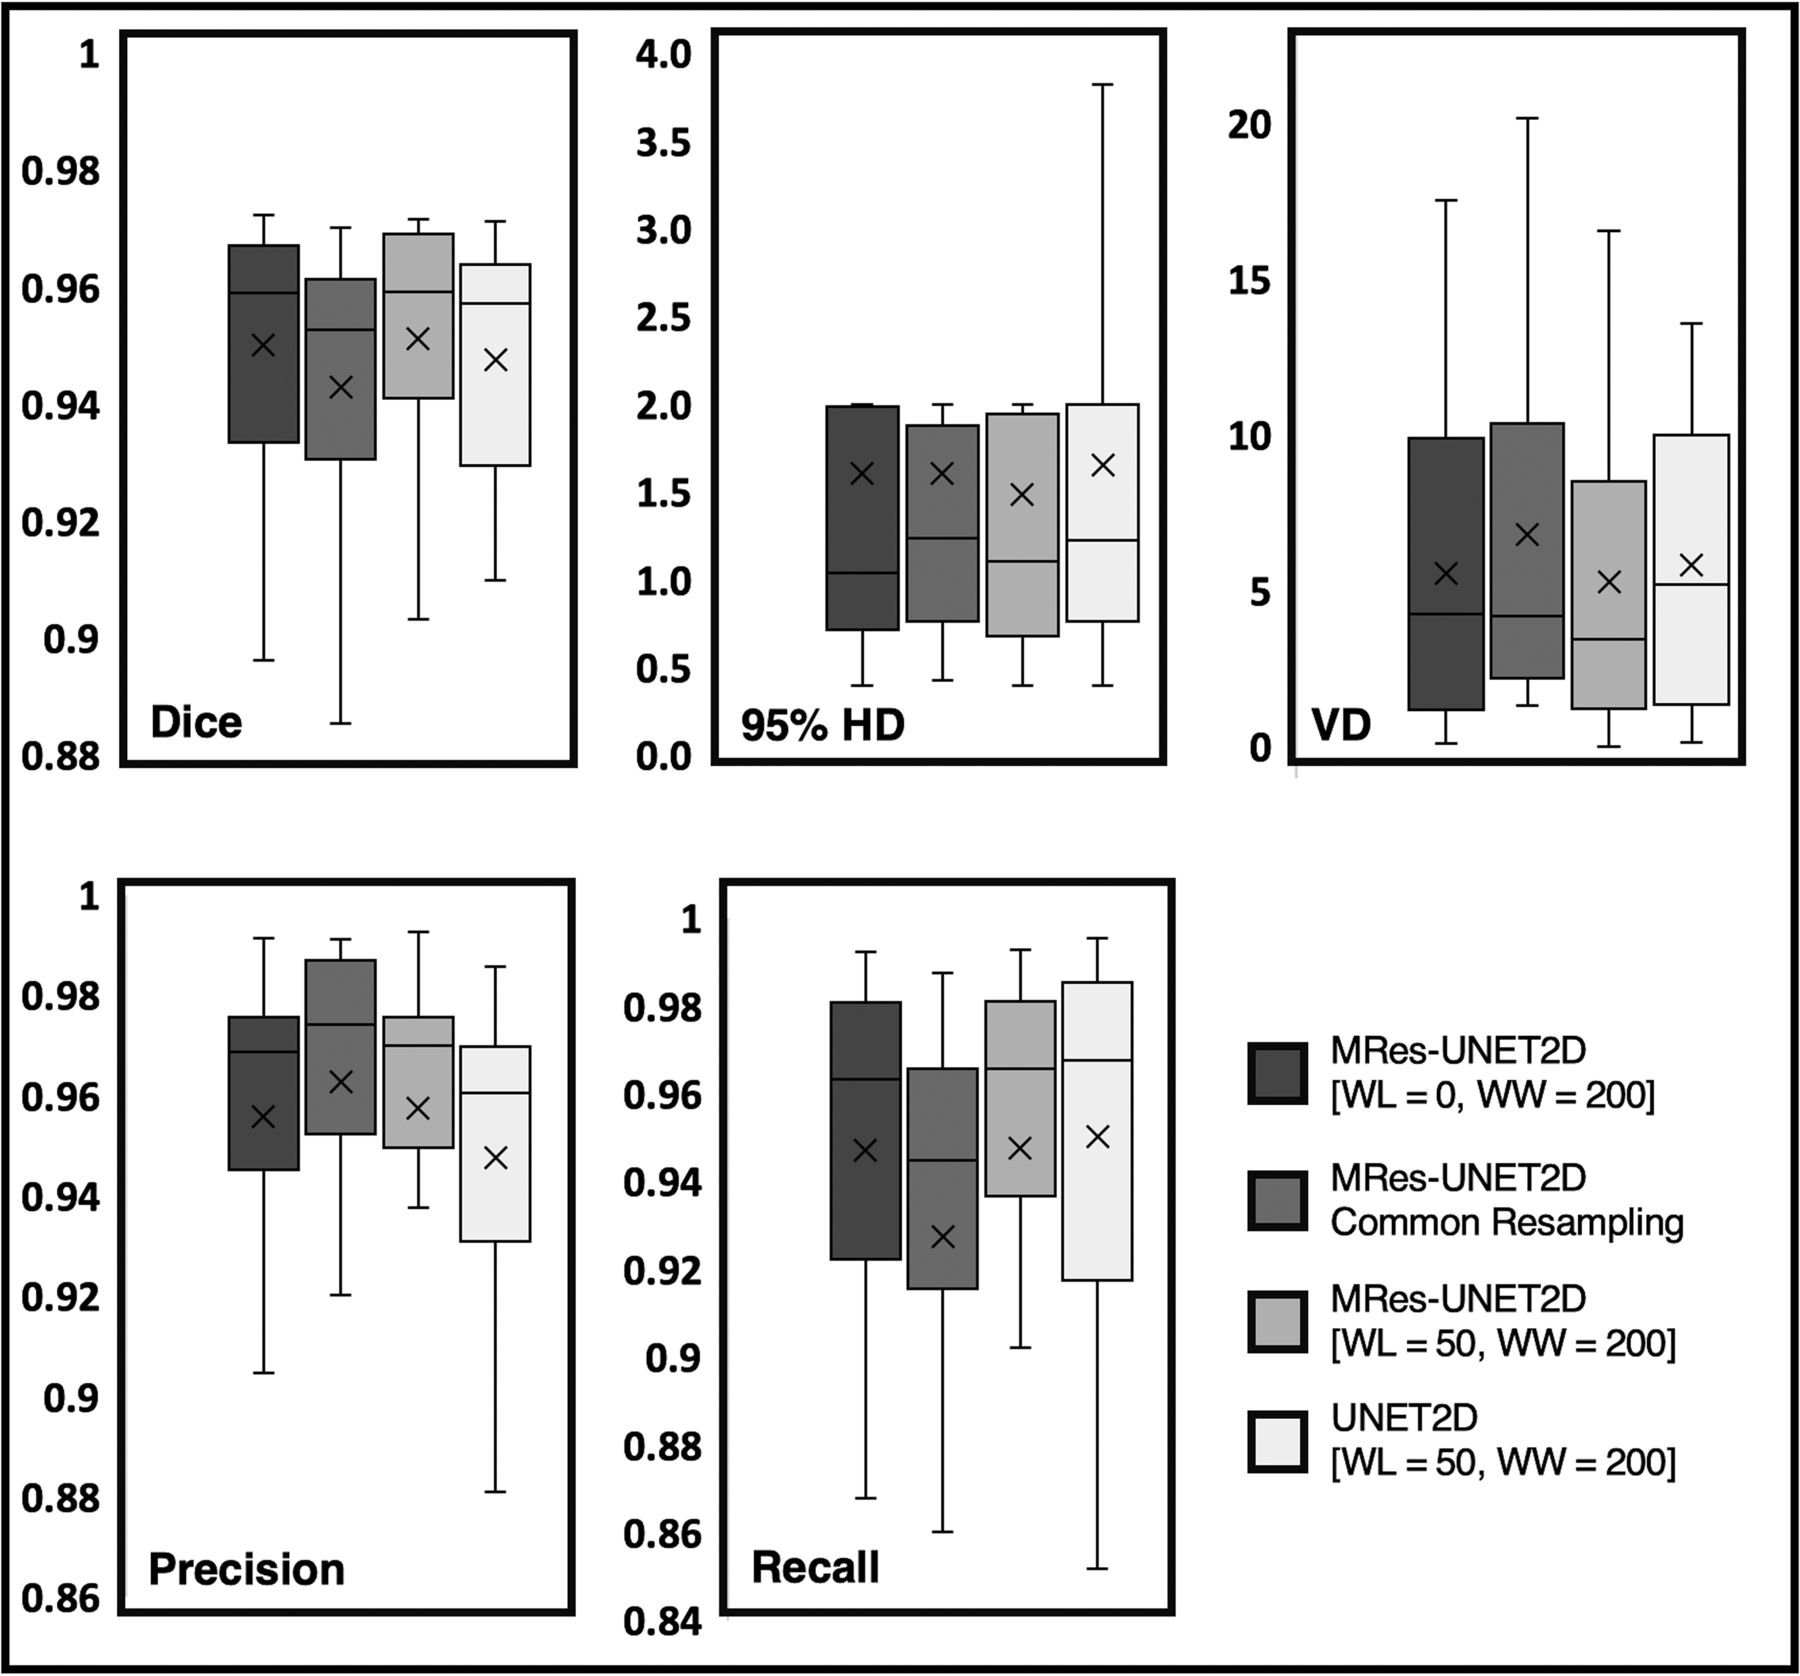
Table 1 also compares the average performance of MRes-UNET2D to a standard UNET architecture on test cohort 1, where with 10× fewer trainable parameters, MRes-UNET2D obtains lower mean HD and AVD values while also improving on the mean Dice and precision scores (Fig 5). However, we did not find this difference in performance to be significant for Dice (P = .43), precision (P = .22), recall (P = .72), 95% HD (P = .36), and AVD (P = .55).

Boxplot comparison of the performances of MRes-UNET2D and UNET2D on test cohort 1. The different panels compare the performances of the deep learning models on Dice, 95% Hausdorff distance (95% HD), volume difference (VD), precision, and recall. Among the 3 MRes-UNET2Ds, we selected [window level (WL), window width (WW)] = [50, 200] because it yielded the best performance across all evaluation metrics.
Table 2 shows pair-wise Dice overlap metrics for the 3 observers, consensus observer, and our model on test cohort 2. MRes-UNET2D achieved average Dice scores of 0.97 and 0.95 with respect to the consensus observer and the individual observers, respectively. The average Dice between the observers, calculated as an average of Dice scores between observer 1 versus observer 2, observer 2 versus observer 3, and observer 1 versus observer 3, was 0.94, whereas this value was 0.97 with respect to the consensus observer.
Mean (standard deviation) of pair-wise Dice between the observers, consensus observer, and MRes-UNET2D on test cohort 2 (n = 9)
We also performed Bland-Altman analysis to compare the agreement in globe volumes per hemisphere from the 3 observers and our model, with respect to the consensus observer. We observed tighter limits of agreement (coefficient of variation = 2.1% and reproducibility coefficient = 3.8%) for MRes-UNET2D (Fig 6A) compared with the human observers (Fig 6B–D).

Evaluation on test cohort 2 (cohort used for interobserver variability between the observers). The Bland-Altman plots to depict agreement in globe volume estimates (left and right) from (A) MRes-UNET2D, (B) observer 1, (C) observer 2, and (D) observer 3 with respect to the consensus observer. The consensus observer was created by using a majority voting scheme on the individual observer contours. The coefficient of variation (CV) and reproducibility coefficient (RPC) for each analysis are also shown.
Figure 7A shows the histogram of IGVD values from the entire cohort under study (n = 98, −0.01 ± 0.33 mL) excluding test cohort 2. The boxplot in Fig 7B compares IGVD values from the consensus observer, MRes-UNET2D, and the human observers on test cohort 2. The mean (± standard deviation) IGVD from the network was 0.05 ± 0.24 mL compared with −0.10 ± 0.25 mL, −0.13 ± 0.23 mL, −0.09 ± 0.5 mL, and 0.20 ± 0.45 mL from the consensus observer and observers 1, 2, and 3, respectively. We were unable to reject the null hypothesis that the IGVD values in test cohort 2 from the consensus, MRes-UNET2D, and the 3 observers come from the same distribution (P = .3).

Analysis of inter-globe volume difference (IGVD). A, A histogram of IGVD (mL) on the entire study cohort. B, The IGVD measured in globe contours on test cohort 2 (cohort used for interobserver variability analysis) from the consensus observer, MRes-UNET2D, and the 3 human observers is shown in the boxplot. C, Examples of the utility of IGVD as a quantitative marker for globe trauma. The predicted globe contours are overlaid on representative images from 3 subjects with suspected globe injuries. The IGVD (mL) for each case is depicted in the figure.
Figure 7C shows the globe contours predicted by MRes-UNET2D on the 3 subjects with suspected globe injuries along with the IGVD computed for each case. We also computed a z score, a measure of distance in terms of standard deviation from the population mean, for each of the subjects. For subjects 1, 2, and 3 in Fig 7C, the IGVDs were −4.62 mL, 2.32 mL, and 1.22 mL, respectively. The z score values were 14.16, 7.12, and 3.77 for subjects 1, 2, and 3, respectively. The IGVD for subject 1, for instance, is indicative of a smaller left globe compared with the right. Subject 3 highlights a case with subtle globe injury. The z score distance quantifies that the IGVD of 1.22 mL is approximately 3.77 standard deviations away from the mean IGVD from the cohort of normal subjects, depicting abnormality in globe volumes.
DISCUSSION
In this study, we show that our deep learning network, MRes-UNET2D, can provide accurate and reliable detection of globe contours and quantification of globe volumes. With fast prediction times and performance approaching an average human observer, we show that globe contour predictions, as well as volume estimates, can be made available to radiologists in clinically feasible times. We also observe that using the proposed deep learning CNN yields improved Dice scores compared with average Dice scores ranging from 0.80 to 0.85 by using traditional non-deep learning–based schemes described previously in the literature.12,13,17 The mean 95% HD was also lowered to 1.5 mm compared with approximately 2.89 mm to 3 mm.17
We show that MRes-UNET2D works well across images with different fields of view as well as resolutions. The network does not need any special processing in terms of changing image resolution to a common grid; the images can be trained and tested in their native resolution. We observe that minor variations in window level to change contrast between soft tissue and background bones did not result in a significant performance difference between the models. Furthermore, it is important to note that the training and the testing data in this work come from multiple scanners across manufacturers. Therefore, it can be stated that the proposed network is robust to changes in acquisition parameters and scanner hardware variations across manufacturers.
We show that using a deep learning network can provide reliable and consistent contour and volume estimates, thereby, reducing the issues associated with interobserver variability. We observe that the deep learning model’s predictions are more in agreement (Dice = 0.95) with the individual observer contours compared with the agreement between observers (Dice = 0.94).
We see that the model, though never trained on images with suspected globe injuries, generalized well to these images on the limited test cases used in this study. The IGVD values and z scores from these cases appear to be useful indicators of suspected globe injuries and provide quantitative information regarding the extent of deviation from a normal cohort.
Our proposed technique has limitations. The training cohort entirely consists of subjects with no imaging or clinical findings of globe injury. Although we observe generalizability of the model on a few cases with globe injuries, we currently do not have ground truth annotations to quantitatively validate the performance of our model on these cases. However, this limitation can be overcome by fine-tuning the MRes-UNET2D model using training data that includes these cases.
Although CT provides superior assessment of size and location of intraocular foreign bodies, compared with competing imaging modalities, it has moderate sensitivity for detecting open-globe injuries. This has been reported to be ranging from 51% to 79% and is suboptimal and observer dependent.6,9⇓-11 Using the IGVD values from the normal study population as a baseline, we can quantitatively compare the IGVD for a given CT image with the population IGVD value and automatically identify globe-related abnormalities if the differences between the globe volumes diverge from the normal population distribution. This comparison could potentially provide additional valuable information to a radiologist, in clinically feasible times, to understand whether any subtle globe injuries exist. We will look at introducing additional parameters such as globe contour distortions, ACD, anterior and posterior segment volumes, and lens thickness along with IGVD to quantitatively predict the presence of globe injuries and measure the degree of injury from a scale of subtle injuries to globe ruptures.
CONCLUSIONS
In this work, we proposed a 2D deep learning architecture, MRes-UNET2D, to detect globe contours in axial CT images of the orbits. We showed that the proposed CNN model, trained and validated on CT images from 80 subjects with no imaging or clinical findings of globe injuries, obtained an average Dice score of 0.95, with less than 5.3% error in globe volume estimates. The performance of MRes-UNET2D approached interobserver variability between 3 human observers. The analysis of images from subjects with known globe injuries demonstrated the utility of IGVD as a quantitative marker for trauma.
ACKNOWLEDGMENTS
The authors would like to acknowledge support from the Technology and Research Initiative Fund (TRIF) Improving Health Initiative.
Footnotes
Disclosures: Maria Altbach—RELATED: Grant: University of Arizona, Comments: The work was funded by internal grant mechanisms at the University of Arizona as listed in the Acknowledgments. UNRELATED: None.
References
- Received November 13, 2019.
- Accepted after revision March 21, 2020.
- © 2020 by American Journal of Neuroradiology


Jump to section
Related Articles
Cited By...
- No citing articles found.