
Abstract
BACKGROUND AND PURPOSE: Lack of enhancement of a nasal turbinate on MR imaging, known as the black turbinate, has been reported as a finding highly suggestive of invasive fungal rhinosinusitis in immunocompromised patients. Our purpose was to investigate the normal enhancement pattern of nasal turbinates and to determine whether a black turbinate occurs in patients without invasive fungal rhinosinusitis and, if so, to distinguish differentiating features from pathologic enhancement.
MATERIALS AND METHODS: We examined patient medical records and available MR imaging, which included most nasal turbinates in more than 1 sequence. Imaging was performed with contrast, either with or without fat saturation, in patients without invasive fungal rhinosinusitis. All MR images were evaluated for a turbinate enhancement pattern and the presence of nonenhancing areas.
RESULTS: After we applied the exclusion criteria, 75 MR images from each group, with and without fat saturation, were included. Overall, the frequency of observed nonenhancing portions of turbinates, ie, black turbinates, was 30%. Most observed black turbinates were located in the posterior portion of inferior turbinates. Tiny areas of nonenhancement within turbinates were also a common finding.
CONCLUSIONS: A black turbinate is not uncommon on MR images in immunocompetent patients who have no chance of having invasive fungal rhinosinusitis. Benign turbinate nonenhancement improves over subsequent series, has preserved thin peripheral enhancement, and often has thin internal septa. Knowledge of this normal pattern of nasal turbinate enhancement can aid in the differentiation of the benign black turbinate in immunocompetent patients from the pathologic black turbinate seen in patients with invasive fungal rhinosinusitis.
ABBREVIATIONS:
- BT
- black turbinate
- IFRS
- invasive fungal rhinosinusitis
- NE
- nonenhancing or nonenhancement
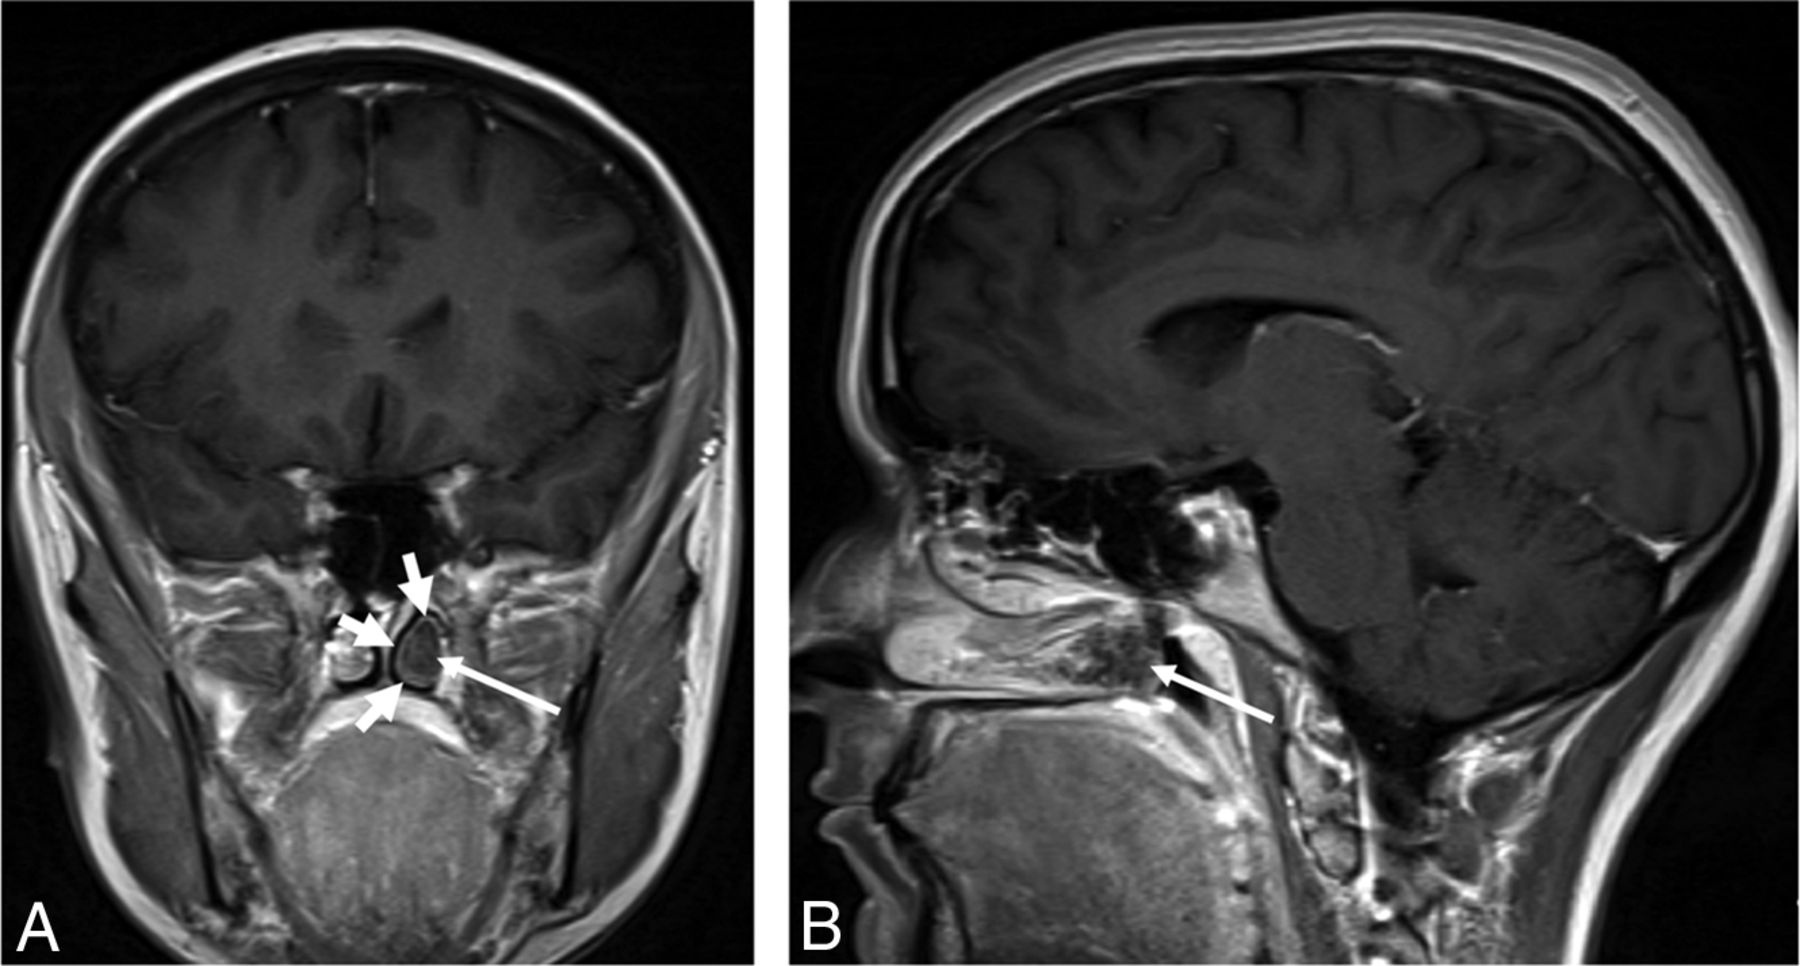
Lack of enhancement of a nasal turbinate on MR images (the “black turbinate [BT] sign”) has been reported as highly suggestive of invasive fungal rhinosinusitis (IFRS) in immunocompromised patients (Fig 1).1⇓⇓⇓–5 However, we have noticed nonenhancing (NE) turbinates in patients imaged for other indications, who have essentially no possibility of having IFRS. IFRS in the at-risk population is a rapidly progressive disease that frequently progresses to involve the orbit and brain. Although treated with aggressive surgical debridement, these patients usually have a poor prognosis.6,7 On the other hand, no treatment would be required if nonenhancement of a nasal turbinate could be a normal finding as well. Therefore, we sought to better understand what constitutes the normal enhancement pattern of the nasal turbinates on MR imaging and attempted to define differentiating features between the normal and pathologic enhancement patterns.

A 27-year-old woman with relapsed pre-B-cell acute lymphoblastic leukemia was admitted for chemotherapy. She had an MR imaging examination due to headache. Axial (A) and coronal (B) T1-weighted postcontrast images with fat saturation showed nonenhancement centered in the left middle turbinate (long arrows) with irregular and invasive borders extending into the left inferior turbinate (short arrow). The patient had tissue-proved invasive fungal rhinosinusitis and went through a series of 12 aggressive surgical debridements and eventually died.
Materials and Methods
Patient Selection
This was a retrospective institutional review board–approved study involving the examination of patient medical records, such as medical history and MR images obtained without and with (gadolinium-based) intravenous contrast. Patients were enrolled in the study via a reverse chronologic order search of the PACS for appropriate MR images. We obtained 2 groups of scans. The fat-saturation group included MR images using orbit, face, neck, or skull base protocols: postcontrast T1-weighted imaging with fat saturation, from May 9, 2016, through July 31, 2016. The brain group included MR images using brain protocols: postcontrast T1-weighted imaging that did not use fat-saturation, from July 1, 2016, through July 10, 2016. Both groups of patients were enrolled in reverse chronologic order until the same number of patients (75) was enrolled for each group after applying the exclusion criteria. The medical records of all patients were evaluated to confirm that the enrolled patients were not likely to have IFRS.
Exclusion Criteria
Our exclusion criteria were specifically designed to ensure sufficient and reliable evaluation of the spatial and temporal enhancement pattern of the nasal turbinates. They were as follows:
1 Scans that did not include at least two-thirds of the concha of the inferior turbinate.
2 Scans with substantial postoperative or posttreatment changes in the sinonasal region.
3 If >1 scan was obtained at the same session, only the first scan was counted, and any additional scan was used as a further delayed series: If the brain was scanned first in a combined brain/orbit scan, the orbit scan was excluded from the fat-saturation group and only included in the brain group.
4 Scans with only 1 sequence routinely including the nasal turbinates, such as scans using our internal auditory canal, pituitary, or various research protocols.
5 Scans with significant motion or other artifacts.
6 Scans with any mass or destructive lesion in the sinonasal region.
7 Scans from outside or satellite hospitals were excluded as the index examinations but were used as prior comparison examinations.
MR Image Acquisition
MR images included in this study were obtained using various MR imaging scanners (Espree, Aera, Symphony, Skyra and Verio; Siemens, Erlangen, Germany). Our departmental protocols for the brain, orbit, face, neck, or skull base were used. There was some variation between pediatric and adult protocols and among different scanners. Some of the key technical parameters such as the length of time to acquire each sequence are summarized in the On-line Table and Table 1. In general, there was a 25- to 30-second delay between intravenous contrast injection and imaging in the first postcontrast sequence.
Timing guideline of postcontrast sequences for 3T scannersa
MR Image Interpretation
MR images were evaluated for the presence of areas of NE within the nasal turbinates (ie, BT). Areas of NE must be confluent areas larger than 4 × 5 mm to be called BTs. This criterion was specifically defined to differentiate between BT and scattered small NE foci that are commonly seen and would not likely be interpreted as potential IFRS.
Each patient with a nonenhancing turbinate was further evaluated for the location of NE within the turbinates and for whether the NE areas persisted but improved or resolved during the multiple postcontrast series. In addition, the size symmetry of the turbinates, the overall enhancement degree, and associated signal intensity on the T2-weighted images were graded by a neuroradiologist with a Certificate of Added Qualification in neuroradiology and 24 years' experience and a senior resident radiologist-in-training. If there was any initial disagreement between the 2 observers, the final grading in each category was decided by further discussion and consensus (Tables 2⇓–4 for the grading system and summary of the cases). A prior MR image, if available, was also thoroughly reviewed to evaluate any temporal variability of the enhancement pattern of the nasal turbinate.
Grading criteria for imaging findingsa
Imaging findings by groupa
BT site of involvement and temporal characteristicsa
Relationship of turbinate size to BT, presence of BT at 2 time points, and nasal cyclinga
Statistical Analysis
The Fisher exact test was used to determine whether there was a statistically significant difference between the sex and age composition of the 2 groups overall and the percentage of BT cases in each group.
Results
One hundred sixty-two MR images from the fat-saturation group and 108 MR images from the brain group were evaluated, among which 87 MR images from the fat-saturation group and 33 MR images from the brain group were excluded per the exclusion criteria. Most of the excluded scans were orbit scans with insufficient inclusion of the nasal turbinates. A detailed breakdown of the excluded scans is shown in Fig 2. Seventy-five MR images were included in each group. The demographic information of all included scans and scans that demonstrated BT is summarized in Tables 6 and 7, respectively.

Breakdown of excluded cases: 1) insufficient inclusion of nasal turbinates, 2) significant postoperative or posttreatment changes involving the nasal cavity, 3) inappropriate scan sequence, 4) specific protocols, 5) significant motion or other artifacts, 6) significant nasal mass, and 7) scans from outside or satellite hospitals.
Demographic summary of the recruited patientsa
Demographic summary of the patients with black turbinatesa
Overall, the observed rate of BT in both cohorts combined was 30% (45/150), with 21% (16/75) in the fat-saturation group and 39% (29/75) in the brain group, respectively. There was a discrepancy between the percentage of BT cases in the 2 groups, and such discrepancy was likely due to the technical differences, including the length of the scans and the greater conspicuity of enhancement on the images with fat saturation.
The NE in the BT cases was confined within the turbinate, with regular and well-defined borders. Another common observation was thin rim enhancement around the NE areas (Figs 3 and 4), likely corresponding to normal mucosal enhancement. Faint septa could occasionally be seen in the NE areas. The NE areas were most commonly seen in the concha of the inferior turbinates, sparing the anterior aspects (Fig 3), with a similar distribution within the middle turbinates being the next most frequent site.

A 24-year-old immunocompetent woman with a history of a gestational trophoblastic neoplasm who had a brain MR imaging for a metastatic work-up. Coronal (A) and sagittal (B) postcontrast T1-weighted images show nonenhancement of the posterior aspect of the left inferior turbinate (long arrows) with thin rim enhancement (short arrows). The posterior aspect of the inferior turbinate is a common location of a black turbinate in immunocompetent patients.

A 14-year-old immunocompetent adolescent girl with right-sided blurred vision, who had orbit and brain MR imaging for a multiple sclerosis work-up. The postcontrast images for the orbit MR imaging were obtained before those for the brain MR imaging. Axial (A) and coronal (B) postcontrast T1-weighted images with fat saturation show nonenhancement most pronounced in the posterior aspects of both inferior turbinates (long arrows) with thin rim enhancement (short arrows) and scattered nonenhancing foci in the right middle turbinate (arrowhead). The inferior turbinate, especially the posterior portion, is a common location of a BT in immunocompetent patients. The sagittal postcontrast image from the brain MR imaging (C), which is the last postcontrast sequence available, shows that the BT of the right interior turbinate is almost completely resolved and has transitioned into mildly scattered nonenhancing foci (curved arrow).
Another phenomenon we frequently observed was scattered small foci (usually much smaller than 4 × 5 mm) of NE, which either developed as a resolving stage of the BT or were present on the first postcontrast sequence. The scattered NE foci followed a distribution pattern similar to that of BTs (Figs 4 and 5).

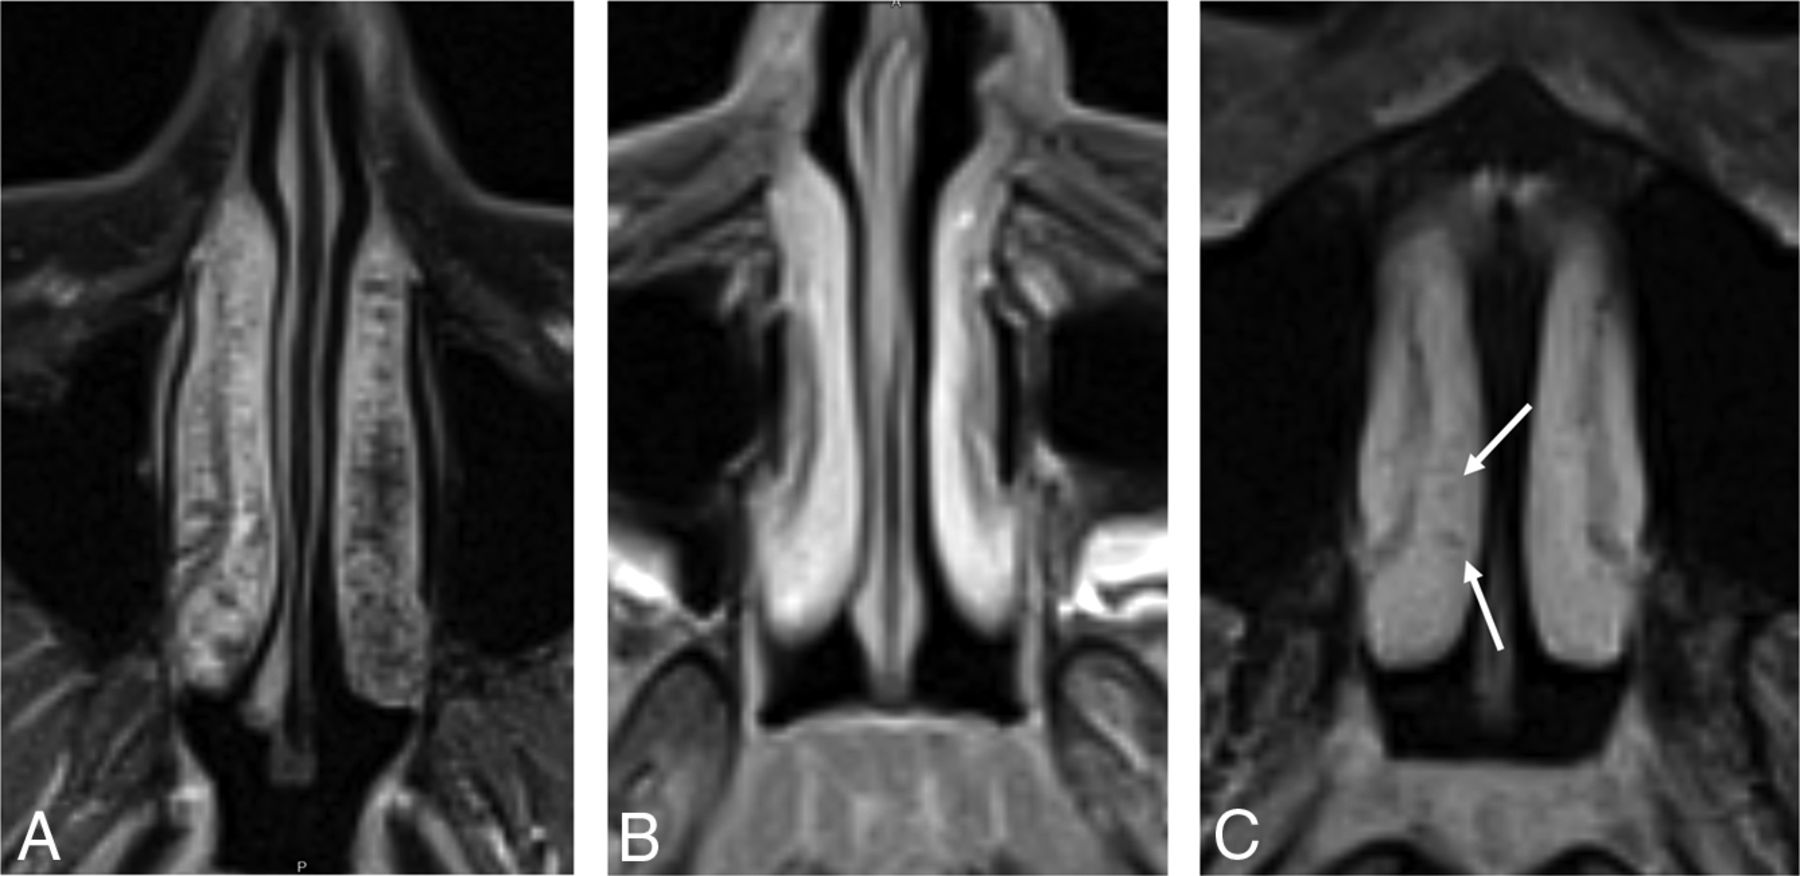
Axial postcontrast T1-weighted images with fat saturation from 3 different patients. A, A 43-year-old woman shows extensive nonenhancing “dots” in both inferior turbinates, left more than right, with relative sparing of the anterior aspects, which is a typical pattern of scattered nonenhancing foci. B, A 12-year-old girl shows the more homogeneous and intense enhancement of the nasal turbinates, which is typical of pediatric patients. C, A 36-year-old woman shows relatively homogeneous enhancement, but it is less intense than that in the pediatric patient, and there are a few small nonenhancing dots (arrows).
Size Asymmetry
In about half of the cases of BT (10 of 16 in the fat-saturation group and 12 of 29 in the brain group, or 22 of 45 cases in both groups), there was a significant side-to-side size asymmetry between the bilateral turbinates. Among those 22 cases, approximately 45% of them (10/22) showed BTs or more prominent BTs (if bilateral) in the smaller turbinates (Table 5).
Signal Intensity on T2-Weighted Imaging
On T2WI, the signal intensity of the BTs and turbinates in general was variable but was mostly intermediate to high (Table 3), without any case falling into the low category.
Temporal Characteristics of Enhancement
Most cases of BT or scattered small foci of NE showed increasing enhancement with time. Most BT regions became scattered foci of NE with time (Fig 4), and 11 of 16 and 16 of 29 BTs in the fat-saturation and brain groups, respectively, showed resolution of BTs.
Prior Examination
Nine of the 16 cases of BT in the fat-saturation group and 13 of the 29 cases of BT in the brain group had adequate prior examinations, per the same exclusion criteria (Table 5). Four of the 9 cases of BTs in the fat-saturation group and 10 of the 13 cases of BTs in the brain group also demonstrated BTs on the prior examinations, respectively.
If there was any change in size asymmetry between the index and prior examinations, we considered this as a surrogate for nasal cycling. In summary, no nasal cycling was seen in the fat-saturation group, while 3 cases in the brain group (of 10) showed evidence of nasal cycling:
Case 1.
The larger turbinate switched from the right side to the left between the index and prior examinations, while BTs remained predominantly on the left side on both examinations.
Case 2.
The larger turbinate switched from the right side to the left between the index and the prior examinations, while BTs were predominantly in the smaller turbinates.
Case 3.
The turbinates were symmetric on the index examination and slightly larger on the left on the prior examination, while the BT was predominantly seen on the left side on both examinations.
For cases with BTs seen on both the index and prior examinations but without evidence of nasal cycling between the examinations, 1 of 4 cases in the fat-saturation group and 3 of 7 cases in the brain group had BTs on opposite sides between the index and prior examinations (if on the right on the index examination, then on the left on the prior examination, and vice versa), while the remaining cases demonstrated BTs on the same side between the index and prior examinations.
In summary, benign BTs may not necessarily be present in the same patient at different time points and do not seem to be consistently influenced by nasal cycling.
Discussion
The vascular supply and complex microvascular anatomy of the nasal turbinates can partially explain our findings. The main arterial supplies to the nasal turbinates are the posterolateral (or lateral) branches of the sphenopalatine arteries.8⇓–10 Branches first supply the inferior turbinates, then the middle turbinates from their posterior aspects. Blood supply is supplemented by anastomotic branches from the anterior ethmoidal arteries that enter along the more anterior aspects of the turbinates.
The nasal tissues can vary in size, due to expansile or erectile tissues.11,12 This feature is due to the complex microvascular anatomy, consisting of capillaries, arteriovenous anastomoses, capacitance vessels or sinusoids, and postcapillary venules. It is the capacitance vessels or sinusoids that are responsible for the ability of nasal structures to change size by virtue of the amount of blood within them increasing or decreasing by several mechanisms.11 Ng et al12 evaluated the distribution of these erectile or cavernous tissues using MR imaging. The authors found the greatest change in size in the inferior turbinate, followed by the middle turbinate (anterior third less than the remainder) and anterior nasal septum. They concluded that this distribution represented that of the cavernous tissues in the nose. This distribution seems to coincide somewhat with the distribution of the most common sites for BT and NE foci and may also explain the filling in of these areas with time. Additionally, the scattered NE foci seen in most of the cases imply that this NE phenomenon might fall within a continuous spectrum, with the BT cases having the most confluent NE foci.
The findings of benign BT, which include nonenhancing areas with well-defined, noninvasive borders confined within a turbinate, are contrasted with the more extensive findings involving adjacent structures seen in our case of IFRS (Fig 1).
Common observations in our benign BT cases of thin rim enhancement around the nonenhancing areas (Figs 3 and 4) and intermediate and high signal intensity on the T2-weighted images were not consistently described in the cases of IFRS reported in the literature1⇓⇓–4,7 or seen in our case of IFRS. Choi et al4 stated that in patients with IFRS, “Although LoCE (Lack of Contrast Enhancement) showed variable signal intensity (SI), homogeneously or heterogeneously enhancing lesions showed exclusively low SI (100%, 12/12) on T2WI.” Seo et al,3 in their review of 23 patients with IFRS, found 17 patients who had nonenhancing areas in the sinonasal region (13 with extension into adjacent structures), and the signal intensity on the T2WI was variable, with most being hyperintense and many also having areas of iso- or hypointensity compared with the brain cortex.3 Therefore, there is no consistent signal intensity on the T2WI suggesting the diagnosis of IFRS when an NE turbinate is encountered in high-risk patients. Conversely, low signal intensity on T2WI was not seen in any of our patients with benign BTs.
Diffusion-weighted imaging may have little utility and is only mentioned by the authors of several series in the literature, and not necessarily with respect to the nasal turbinates.2,4 Safder et al2 described restricted diffusion in 2 cases; however, Choi et al4 described facilitated diffusion in 2 of their cases. Choi et al also felt that the NE areas were due to coagulation necrosis rather than infarction, therefore explaining this imaging finding.
The most frequent locations of NE turbinates in IFRS are also different from the distribution of benign BTs. Gillespie et al,13 in their retrospective study of 25 patients with IFRS, found that the most common site of involvement was the middle turbinate (62% of biopsied patients). Their hypothesis was that the middle turbinate filters the major volume of the nasal airflow and might have contributed to the predilection for fungal seeding in this region.
Compared with a true pathologic turbinate NE pattern in patients with IFRS, the NE turbinates in immunocompetent patients have the features summarized in Table 8. Overall, improving NE turbinates through the course of a scan with preserved peripheral (likely normal mucosal) enhancement and thin septa are the key features to differentiate benign BT from IFRS, which will more likely demonstrate persistent NE in affected turbinates; the NE of IFRS may extend into adjacent structures rather than having well-defined thin peripheral enhancement.
Imaging features of benign BT in immunocompetent patients compared with those of invasive fungal rhinosinusitis in immunocompromised patients
However, this comparison is itself limited by the relative rarity of cases of true pathologic turbinate NE both in the literature1⇓⇓⇓⇓⇓–7 and in daily practice.
There are several additional limitations to our study. We had a relatively small number of pediatric patients. In both the fat-saturation and brain groups, the number of pediatric patients was significantly less than for the adult patients (Table 6). However, within the brain group, there was a statistically significant difference in the number of pediatric patients compared with adult patients demonstrating BTs (Table 7). While this could represent a true difference, we suspect it is due to the small pediatric sample size. Further investigation might be needed to definitively explain this finding and to better evaluate the pediatric population overall.
Additionally, the variable length of the sequences and the different protocols and scanners used could potentially affect the valuation of the temporal pattern of enhancement. However, we would suggest that similar scanner and protocol variability are present in many large practices and academic institutions, so this mix approximates the everyday scan variability that many radiologists will encounter.
Last, there was no pathologic proof of benignity of the BTs in our immunocompetent patients; however, evidence obtained from the patients' electronic medical records supported this presumption.
Conclusions
Although a sign suggesting IFRS in the appropriate clinical setting, areas of NE within the nasal turbinates are common on both MR imaging with or without fat saturation in immunocompetent patients who have little chance of having IFRS. This benign NE will improve over subsequent series, have preserved thin peripheral enhancement, and will often have thin internal septa. Knowledge of the normal patterns of nasal turbinate enhancement can help radiologists better differentiate findings suggestive of IFRS from normal variations and lead to a higher positive predictive value of the BT sign.
Footnotes
Paper previously presented at: Annual Meeting of the American Society of Neuroradiology and the Foundation of the ASNR Symposium, April 22–27, 2017; Long Beach, California.
REFERENCES
- Received March 28, 2018.
- Accepted after revision March 18, 2019.
- © 2019 by American Journal of Neuroradiology


Jump to section
Related Articles
Cited By...
- No citing articles found.