
Abstract
SUMMARY: Time-density curve analysis of DSA provides useful blood flow information. However, manually selecting the ROI is time-consuming. We developed an automatic technique to provide arterial, capillary, and venous vasculatures with corresponding time-density curves. This study retrospectively analyzed the data of 36 patients with unilateral carotid stenosis. We found that the full width at half maximum of the time-density curve for the automatically segmented capillary vasculature is a suitable representation of the cerebral circulation time.
ABBREVIATIONS:
- CCT
- cerebral circulation time
- FWHM
- full width at half maximum
- I1 and I2
- the internal carotid artery at 2 locations
- IA
- cervical internal carotid artery in the lateral view
- IB
- cavernous segment of the internal carotid artery in the lateral view
- MCP
- manually selected capillary phase
- PA
- posteroanterior
- TDC
- time-density curve
X-ray DSA images are the criterion standard for diagnosing cerebrovascular diseases. The time-density curve (TDC) measured from an ROI represents the changes in the intensity of the contrast bolus passing through the selected region. TDC analysis is less computationally intensive, and measurement outcomes are immediately available.1 However, the manual selection of the ROI is time-consuming and is susceptible to interobserver variation. The aim of this study was to develop an automatic analysis method for detecting vascular structures and corresponding TDCs from DSA images. Seven hemodynamic parameters were measured from the TDCs. The automatically measured TDCs and hemodynamic parameters were validated through their comparison with those measured from manually selected ROIs.
Materials and Methods
This retrospective study was approved by the institutional review board of Taipei Veterans General Hospital. This study enrolled 36 patients who had extracranial internal carotid stenosis of >70% according to the NASCET criteria and who consequently underwent stent placement. DSA acquisitions were performed on a biplane angiosuite (Axiom Artis dBA; Siemens, Erlangen, Germany). A power injector (Liebel-Flarsheim Angiomat; Illumena, San Diego, California) was used to administer the contrast bolus. The image size was 960 × 960 or 1440 × 1440 pixels, and the FOV was 22 cm. The acquisition rate was 6 frames per second, and the acquisition lasted 8–18 seconds. Each patient was imaged in the posteroanterior (PA) and lateral views before and after treatment. A total of 144 datasets were analyzed.
The scale-invariant feature transform flow technique2 was applied to the dynamic x-ray projection images for reducing motion artifacts. After performing the registration process, we used the FastICA technique (https://cran.r-project.org/web/packages/fastICA/fastICA.pdf)3 to segment the DSA images into arterial, capillary, and venous vasculature images. The thresholding method of Otsu4 was applied to the output independent component images for generating binary mask images. The binary masks of these 3 vessel types were used to measure the actual TDCs.
Each TDC was fitted by a γ-variate function5 to reduce random noise and recirculation. The following 4 parameters were calculated from the fitted curve: 1) the area under the fitted TDC (area under curve), 2) the maximum enhancement, 3) TTP, and 4) the width between the 2 time points on the TDC when the density was half the maximum enhancement, full width at half maximum (FWHM).
Three other parameters were calculated by fitting the γ-variate curve to straight lines. Every set of 4 consecutive temporal points on the γ-variate function was fitted to a straight line described by a linear equation: C(t) = mt + b, where m was the slope, using a least-squares error technique. The largest and smallest m values were recorded to represent the wash-in and washout slopes, respectively. The bolus arrival time was the time at which the straight line with the largest slope intercepted the horizontal axis (eg, Bolus Arrival Time = −b / Wash-In Slope).
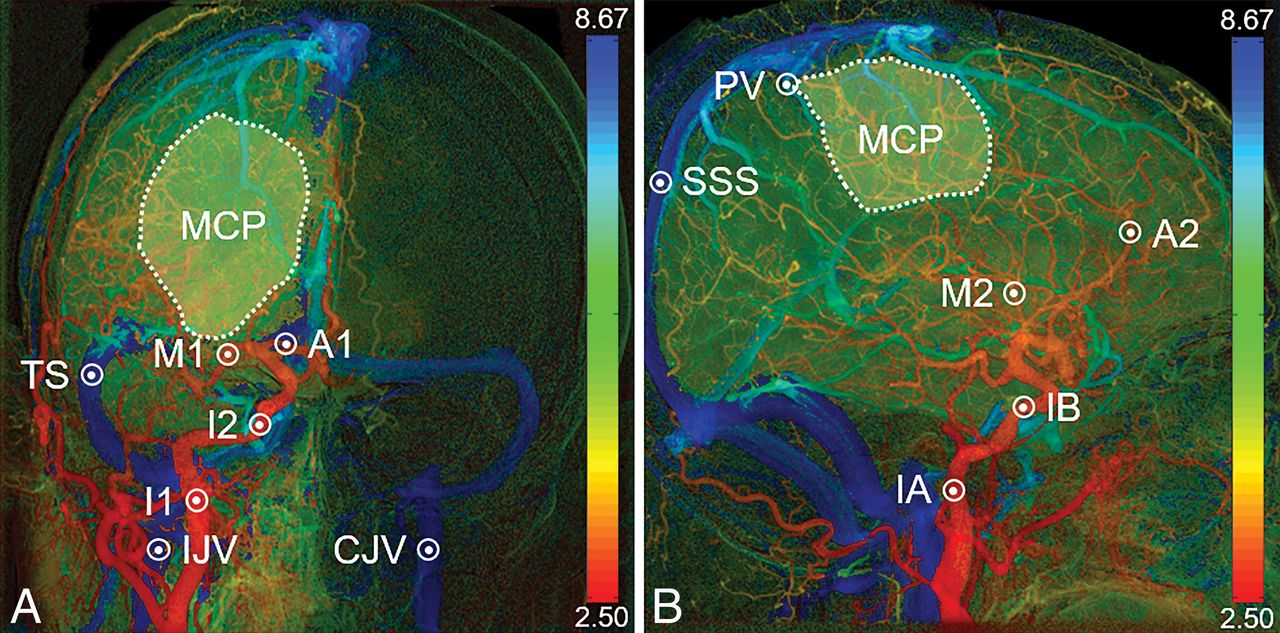
Fifteen ROIs were manually selected to validate the proposed automatic technique. The locations of these ROIs are indicated in Fig 1. The first 13 ROIs had areas of 3 × 3 pixels. In the PA view, we selected 7 ROIs: the ICA at 2 locations (I1 and I2), anterior and middle cerebral arteries in the PA view, transverse sinus in the PA view, and ipsilateral and contralateral internal jugular veins (ipsilateral internal jugular vein and contralateral internal jugular vein in the PA view, respectively). In the lateral view, we selected 6 ROIs: the cervical ICA (anterior cerebral artery in the PA view [IA]), the cavernous segment of the ICA in the lateral view (IB), anterior and cerebral arteries in the lateral view, parietal vein, and superior sagittal sinus. The other 2 manually drawn ROIs were used to represent the manually selected capillary phase (MCP) in the PA and lateral views. In the MCP ROIs, pixels with maximum enhancement higher than the average were excluded.

Color-coded DSA images in the PA (A) and lateral (B) views. The numbers on the right-hand side are TTP values. Fifteen ROIs are manually selected to validate the automatic technique.
For each DSA dataset, 3 TDCs were obtained using the automatic method, and they were designated group A. A total of 15 TDCs were measured from the manually selected ROIs, and they were designated group B. Seven hemodynamic parameters, namely maximum enhancement, bolus arrival time (BAT), TTP, wash-in slope, wash out slope, FWHM, and area under curve, were calculated from the TDCs. We used the Pearson product-moment correlation coefficient to compare TDCs and these parameters between groups A and B. The cerebral circulation time (CCT) was defined as the time difference between the TTPs of IB and the parietal vein.1 We compared the CCT with the FWHM measured from the automatically segmented capillary mask and the MCP ROI.
Results
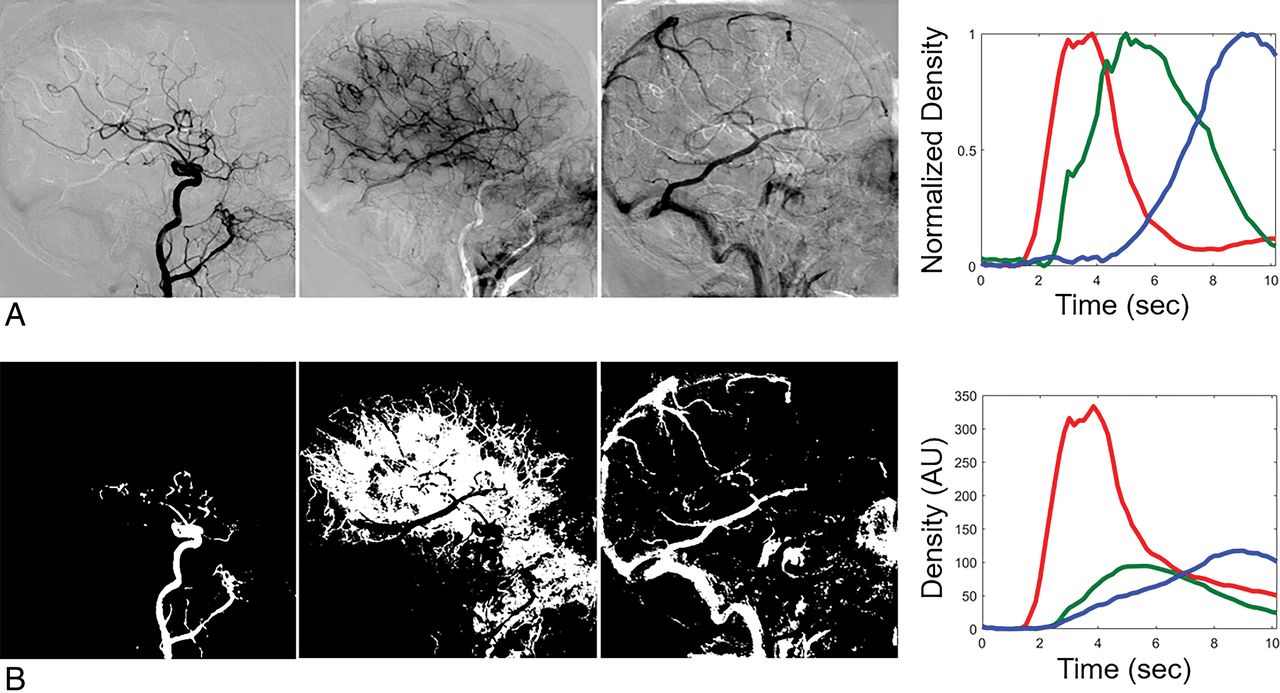
The 3 output independent-component images related to arterial, capillary, and venous phases and the corresponding TDCs are shown in Fig 2A. The mask images and the corresponding TDCs are shown in Fig 2B.

Three output images and corresponding TDCs (A). Mask images for each phase and corresponding TDCs (B). The images are ordered as arterial, capillary, and venous phases from left to right. The red, green, and blue solid lines represent the TDCs of the arterial, capillary, and venous phases. AU indicates arbitrary unit.
The Pearson correlation coefficients between the automatically measured TDCs and some manually measured TDCs showed the following: 1) The TDCs of arterial masks were very similar to those of the manually selected large arterial (I1, I2, IA, IB) ROIs (>0.90); 2) the TDCs of capillary masks were very similar to those of the MCP ROI (>0.85); and 3) the TDCs of venous masks were very similar to those of venous (ipsilateral internal jugular vein in the PA view and superior sagittal sinus) ROIs (>0.90).
The 7 parameters calculated from the TDCs of arterial masks were all significantly correlated with the parameters calculated from manually selected large arterial (I1, I2, IA, IB) ROIs (P < .05). Those parameters (except wash-in slope) of the capillary masks correlated significantly with those of the MCP ROIs (P < .05). The CCT also significantly correlated with the FWHM of capillary masks (P < .05). Figure 3 illustrates scatterplots of several hemodynamic parameters measured manually versus those measured automatically. The results indicate that the TDC of the arterial mask is a suitable representation of those for larger ICAs and that the FWHM of the capillary mask is a suitable representation of both CCT and the FWHM of MCP.

Scatterplot of the TTP between the manually measured I1 (red dots) and IA (blue crosses) and the automatically measured arterial mask (A). Scatterplot between the manually measured CCT and automatically measured FWHM of the capillary mask in the PA (red dots) and lateral (blue crosses) views (B). Scatterplot between the FWHM of MCP and automatically measured FWHM of the capillary mask in the PA (red dots) and lateral (blue crosses) views (C). For comparison, the scatterplot between the manually measured CCT and the FWHM of the MCP in the PA (red dots) and the lateral views (blue crosses) is shown in D.
Discussion
The proposed automatic postprocessing method obtained robust results for segmenting arterial, capillary, and venous vasculatures and generated hemodynamic parameters objectively without the manual selection of ROIs. In the era before the capillary phase could be accurately extracted, most morphologic observations focused on arteries and veins. The brain parenchyma itself, comprising capillaries, could not be visualized on an angiogram. A surrogate marker, CCT, was used to indicate the viability of the brain.1 However, obtaining CCT in a manual manner is inconvenient and has interobserver variation. In the proposed technique, the FWHM of the TDC for the segmented capillary is proportional to the CCT and thus can be considered a useful hemodynamic parameter.
Conclusions
The proposed technique combines scale-invariant feature transform flow, FastICA, and thresholding techniques to decompose DSA images into arterial, capillary, and venous vasculatures in a completely automatic manner. The results obtained were highly consistent with those obtained using manually selected ROIs.
Footnotes
Disclosures: Jia-Sheng Hong—RELATED: Patent Pending. UNRELATED: Grant: Siemens, Comments: a grant to develop 2 Matlab programs.* Yi-Hsuan Kao—RELATED: Patent Pending. UNRELATED: Grant: Siemens, Comments: a grant to develop 2 Matlab programs.* Chung-Jung Lin—RELATED: Grant: Ministry of Science and Technology, Taiwan, Comments: grant No. 104-2314-B-010-037*; RELATED: Patent Pending. *Money paid to institution.
This work was supported, in part, by the Ministry of Science and Technology (grant No. 104-2314-B-010–037).
Paper previously presented, in part, as a scientific poster (P-36, Hemodynamic Segmentation of Digital Subtraction Angiography Using Independent Component Analysis) at: Annual Meeting of the American Society of Neuroradiology and the Foundation of the ASNR Symposium, June 2–7, 2018; Vancouver, British Columbia, Canada.
Indicates open access to non-subscribers at www.ajnr.org
- Received October 22, 2018.
- Accepted after revision December 6, 2018.
- © 2019 by American Journal of Neuroradiology


Jump to section
Related Articles
Cited By...
- No citing articles found.