
Abstract
BACKGROUND AND PURPOSE: The limitations inherent in the current methods of diagnosing mild cognitive impairment have constrained the use of early therapeutic interventions to delay the progression of mild cognitive impairment to dementia. This study evaluated whether quantifying enlarged perivascular spaces observed on MR imaging can help differentiate those with mild cognitive impairment from cognitively healthy controls and, thus, have an application in the diagnosis of mild cognitive impairment.
MATERIALS AND METHODS: We automated the identification of enlarged perivascular spaces in brain MR Images using a custom quantitative program designed with Matlab. We then quantified the densities of enlarged perivascular spaces for patients with mild cognitive impairment (n = 14) and age-matched cognitively healthy controls (n = 15) and compared them to determine whether the density of enlarged perivascular spaces can serve as an imaging surrogate for mild cognitive impairment diagnosis.
RESULTS: Quantified as a percentage of volume fraction (v/v%), densities of enlarged perivascular spaces were calculated to be 2.82 ± 0.40 v/v% for controls and 4.17 ± 0.57 v/v% for the mild cognitive impairment group in the subcortical brain (P < .001), and 2.74 ± 0.57 v/v% for the controls and 3.90 ± 0.62 v/v% for the mild cognitive impairment cohort in the basal ganglia (P < .001). Maximum intensity projections exhibited a visually conspicuous difference in the distributions of enlarged perivascular spaces for a patient with mild cognitive impairment and a control patient. By means of receiver operating characteristic curve analysis, we determined the sensitivity and specificity of using enlarged perivascular spaces as a differentiating biomarker between mild cognitive impairment and controls to be 92.86% and 93.33%, respectively.
CONCLUSIONS: The density of enlarged perivascular spaces was found to be significantly higher in those with mild cognitive impairment compared with age-matched healthy control subjects. The density of enlarged perivascular spaces, therefore, may be a useful imaging biomarker for the diagnosis of mild cognitive impairment.
ABBREVIATIONS:
- AD
- Alzheimer disease
- aMCI
- amnestic mild cognitive impairment
- EPVS
- enlarged perivascular spaces
- MCI
- mild cognitive impairment
- PVS
- perivascular spaces
- v/v %
- percentage of volume fraction
Perivascular spaces (PVS) are cavities filled with cerebrospinal and interstitial fluids that lie between the perforating blood vessels of the brain and the pia mater.1,2 They act as conduits for the drainage of interstitial fluid and solutes from the brain.3 These spaces can become dilated and are termed enlarged perivascular spaces (EPVS) when large enough to be visible on imaging.4 The presence of EPVS has been shown to be increased in a variety of physiologic and pathologic neurologic conditions, such as aging, hypertension, arteriosclerosis, dementia, mild cognitive impairment (MCI), Alzheimer disease (AD), and Parkinson disease.5⇓⇓–8
Current research suggests that MCI can be a harbinger of AD development, with annual rates of progression variably reported to be 10%–15%.9⇓⇓–12 Individuals with MCI exhibit cognitive impairment beyond that expected for their age, a feature shared with AD, with no overt impact on their activities of daily living.13 The MCI population is of particular clinical interest because it is hypothesized that early therapeutic interventions can be used to delay or even thwart their deterioration to AD.14 The challenge lies in detecting MCI early enough for such interventions to be successful. Several assessment tools, such as the Mini-Mental State Examination,15 are used by physicians to clinically assess MCI. However, a failure to detect the condition, especially in its early stages, is an important limitation of these tools11,16,17 and underscores an emergent need for more quantitative diagnostic approaches.
Aided by a discovery of several sensitive and specific imaging biomarkers, including the EPVS, MR imaging continues to find increasing utility in the diagnosis of AD.18 Logically, these biomarkers hold the most promise for becoming indicators of MCI as well.19,20 Owing to the difficulties involved in their quantification, EPVS are a relatively understudied biomarker.21 Current evaluation of their properties, such as their shape, size, and number, remains a subjective process.22 Development of objective methods for quantifying these properties is, thus, highly desirable, with a great potential for clinical utility.
A quantitative method for mapping brain PVS in the MR images of healthy patients and those with AD acquired on a 7T whole-body MR imaging scanner has previously been reported by Cai et al.23 Using a train of algorithms, including a pixel-wise spatial gradient, we segmented the hyperintense PVS and calculated their density as a percentage of volume fraction (v/v%). The initial results demonstrated that the PVS density is significantly higher in patients with AD compared with healthy controls.23
In this retrospective study based on brain imaging datasets collected previously for other research purposes,24 we aimed to evaluate whether the quantitative EPVS MR imaging at the clinically prevalent 3T can help differentiate subjects with MCI from age-matched healthy controls. We tested our method on patients diagnosed with amnestic MCI (aMCI), 1 of the 2 main subtypes of MCI; the other is nonamnestic MCI. Individuals with aMCI have memory impairment as their predominant symptom and have a higher risk of conversion to AD than individuals with nonamnestic MCI, who present with a decline in cognitive domains other than memory and convert more frequently to other dementia forms, such as Lewy body dementia.25,26
Materials and Methods
Subjects
The subjects, 15 controls and 14 patients who met the Petersen criteria for aMCI, were recruited from the Penn Memory Center/Alzheimer Disease Center at the University of Pennsylvania between 2011 and 2014.27
To be included, all subjects required the following: age of 55–89 years, at least 2 years postmenopausal or surgically sterile if female, fluent in English, 6 grades of education or sufficient work experience to exclude mental retardation, in good health without any diseases that could interfere with the study, visual and auditory acuity to allow neuropsychological testing, a geriatric depression scale of <6, and willing and able to complete all the required study procedures. Additional inclusion criteria for patients were a diagnosis of probable aMCI and a Mini-Mental State Examination score between 24 and 30. Exclusion criteria were neurologic diseases other than aMCI or AD; the presence of devices contraindicated for MR imaging; a history of major depression, bipolar disorder, schizophrenia, substance abuse or dependency within the past 2 years; illnesses or medical conditions that could lead to difficulty complying with the study protocol; anxiety disorders; and pregnancy.
The mean age for controls and the patients with aMCI was 66.3 ± 9.5 and 71.9 ± 6.2 years, respectively (P = .07). The male/female ratios were 7:8 and 6:8 for the control and the aMCI groups respectively (P = 1.00). Education, measured in years of schooling, was 15.6 ± 2.6 years for controls and 16.9 ± 2.8 years for the aMCI cohort (P = .19). The subjects' performance on the Mini-Mental State Examination was 29.5 ± 1.0 for the controls and 26.9 ± 1.7 for the aMCI group (P < .001); on the Consortium to Establish a Registry for Alzheimer Disease Word List Memory Task, it was 24.7 ± 2.9 for the controls and 16.2 ± 3.2 for the aMCI group (P < .001); and on the Delayed-Recall Test, it was 8.7 ± 1.8 for the controls and 3.4 ± 2.1 for the aMCI group (P < .001).24
All subjects provided informed consent, and the research was performed in compliance with the standards set by the National Institutes of Health, the institutional review board, and the International Code of Medical Ethics of the World Medical Association. All subjects underwent high-resolution T2-weighted MR imaging of the brain.24
MR Imaging
T2-weighted MR images were acquired on a 3T MAGNETOM Trio scanner (Siemens, Erlangen, Germany) with an 8-channel array head coil at the Hospital of the University of Pennsylvania. In total, 30 coronal slices of the middle brain were acquired with a slice thickness of 2 mm and a 0.6-mm gap, covering a total of 78 mm. The other parameters for the T2-weighted scans included the following: TR/TE = 5310/68 ms, echo-train length = 15, echo spacing = 18.3 ms, phase oversampling = 0%, FOV = 180 × 180 mm2, image matrix = 448 × 448, rendering an in-plane resolution of 0.4 × 0.4 mm2. The total acquisition time for the T2-weighted dataset is about 7 minutes.24
Image Processing
A custom script was written using Matlab (R2012b; MathWorks, Natick, Massachusetts) to automate the segmentation of EPVS in the brain scans. We focused on the EPVS in the white matter and the basal ganglia, areas that previous research identified as ROIs for studying the EPVS.4
For each image, first, pixels of background noise were excluded using a preset threshold to create a brain mask. To segment out the white matter and the subcortical nuclei from the brain, we performed 2 successive rounds of 3- and 6-level k-means clustering to filter out the CSF and cortical gray matter, respectively. Hole-filling, edge-detection, and contrast-enhancement algorithms were used throughout this process to prevent the EPVS from being filtered out and to keep the edges with their high spatial gradient from being erroneously labeled as EPVS in the subsequent steps. The pixel-wise spatial gradient was then calculated using the Matlab function “imgradient.” EPVS were then automatically identified as pixels with a spatial gradient and top 92% of gradient values. The threshold was determined heuristically, given that pixels for brain tissues have 8% of the lowest gradient values. Eventually, the function “bwconncomp” in Matlab was applied to preserve the fusiform structures corresponding to the EPVS with a prescribed object size (20–200 pixels) and to generate EPVS maps of the brain. False-positive and false-negative rates for the automatic EPVS-segmentation method were estimated on the basis of visual counting from 10 randomly selected brain slices from 10 distinct subjects, of which 5 were patients with aMCI and 5 were controls.
The density of EPVS as a volume fraction was calculated as the total volume of segmented EPVS divided by the total volume of the white matter and the subcortical nuclei.
EPVS images from brain slices were interpolated to create a 3D volume of isotropic voxels (0.4 × 0.4 × 0.4 mm) as was performed in Cai et al.28 Using ImageJ (National Institutes of Health, Bethesda, Maryland), we created maximum intensity projections. These projections were color-coded using the cyan hot color map available in ImageJ.
MIPs and the calculation of EPVS density were limited to the brain volume bounded anteriorly by the anterior-most part of the hippocampus and posteriorly by the anterior-most part of the cerebellum for 2 reasons: First, this limitation is consistent with previous studies that have identified this region, which contains structures such as the subcortical nuclei, as the most relevant area for studying the EPVS distribution.4 Second, the cerebellum was excluded, given that it contains fine linear structures with high and positive spatial gradients that can be erroneously labeled as EPVS by our algorithms.
To specifically study the EPVS distribution within the basal ganglia, the region of interest for most previous studies on EPVS,4 we manually drew masks corresponding to these subcortical nuclei in reference to the original T2-weighted brain images. MIPs and the calculation of EPVS density in the basal ganglia were then separately performed.
Statistical Analysis
Experimental results are presented as mean ± SD. To determine whether a statistically significant difference existed between the EPVS densities in the healthy controls and the MCI cohorts, we performed 2-tailed unpaired Student t tests with the statistical significance defined as P < .05. A receiver operating characteristic curve was generated to evaluate the performance of our method for differentiating individuals with aMCI from controls using EPVS density as an imaging biomarker. EPVS densities were used as the test variables when the state variable was considered the “true” group category obtained from thorough clinical evaluation. The best cutoff sensitivity and specificity values of the receiver operating characteristic curves were determined using the Youden index, which maximizes the sum of sensitivity and specificity. The performance of our method for the differentiation of patients with aMCI from healthy controls was subsequently assessed by these sensitivity and specificity cutoff values as well as the diagnostic accuracy and the area under the curve. The receiver operating characteristic curve analysis was performed in Matlab (R2012b).
Results
Figure 1 outlines the major steps involved in the automatic identification of EPVS on an MR image of a subject with aMCI. The algorithm sequentially masks the brain (Fig 1B), removes CSF with first-order k-means clustering (Fig 1C), removes cortical gray matter with second-order k-means clustering (Fig 1D), creates a pixel-wise spatial gradient map after manually removing the brain stem, generates the mask for pixels with high and positive spatial gradient values (Fig 1E), and selects EPVS on the basis of object size after removing the edges of the brain structures (Fig 1F). Finally, the EPVS are color-coded and subsequently overlaid on the original brain image (Fig 1G).

Illustration of the EPVS segmentation process. A, A coronal MR brain image of a patient with aMCI. The original image fitted with a brain mask (B) and the original image fitted with a mask generated with first-order k-means clustering to remove the CSF (C). D, Contrast-enhanced image of the brain fitted with the mask generated with second-order k-means clustering to exclude the cortical gray matter. E, A mask for pixels with high and positive spatial gradient values obtained from a pixel-wise spatial gradient map. The brain stem was manually removed. F, EPVS selected on the basis of object size after removing the edges of the brain structures. G, Color-coded EPVS overlaid on the original brain image.
Figure 2 shows side-by-side comparison of the automatically segmented EPVS on MR images of a cognitively healthy individual (Fig 2A, -B) and a subject with aMCI (Fig 2C, -D). Compared with visual counting of the number of EPVS pixels, the automatic EPVS segmentation from 10 randomly selected brain slices produced 0.77% ± 0.29% of false-positive pixels and 19.39% ± 6.92% of false-negative pixels. The difference between the false-positive and false-negative pixels among the control and the aMCI subjects was not statistically significant (P = .44).

A side-by-side comparison of EPVS in a cognitively healthy control versus a patient with aMCI A, A coronal MR brain image of a cognitively healthy control. B, Segmented EPVS color-overlaid on the MR brain image of a cognitively healthy control. C, A coronal MR brain image of a patient with aMCI. D, Color-coded EPVS overlaid on the MR brain image of a patient with aMCI.
Figure 3 depicts the MIPs generated from ordered middle-brain slices of EPVS images in a control and a subject with aMCI. These MIP images are generated for the white matter and subcortical nuclei as a whole (Fig 3A, -B) and separately for the basal ganglia (Fig 3C, -D). There is a visually appreciable increase in the density of EPVS in the subject with aMCI compared with the cognitively healthy subject in both the white matter and subcortical nuclei as well as the basal ganglia.

Representative multislice MIP projections of EPVS in the subcortical brain structures and the basal ganglia of a control and a subject with aMCI. A, MIP image of subcortical structures within the middle of the brain of a control subject. B, The MIP image of subcortical structures within the middle of the brain of a subject with aMCI. C, MIP image of the basal ganglia of a control subject. D, MIP image of the basal ganglia of a subject with aMCI.
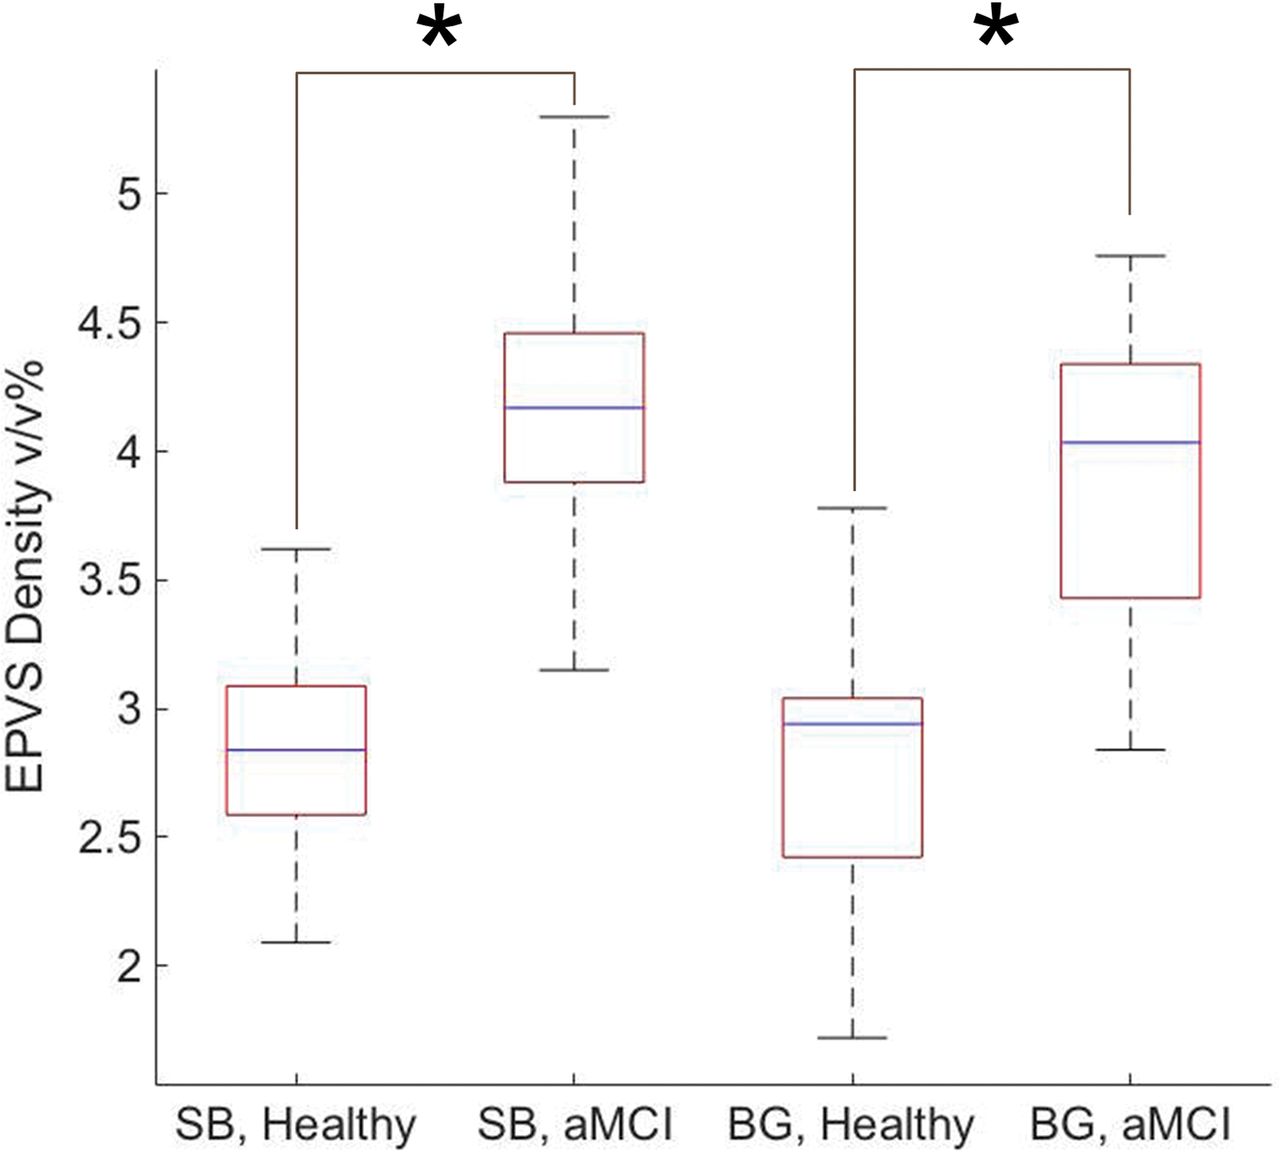
Quantified as a percentage of volume fraction, EPVS density in the white matter and the subcortical structures was calculated to be 2.82 ± 0.40 v/v% for the controls and 4.17 ± 0.57 v/v% for the aMCI group with P < .001. EPVS density in the basal ganglia was 2.74 ± 0.57 v/v% for the controls and 3.90 ± 0.62 v/v% for the aMCI cohort with P < .001. Figure 4 depicts these findings in a boxplot form.

Summarized EPVS densities within the middle part of the subcortical brain (SB) and the basal ganglia (BG) of healthy controls and subjects with aMCI. The asterisk indicates P < .001.
Figure 5 depicts the receiver operating characteristic curve for using EPVS as a differentiating biomarker between subjects with aMCI and controls. The area under the curve is 0.96, with the 95% confidence interval between 0.89 and 1.00 and the standard error being 0.04. The threshold value that achieves the best compromise between sensitivity (92.86%) and specificity (93.33%) is 3.35 v/v%.

The receiver operating characteristic curve for using EPVS as a differentiating biomarker between aMCI and cognitively healthy individuals. The area under the curve is 0.96, the 95% confidence interval is 0.89–1.00, and the standard error is 0.04. The cutoff point that gives the best sensitivity (92.86%) and the specificity (93.33%) is 3.35 v/v%.
Discussion
In this study, we quantified the EPVS density with an automatic segmentation algorithm in patients with MCI and investigated whether EPVS density may be a useful imaging biomarker for the diagnosis of MCI at the clinically available magnetic field strength of 3T.
Improving on the previous study at 7T,23 we implemented the EPVS quantification method for the MR imaging dataset collected on a clinical 3T scanner. Compared with 7T EPVS MR imaging, the lower magnetic field strength of these scanners entails a lower detection sensitivity and a reduced signal-to-noise ratio.29 However, it has the benefit of a more homogeneous radiofrequency B1 field, a feature that is appreciated for segmenting EPVS on the basis of a pixel-wise spatial gradient. Most important, EPVS quantification from clinically accessible 3T MR imaging has a higher potential for clinical applications.
The algorithm used in this study performed better at correctly identifying true EPVS at the cost of capturing all the true EPVS pixels in any given brain slice, as evidenced by its lower false-positive rate and the comparatively higher false-negative rate. This lower false-positive rate and the comparatively higher false-negative rate can be explained by the threshold values used in the segmentation process. These values were selected via trial and error, with the aim of maximizing identification of true EPVS, minimizing segmentation of unrelated structures, and using consistent threshold parameters across all subjects. If one assumed that healthy brains are associated with smaller PVS, this conservative PVS recognition strategy may overestimate the difference between MCI and healthy subjects to some extent. Our results show that the EPVS density in a patient with aMCI is significantly higher than that in controls, both in the subcortical brain as a whole and in the basal ganglia separately. This finding suggests that quantitative EPVS density may be a sensitive imaging biomarker with utility in aiding the diagnosis of aMCI.
The detection of MCI remains one of the biggest clinical challenges in the management of neurologic pathologies.11,16,17 MCI is a relatively common condition in the elderly, with its prevalence reported to be 15%–20% in individuals 65 years of age or older.30 Current research suggests that the MCI population progresses to dementia at a greater rate than those without this condition.31,32 Anywhere from 32%–38% of individuals with MCI progress to AD in 5 years or longer.32,33 Annual rates of progression have been estimated to be 10%–15%.9⇓⇓–12 These findings have naturally generated an interest in using disease-modifying agents to not only preserve cognitive function in individuals with MCI but also slow their conversion to dementia.14 Given the significant difference between the EPVS densities in patients with MCI and cognitively intact individuals as evidenced by our results, incorporating EPVS quantification into the diagnostic work-up of MCI could help eliminate some of the prevailing uncertainty surrounding its diagnosis, allowing earlier intervention and better clinical outcomes.
Past literature has demonstrated that the entire CSF space and the cerebral ventricular volume increase due to brain tissue atrophy in patients with MCI and AD.34 Measurement of total CSF space or cerebral ventricular volume with MR imaging may provide a simpler quantitative method to examine neuropathologic changes associated with MCI and AD.35 However, given that PVS function as a conduit for the drainage of interstitial fluid and solutes from the brain, the measurement of EPVS reflects brain functionality that may be independent of brain tissue atrophy. Hence, EPVS may be an earlier functional signature than structural brain atrophy during the aging process. Testing such a hypothesis will be our future research interest.
Although receiver operating characteristic curve analysis demonstrated >90% sensitivity and specificity for the differentiation of patients with MCI and healthy controls on the basis of quantified EPVS density, some caution is warranted because fundamentally increased EPVS density may not be a specific feature of MCI. It has been observed in a variety of other physiologic and pathologic neurologic conditions, such as normal aging, hypertension, and Parkinson disease.5⇓⇓–8 EPVS density may therefore be best used to substantiate a suspected diagnosis of MCI in the presence of its other clinical features as opposed to being used as a screening test. Nevertheless, the higher sensitivity of our method underscores its potential as a confirmatory test for the early diagnosis of MCI.36
One limitation of this study is that we confined our analyses to the middle region of the brain because the cerebellum posed a unique challenge to our segmentation process. A large volume of the cerebellum is occupied by its finely structured cortex,37 which appears hyperintense with respect to its surrounding tissues on T2-weighted MR images, a feature it shares with EPVS. This leads our algorithm to misidentify the cerebellar cortex as part of the EPVS. Thereafter, we excluded this brain region from our analysis. Additionally, given that the quantification of the pixel-wise spatial gradient can be affected by the signal-to-noise ratio, spatial resolution, and so forth, our technique for EPVS segmentation requires the MR images to be collected under the same imaging setup as well as with the same acquisition sequence and parameters. This may pose a challenge for large-scale multicenter studies or studies involving the use of MR imaging scanners from different vendors. A way to make the EPVS quantification consistent across multiple sites and vendors remains to be studied.
A second limitation is the lack of data on the prevalence of vascular disease, such as diabetes and hypertension, within the study population. Such conditions can precipitate microvascular changes within the brain and are well-known risk factors for lacunar infarcts. The presence of subcortical infarcts was additionally not assessed in these subjects. Because both lacunar and subcortical strokes leave MR imaging footprints within the regions that contain the PVS, they can confound our algorithm, causing it to mistake those footprints for EPVS. Whether our algorithm performs just as well in patients with known vascular disease and brain infarcts would be an intriguing question to probe in our future studies. Additional features of the brain with MCI, such as the severity of hippocampal atrophy, could also be incorporated in future investigations to provide a more detailed picture of the imaging features of MCI.
Another limitation is the lack of 3T MR imaging data for patients with AD. Although Cai et al23 have already established that the EPVS density is similarly increased in patients with AD in MR images acquired at 7T, it would be interesting to compare the EPVS level between patients with MCI and those with AD at 3T to understand the time course of PVS enlargement during the development of AD from cognitively intact, to MCI, and, finally, to clinically manifest dementia or AD. With a large sample size, it will also be interesting to see whether EPVS density can discriminate patients with MCI whose clinical symptoms are less evident and who have low neuropsychiatric testing scores. These characteristics could further enhance the utility of EPVS quantification as a tool for monitoring dementia progression and regression in response to treatment.
Conclusions
The quantitative EPVS segmentation method allows automatic mapping of EPVS from MR images acquired on a clinical 3T MR imaging scanner. EPVS density was found to be significantly higher in patients with aMCI compared with age-matched cognitively healthy control subjects. Therefore, EPVS density may be a useful imaging biomarker for the diagnosis of MCI.
Acknowledgments
We thank Dr David Wolk, Associate Professor of Neurology at the University of Pennsylvania and Co-Director of the Penn Memory Center, and his clinical research coordinator, Ms Grace Stockbower, for recruiting and acquiring the MR images of the subjects used in this study.
Footnotes
Disclosures: Xiaohong J. Zhou—UNRELATED: Consultancy: Horizon Medical Physics Services, Comments: consultant and ownership interest; Employment: University of Illinois at Chicago, Comments: faculty employee; Grants/Grants Pending: AbbVie, Comments: contracts with AbbVie on research projects; Royalties: Elsevier, Comments: royalty payment for a book. Paul Yushkevich—RELATED: Grant: National Institutes of Health, Comments: AG037376.* *Money paid to the institution.
This study was supported by the National Institute of Biomedical Imaging and Bioengineering of the National Institutes of Health under award number R21 EB023516.
Indicates open access to non-subscribers at www.ajnr.org
References
- Received February 8, 2018.
- Accepted after revision June 2, 2018.
- © 2018 by American Journal of Neuroradiology


Jump to section
Related Articles
Cited By...
- A Systematic Review and Meta-Analysis of Automated Methods for Quantifying Enlarged Perivascular Spaces in the Brain
- Lesion Volume in Relapsing Multiple Sclerosis is Associated with Perivascular Space Enlargement at the Level of the Basal Ganglia
- Increasing age is independently associated with higher free water in non-active MS brain - A multi-compartment analysis using FAST-T2