
Abstract
BACKGROUND AND PURPOSE: Noninvasive venous oxygenation quantification with MR imaging will improve the neurophysiologic investigation and the understanding of the pathophysiology in neurologic diseases. Available MR imaging methods are limited by sensitivity to flow and often require assumptions of the hematocrit level. In situ postmortem imaging enables evaluation of methods in a fully deoxygenated environment without flow artifacts, allowing direct calculation of hematocrit. This study compares 2 venous oxygenation quantification methods in in situ postmortem subjects.
MATERIALS AND METHODS: Transverse relaxation (R2*) mapping and quantitative susceptibility mapping were performed on a whole-body 4.7T MR imaging system. Intravenous measurements in major draining intracranial veins were compared between the 2 methods in 3 postmortem subjects. The quantitative susceptibility mapping technique was also applied in 10 healthy control subjects and compared with reference venous oxygenation values.
RESULTS: In 2 early postmortem subjects, R2* mapping and quantitative susceptibility mapping measurements within intracranial veins had a significant and strong correlation (R2 = 0.805, P = .004 and R2 = 0.836, P = .02). Higher R2* and susceptibility values were consistently demonstrated within gravitationally dependent venous segments during the early postmortem period. Hematocrit ranged from 0.102 to 0.580 in postmortem subjects, with R2* and susceptibility as large as 291 seconds−1 and 1.75 ppm, respectively.
CONCLUSIONS: Measurements of R2* and quantitative susceptibility mapping within large intracranial draining veins have a high correlation in early postmortem subjects. This study supports the use of quantitative susceptibility mapping for evaluation of in vivo venous oxygenation and postmortem hematocrit concentrations.
ABBREVIATIONS:
- QSM
- quantitative susceptibility mapping
- R2*
- transverse relaxation rate
- RESHARP
- regularization enabled sophisticated harmonic artifact reduction for phase data
- SvO2
- venous oxygen saturation
Determination of regional brain oxygen use is important for improved understanding of the pathophysiology of neurologic disease such as stroke,1 malignancy,2 and demyelinating conditions.3 MR imaging methods, which are noninvasive, can be used to calculate the oxygen extraction fraction to infer cellular oxygen use. Gradient-echo methods are advantageous because they have relatively fast imaging times for volume coverage. Several gradient-echo methods have been proposed, including single-vessel-decay modeling,4 phase-signal difference analysis,5 and quantitative susceptibility mapping (QSM).6 QSM is a novel technique that extrapolates volumetric susceptibility values from gradient-echo phase images. QSM is promising for this application because unlike phase images, QSM venous oxygen saturation (SvO2) measurements are not dependent on vessel orientation to the main magnetic field.
Several studies have shown that venous oxygen saturation calculations with a QSM approach yield close to expected average values in healthy controls.6,7 However, these studies had no criterion standard comparison, and to determine SvO2, they required exact knowledge of the local hematocrit level. Furthermore, flowing blood may introduce additional phase artifacts. In a postmortem environment, all blood vessels are 100% deoxygenated and blood is stationary, which enables direct noninvasive measurement of hematocrit.
In situ postmortem intravascular changes have been previously evaluated with CT8; however, they have not been studied with iron-sensitive MR imaging methods. Several physiologic changes occur in the early postmortem period, including a shift from oxy- to deoxyhemoglobin, cellular lysis and hemoglobin diffusion,9 and a settling (or hematocrit) effect as demonstrated with CT.8,10,11 Transverse relaxation rate (R2* = 1/T2*) and susceptibility mapping are robust methods for evaluating intracranial brain matter iron concentration but can be sensitive to motion artifacts from whole-head motion and from intravascular flow. Postmortem analysis allows accurate comparison of advanced iron-sensitive quantitative MR imaging methods, including R2* mapping and QSM imaging of veins, without the confounder of motion and flow artifacts.
This study compared QSM and R2* measurements within major intracranial draining veins in postmortem subjects. By means of QSM, variations in hematocrit with spatial location were examined. Susceptibility measurements were additionally performed with healthy in vivo subjects, and calculated SvO2 values were compared between different intracranial venous vascular segments and previously reported values.6,12,13
Materials and Methods
Venous Oxygenation and Magnetic Susceptibility
The susceptibility shift between water and venous blood has been described as
 where SvO2 is the percentage oxygen saturation of venous blood, Hct is the hematocrit, Δχdo is the susceptibility shift per unit hematocrit between fully oxygenated and fully deoxygenated red blood cells, and Δχoxy−water is the susceptibility shift between oxygenated red blood cells and water.14,15 Δχdo is assumed to be 0.27 ppm16 in centimeters-grams-second units. Δχoxy−water is assigned −0.03 ppm,14 and hematocrit (Hct) is set to 40% for in vivo subjects.
For postmortem subjects, this equation is simplified because the blood is fully deoxygenated; therefore, SvO2 is set to zero. The hematocrit can therefore be calculated as

MR Imaging Acquisition
MR imaging data were acquired using a 4.7T whole-body imaging system (Unity Inova; Varian Medical Systems, Palo Alto, California). Ten healthy control subjects (age range, 24–54 years; average, 32 years) and 3 postmortem subjects were imaged after institutional review board approval. The 3 postmortem subjects were in a palliative state before death and were imaged in situ 7, 6, and 28 hours after death, respectively, for postmortem subjects 1, 2, and 3. These patients had been previously studied for deep gray matter tissue iron.17,18 The postmortem subjects had a relatively unchanged supine flat body and head position during the postmortem period. Hematocrit values from the most recent clinical laboratory tests were obtained, retrospectively, from the clinical charts.
The MR imaging protocol for each patient consisted of 2 axial MR imaging methods: multiecho gradient-echo R2* mapping (8.9 minutes) and single-echo gradient-echo QSM imaging (6.6 minutes). The healthy control subjects and postmortem subject 2 did not undergo imaging with the R2* mapping sequence.
Images were acquired with a standard birdcage head coil for transmission and a tight-fitting 4-element array coil for signal reception. Due to size limitations, the birdcage coil was used for reception and transmission in postmortem subject 3.
Axial 3D R2* mapping was acquired with full-brain coverage (160 mm) and parameters as follows: TR, 44 ms; 10 echoes with 4.0–4.2 ms echo spacing; first echo, 2.9–3.2 ms; flip angle, 11°; FOV, 256 × 128–160 × 160 mm; matrix, 256 × 160 × 80; voxel size, 1 × 0.8–1 × 2 mm.
Axial QSM imaging and magnitude gradient-echo imaging used a 2D single gradient-echo with first-order flow compensation acquired with parameters as follows: TR, 1540 ms; TE, 7–15 ms; 50 contiguous sections; section thickness, 2 mm; flip angle, 70°; FOV, 214–256 × 3 × 163–192 mm; matrix, 512 × 256–392; voxel size, 0.42–0.5 × 0.42–0.5 × 2 mm.
Image Processing
QSM.
From the 2D single gradient-echo sequence, phase images from the 4 receiver channels were first optimally combined using the adaptive filter method.19 (This step was not needed in postmortem subject 3 due to the single birdcage receiver.) A binary brain volume mask was extracted from the magnitude images using the FSL Brain Extraction Tool (http://fsl.fmrib.ox.ac.uk/fsl/fslwiki/BET).20 The fractional intensity threshold was set to 0.2, and the smoothness factor was set to 2 for the Brain Extraction Tool. Combined phase images were unwrapped in 3D using the Phase Region Expanding Labeller for Unwrapping Discrete Estimates/FMRIB Software Library (PRELUDE; https://fsl.fmrib.ox.ac.uk/fsl/fslwiki/FUGUE/Guide#PRELUDE_.28phase_unwrapping.29) method. The residual phase offset from the receiver channel combination was removed using a 3D second-order polynomial fit. The large macroscopic background phase from the air-tissue susceptibility interface was removed using the regularization enabled sophisticated harmonic artifact reduction for phase data (RESHARP) method,21 resulting in a local phase map of the brain. The RESHARP spheric kernel was set to 3 mm, and the Tikhonov regularization parameter was set to 5 × 10⁻⁴. Due to the implementation of the RESHARP method, a 3-mm brain edge was discarded. A local field map with units of parts-per-million was generated by normalizing the local phase with TE and field strength. A dipole field inversion was performed on the local field map using the total variation regularization method,6,22 with the regularization parameter set to 5 × 10⁻⁴. Susceptibility values were calculated in Système International d'Unités units.
R2* Map.
R2* maps were produced from the 3D multiecho gradient-echo sequence using a weighted least-squares monoexponential fit of the 10 echoes.23 Before fitting, a linear field-gradient correction algorithm was applied to recover signal losses from air-tissue interfaces.24 Composite magnitude T2*-weighted images were created from the susceptibility-corrected images.25
Venous Susceptibility Measurements
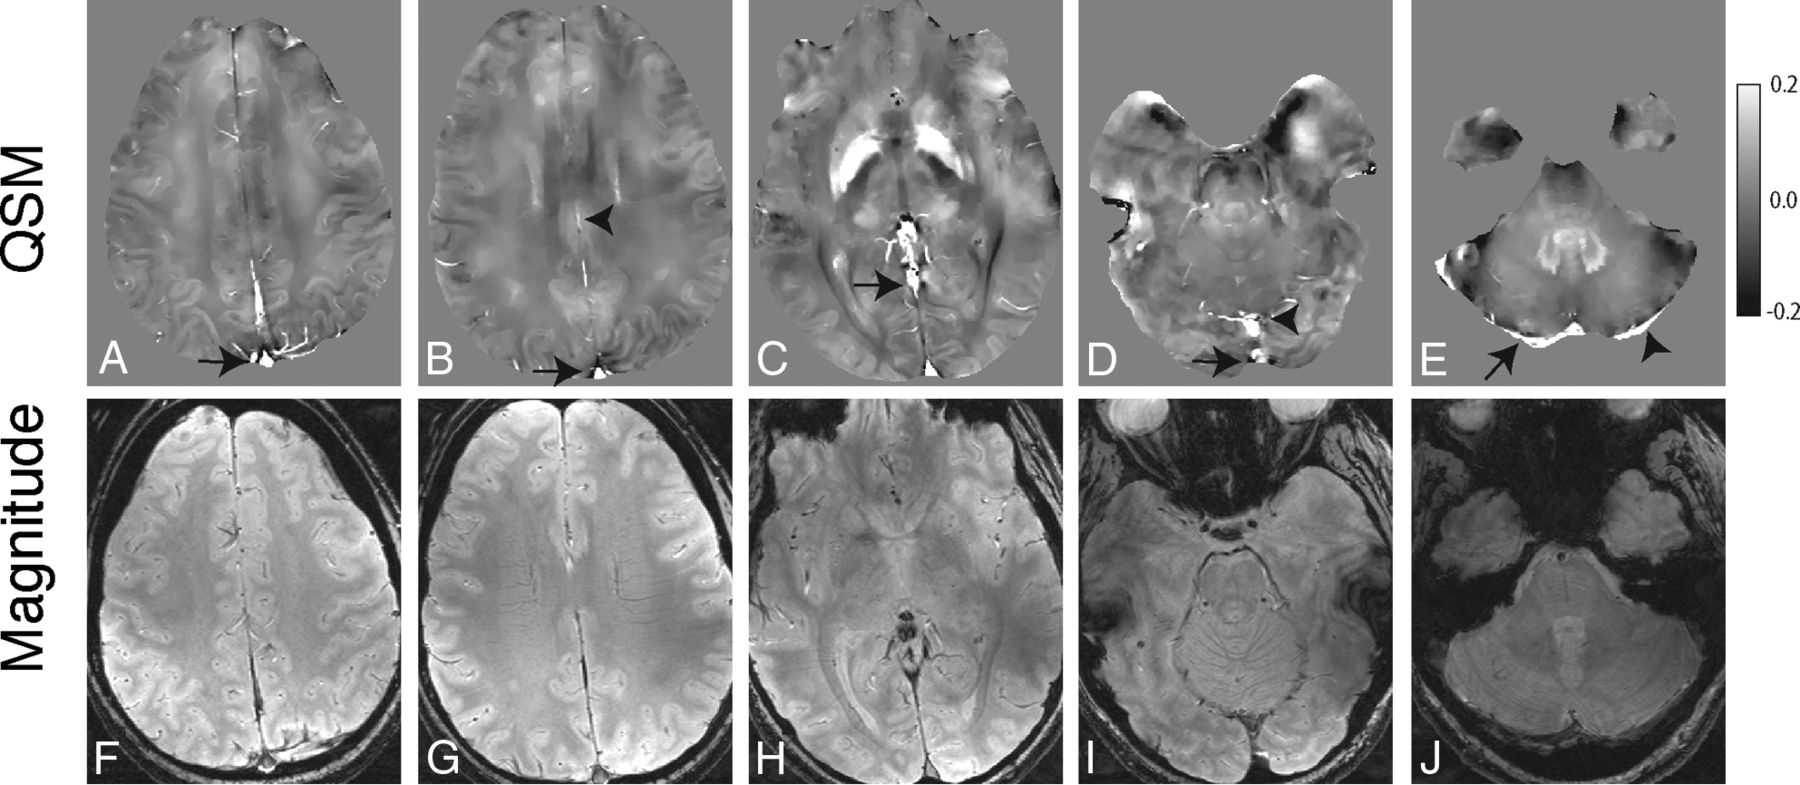
ROI measurements from multiple venous segments were acquired from axial QSM and R2* images using the composite magnitude T2*-weighted gradient-echo images from both acquisitions, to identify venous anatomy. ImageJ26 (National Institutes of Health, Bethesda, Maryland) was used to obtain ROI measurements from 2 to 8 axial images of each venous segment, depending on the length and orientation (Fig 1). In each subject, measurements were obtained from the following venous segments: superior sagittal sinus (posterior superior aspect), superior sagittal sinus (posterior inferior aspect), posterior right transverse sinus near the confluence, posterior left transverse sinus near the confluence, anterior aspect of the straight sinus, posterior aspect of the straight sinus, and inferior sagittal sinus.

Axial QSM (A–E) and single-echo gradient-echo magnitude (F–J) images from 1 in vivo subject demonstrating representative venous segments from which we obtained ROI measurements: superior aspect of the superior sagittal sinus (arrow, A), inferior aspect of the superior sagittal sinus (arrow, B) and inferior sagittal sinus (arrowhead, B), anterior aspect of the straight sinus (arrow, C), inferior aspect of the superior sagittal sinus (arrow, D) and posterior aspect of the straight sinus (arrowhead, D), right transverse sinus (arrow, E), and left transverse sinus (arrowhead, E).
For postmortem subjects, hematocrit values were calculated on the basis of Equation 2. SvO2 values were calculated for in vivo subjects on the basis of Equation 1, assuming a hematocrit of 40%.
Linear regression analysis was performed using SPSS software (Version 24.0 for Macintosh; IBM, Armonk, New York) between R2* and QSM ROI measurements in the 2 postmortem subjects in whom both methods were implemented.
Results
In the 3 postmortem subjects, intravenous susceptibility measurements and calculated hematocrit values were higher in more gravitationally dependent venous segments across all 3 subjects (Tables 1 and 2). Susceptibility in the superior aspect of the superior sagittal sinus was lower than in the inferior aspect of the superior sagittal sinus in the 2 subjects in whom it was compared, while subject 1 had artifacts within the inferior aspect of the superior sagittal sinus, precluding measurement. Susceptibility in the anterior aspect of the straight sinus was lower than in the posterior aspect in all 3 subjects. Although the postmortem subjects were imaged in the supine position, some had minor left/right rotation (Fig 2). Sagittal images in Fig 2 were first rotated in the axial plane to obtain a midsagittal projection.
Comparison among R2*, susceptibility measurements, and calculated hematocrit values in intracranial veins in 3 postmortem subjects
Percentage decrease in hematocrit between contiguous venous segments in postmortem subjects

Axial T2*-weighted images and isotropically interpolated sagittal reformats using the single-echo gradient-echo sequence. Postmortem subjects 1 (A and D), 2 (B and E), and 3 (C and F) demonstrate head positioning in these planes (axial and sagittal, respectively).
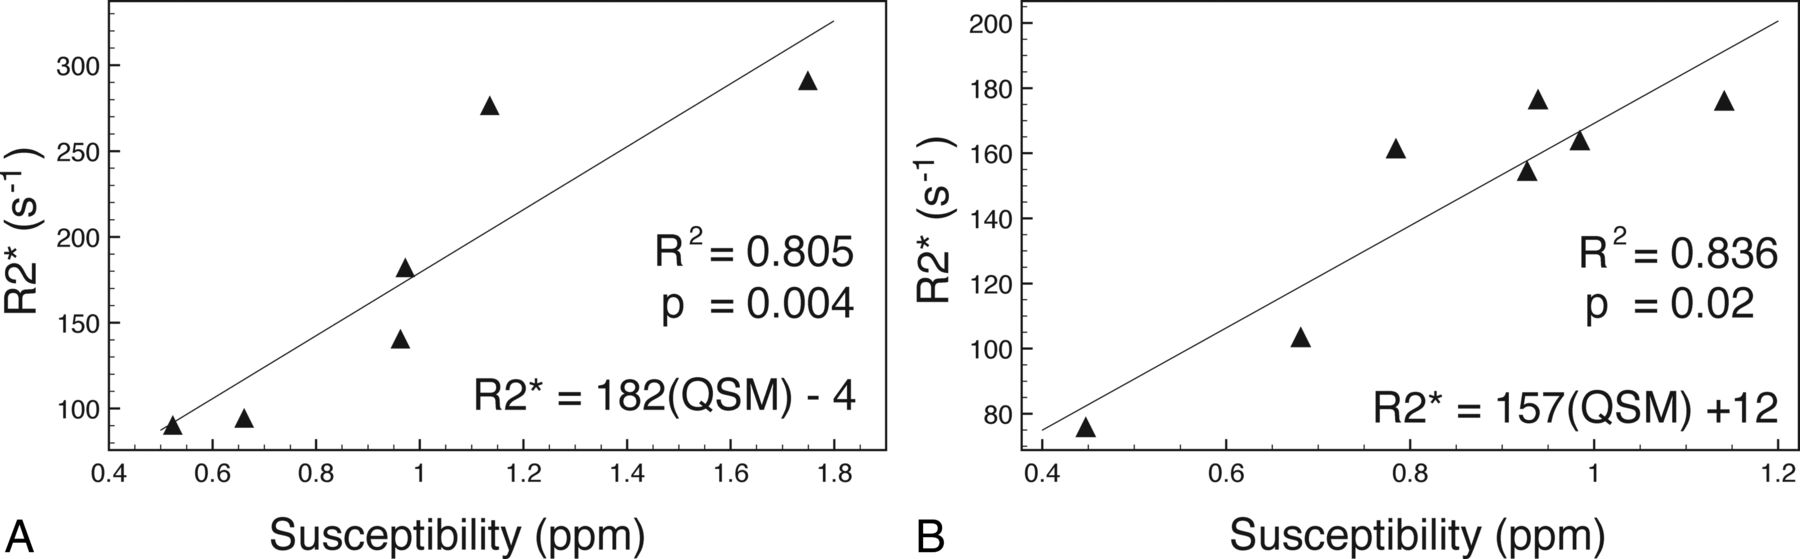
R2* values had a strong and significant correlation (subject 1: R2 = 0.805, P = .004; subject 3: R2 = 0.836, P = .02) to susceptibility measurements within the 2 subjects in whom measurements were compared (Fig 3 and Table 1). The 2 regressions had a similar linear regression line slope (Fig 3). Visual comparison of axial images of the same territory demonstrates hyperintensity of veins on R2* maps and corresponding susceptibility maps in postmortem subjects (Fig 4). Calculated hematocrit values in the 3 postmortem subjects ranged from 0.102 to 0.580 (Table 1). This is comparable with the hematocrit values obtained before death (subject 1 = 0.40, acquired 5 days before death; subject 2 = 0.38, acquired 4 weeks before death; and subject 3 = 0.49, acquired 4 months before death).

Scatterplot with linear regression of 2 postmortem subjects comparing QSM and R2* ROI measurements within venous segments. A, Subject 1. B, Subject 3.

Axial R2* maps (A–C) and corresponding QSM (D–F) images depicting representative venous segments (right and left transverse sinus, A and D; inferior aspect of superior sagittal sinus and anterior aspect of straight sinus. B and E; superior aspect of superior sagittal sinus and inferior sagittal sinus, C and F) in postmortem subject 3 (A, C, D, F) and subject 2 (B and E). For the R2* images, values of >500 seconds−1 were removed to reduce visual washout from bright R2* intravenous voxels and from bone/air.
Susceptibility values within the venous segments evaluated from in vivo subjects did not follow the same gravity-dependent distribution compared with postmortem subjects (Table 3) in the contiguous venous segments of the superior saggital sinus and the straight sinus. SvO2 measurements in Table 4 were calculated using Equation 1.
Susceptibility measurements (ppm) from intracranial venous segments in 10 healthy subjects
Calculated percentage SvO2 for intracranial venous segments in 10 healthy subjects
Discussion
This study is the first to evaluate and compare QSM and R2* mapping in postmortem intracranial venous vasculature.
In the postmortem period, intravascular blood undergoes several changes, including hypostasis, which can lead to gravity-dependent hemoconcentration; hemolysis, which may depend on the circumstances surrounding death; cell-shape alteration; thrombosis; and thrombolysis.9,27 The relative contribution of each process has been previously studied and can be variable among individual patients.9 Despite these various changes, there is a strong linear correlation between R2* and susceptibility measurements, which is predicted by the static dephasing regime for geometric shapes.28,29 Dependent hemoconcentration is demonstrated with both R2* and QSM measurements in this study. This effect is seen as early as 6 hours and persists up to at least 28 hours after death. The supine head and body position of each subject throughout the postmortem period led to increased values in the more posterior segments of contiguous venous segments. The susceptibility measurements in the dependent venous segments are similar to susceptibility measurements in in vivo intracranial hemorrhage at least 24 hours in age.30
There was no appreciable difference in the percentage change in hematocrit within gravity-dependent portions of contiguous venous segments based on the time since death; however, the few subjects in this study preclude statistical analysis. This study differs from studies that directly evaluated hemoconcentration effects within the appendicular body, which showed that there may be an ongoing increase in hematocrit in dependent veins for up to 96 hours.27,31 This could indicate that intracranial gravity-dependent hemoconcentration occurs relatively early in the postmortem period and persists for at least 28 hours. The initial postmortem hematocrit is unknown in this study; however, it is likely less than the measured laboratory values when the patients were alive due to the long time interval between acquisition and death in subjects 2 and 3. The palliative state of the patients may have resulted in a decrease in hematocrit during the interval. Additionally, Equation 2 may not be entirely valid because factors such as hemolysis, alteration in cell shape, and hemoglobin diffusion may change the susceptibility of deoxygenated hemoglobin. However, cellular lysis is likely not a major contributor in the early postmortem period of this study.27 Additionally, these factors could contribute to the calculated hematocrit values being slightly less than direct laboratory measurements in subjects 2 and 3.
In vivo calculated SvO2 measurements are slightly higher in this study compared with other recent studies6,7; however, they follow a similar distribution within veins, with the straight sinus and transverse sinuses having the lowest SvO2 and the inferior sagittal sinus having the largest SvO2. Several invasive studies that measured SvO2 within the jugular bulb and confluence of the sinuses13,32 suggest that the SvO2 in these regions should exceed 55% in healthy individuals, which was not seen in some subjects in a recent QSM vein oxygen saturation study.6 This difference may be due to the RESHARP phase-removal method being more accurate at brain edges.21
Intravascular QSM and R2* venous oxygen measurements have benefits compared with intravascular SWI measurements6 or methods of measuring subvoxel vasculature oxygenation with T2*-weighted methods.4 These other methods are dependent on the angular orientation of the measured vessel to the main magnetic field. R2* mapping, however, requires several image acquisitions with varied TEs and therefore may be more sensitive to global patient motion due to the longer image-acquisition time. Flow compensation could be used with increased image-acquisition time. Postmortem imaging allows accurate comparison between motion-sensitive MR imaging methods. Modifications to this R2* mapping method can be applied to in vivo subjects with flow compensation or electrocardiography-gated acquisition33 to reduce flow artifacts.
There are several limitations to this study. Although the correlation between R2* and susceptibility is strong and significant in the postmortem subjects, the number of postmortem subjects is limited. Using a larger number of subjects with varying time intervals of imaging after death could help evaluate measurement changes in the early postmortem period relative to the time of death. QSM was not applied to the full cerebral volume, and relatively large voxels were used to reduce image-acquisition times, to use methods appropriate for in vivo imaging. Laboratory hematocrit values from postmortem subjects were not obtained directly before death due to the patients' palliative state before imaging. As well, laboratory analysis of intravenous blood changes in the postmortem state were not evaluated and compared with MR imaging findings, which could be an important future investigation. This could elucidate the relative contribution of cell lysis, molecular degradation, cellular swelling, and hematocrit effect to quantitative MR imaging values. The R2* mapping method in this study did not use flow compensation to obtain sufficient echoes for accurate R2* calculations. Therefore, the method could not be used to evaluate venous oxygenation in in vivo subjects.
In the future, application of SvO2 methods using QSM could be used in neurologic disease to assess altered cellular oxygen metabolism. Optimal phase removal and QSM methods need to be determined because several methods currently exist. R2* mapping methods and QSM imaging could be compared among in vivo subjects using flow-compensated R2* mapping techniques.
Conclusions
Quantitative intracranial venous measurements with MR imaging using R2* mapping and QSM have a high correlation in early postmortem subjects, and calculated hematocrit values are within the expected range. Both methods demonstrated a hemoconcentration effect in dependent venous segments in postmortem subjects, which is similar to direct hematocrit measurements and CT findings from prior postmortem studies.
Footnotes
Disclosures: Andrew J. Walsh—RELATED: Grant: Canadian Institutes of Health Research grant MOP 102582.* Derek J. Emery—RELATED: Grant: Canadian Institutes of Health Research.* Alan Wilman—RELATED: Grant: Canadian Institutes of Health Research.* *Money paid to the institution.
This work was supported by the Canadian Institutes of Health Research grant MOP 102582.
Indicates open access to non-subscribers at www.ajnr.org
References
- Received August 7, 2017.
- Accepted after revision April 1, 2018.
- © 2018 by American Journal of Neuroradiology


Jump to section
Related Articles
Cited By...
- No citing articles found.