
Abstract
BACKGROUND AND PURPOSE: MR imaging–pathologic studies have reported that paramagnetic rims on 7T susceptibility-based MR imaging identify, in vivo, the subset of MS lesions with compartmentalized inflammation at the lesion edge and associated remyelination failure. Here, we assessed the reliability of detecting these rims on high-resolution 3T phase images.
MATERIALS AND METHODS: High-resolution T2* and phase MR imaging was collected in 20 patients with MS at 3T (3D segmented EPI, 0.65 mm3) and 7T (2D gradient-echo, 0.2 × 0.2 × 1 mm) MR imaging. In each case, 5 discrete chronic (nonenhancing) MS lesions were selected on T2 FLAIR images for rim evaluation. Five raters experienced in MS imaging contributed to the rim assessment, of whom 3 worked independently on 3T data, and 2, on 7T data. Consensus agreement was reached for both 3T and 7T rim evaluations. Discrepancies between 3T and 7T were discussed, and consensus was reached.
RESULTS: Phase rims were seen in 34 lesions at 7T and in 36 lesions at 3T by consensus. Inter- and intrarater reliability were “substantial/good” both at 3T and 7T analysis (Cohen κ, >0.71). Based on consensus agreement, the reliability of rim visualization at 3T versus 7T was 0.78 (κ) with a pair-wise agreement of 90%. More lesions were judged to be false-positive or false-negative at 3T than at 7T.
CONCLUSIONS: Nearly all 7T paramagnetic rims can also be seen at 3T. Imaging at 3T opens the possibility of implementing paramagnetic rims as an outcome measure in multicenter, MR imaging–based clinical trials aimed at treating perilesional persistent inflammation and its potential effects on remyelination.
ABBREVIATIONS:
- EDSS
- Expanded Disability Status Scale
- QSM
- Quantitative Susceptibility Mapping
In multiple sclerosis, plaques of demyelination, the hallmark of this disease, can present simultaneously at different pathologic stages.1,2 Especially relevant from a disease perspective are 2 types of chronic plaques that can be considered opposite ends of the pathologic spectrum: lesions in which, after active inflammatory demyelination, the repair process has been relatively efficient (leading to remyelination), and lesions in which regeneration has completely failed, due, in part, to residual compartmentalized inflammation at the lesion margin (ie, chronic active/slowly expanding/smoldering lesions, henceforth denoted “chronic active”).1,2
Chronic active lesions are pathologically characterized by a hypocellular demyelinated core and a hypercellular edge of activated microglia/macrophages related to smoldering inflammation and axonal degeneration.1,2 On MR imaging, these lesions have a characteristic paramagnetic rim on 7T susceptibility-based MR imaging sequences; the paramagnetic shift is due to the stable presence of iron-laden activated microglia/macrophages3⇓⇓⇓⇓⇓⇓⇓–11 and, potentially, reactive astrocytes12 at the lesion edge. Usually, paramagnetic rims are seen on 7T phase images, but a proportion can also be detected on 7T T2* magnitude images, mostly when iron content is higher.4⇓–6,13,14 In the context of early lesion evolution, we recently reported that paramagnetic rims in active lesions colocalize with peripheral or centripetal gadolinium enhancement14 and that persistence of these rims after restoration of the blood-brain barrier (ie, approximately 3 months after initial demyelination) predicts failure of tissue repair and remyelination.10 Thereafter, in chronic lesions, rims have been shown to be stable during short-to-medium-term follow-up (up to 3.5 years)13⇓–15 and are not known to be affected by current disease-modifying treatments. These results establish paramagnetic rims as potential outcome measures in MR imaging–based clinical trials of therapies that might treat perilesional persistent microglial-/macrophage-driven inflammation.
Because 7T MR imaging scanners remain relatively sparse and confined to major academic centers in developed countries, the ability to reliably identify paramagnetic rims on more widespread, lower field strength (3T) scanners seems to be a necessary step toward application in multicenter clinical trials and—as important—clinical practice. A proper investigation of the detection of paramagnetic rims on 3T susceptibility-based MR images is necessary to achieve this. Here, we aimed to assess the reliability of visualizing 7T paramagnetic rims (our criterion standard in vivo) on high-resolution 3T susceptibility-based MR images in 20 patients with MS. At 3T, we implemented a 0.65-mm isotropic voxel, whole-brain 3D segmented echo-planar imaging sequence that is already known in the MS imaging field for its benefits in assessing the central vein sign within MS lesions.16⇓⇓⇓⇓–21
Materials and Methods
Participants
Under an institutional review board–approved natural history protocol, we recruited, from May 2012 to December 2016, twenty individuals with MS (15 women/5 men; mean age, 46 years; range, 28–71 years; all fulfilling the 2017 McDonald revised MS criteria22). Sixteen had relapsing-remitting and 4 had progressive MS.23 Experienced MS clinicians determined disability according to the Expanded Disability Status Scale (EDSS)24 and obtained clinical data. The median EDSS score was 1.5 (range, 0–7), and mean disease duration was 14 years (range, 1–40 years); clinical data were collected at the first MR imaging acquisition (Table 1).
Clinical and demographic data
MR Imaging Acquisition
Participants underwent 2 MR imaging acquisitions approximately a year apart, one on a Magnetom Skyra (Siemens, Erlangen, Germany) 3T scanner (equipped with a body transmit coil and a 32-channel receive coil) and one on a Siemens Research System 7T MR imaging scanner (equipped with a birdcage-type transmit coil and a 32-channel receive coil). The mean time lapse between the first and second MR imaging was 0.9 years (median, 0.7 years; range, 2 days to 3.4 years). Because paramagnetic rims in chronic lesions have been shown to be stable with time,13⇓–15 including in our cohort, we did not implement a maximum time lapse between 3T and 7T scans.
The following details the 3T MR imaging protocol for rim detection:
Whole-brain 3D segmented echo-planar imaging providing T2* magnitude and phase contrasts (TR = 64 ms; TE = 35 ms; flip angle = 10°; acquisition time = 5 minutes 46 seconds; 256 sagittal slices; 0.65-mm isotropic voxels with a voxel size of 0.27 μL).
Whole-brain 3D T2 FLAIR (TR = 4800 ms; TE = 354 ms; TI = 1800 ms; flip angle = 120°; acquisition time = 6 minutes 30 seconds; 176 sagittal slices; 1-mm isotropic voxels with voxel size = 1 μL).
The following details the 7T MR imaging protocol for rim detection:
2D high-resolution gradient recalled-echo providing T2* and phase contrasts (TR = 1300 ms; TE = 32 ms; 29 axial slices; flip angle = 50°; acquisition time = 8 minutes 36 seconds; in-plane resolution = 0.2 × 0.2 mm; slice thickness = 1 mm; voxel size = 0.04 μL). Three minimally overlapping slabs were acquired to allow coverage of most of the supratentorial brain.
Additional MR imaging sequences, including postcontrast T1-weighted images, were typically acquired for clinical or other research purposes at both 3T and 7T MR imaging and were examined qualitatively as part of this study.
MR Imaging Analysis
Phase postprocessing and coregistration among images were performed as previously described.10,14 Postcontrast T1-weighted images were implemented to exclude enhancing lesions from the analysis.
As previously described,6 a chronic lesion was defined as “rim-positive” when it showed a paramagnetic rim signal on phase images while being either hyper- or isointense in its inner portion. The paramagnetic rim assessment included 5 investigators with experience in imaging MS, including 2 neurologists (M.A., M.K.S.), 2 neuroradiologists (A.F., D.S.R.), and an MR physicist (P.S.). On 3T T2 FLAIR images, an investigator (M.A.) selected 5 discrete supratentorial chronic MS lesions (largest diameter of >3 mm) from each case. The lesion location and largest lesion diameter were recorded. To remain masked to data acquired at 3T and 7T, we planned rim assessment as follows:
3T Paramagnetic Rim Assessment
For each selected lesion, 3 investigators (A.F., M.K.S., D.S.R.) independently assessed the presence of paramagnetic rims on 3T phase MR images. T2 FLAIR and phase images were reviewed simultaneously by each investigator using OsiriX software (http://www.osirix-viewer.com). Lesions to be analyzed were marked on MR images with a number and an arrow. A binary code was implemented as 0 = no rim and 1 = rim.
After 4 months, 1 rater repeated the analysis on 3T phase data.
Consensus agreement was subsequently reached by all investigators, and comments were recorded.
7T Paramagnetic Rim Assessment
Similar to the previous analysis, for each selected lesion, an investigator (M.A.) assessed the presence of paramagnetic rims on 7T phase MR imaging.
After 5 months, a second investigator (P.S.) performed the analysis, and the first rater repeated the analysis.
Consensus agreement was subsequently reached, and comments were recorded.
After consensus, discrepancies between rim visualization at 3T versus 7T were retrospectively investigated and discussed. The presence of rims on 3T T2* magnitude images (known to be less sensitive to susceptibility shifts) was assessed retrospectively by consensus of 2 investigators (M.A., P.S.).
Statistical Analysis
Intra- and interrater reliability for rim assessment was computed on the basis of the number of raters, using the Cohen κ (2 raters) and Fleiss κ (3 raters). MR imaging differences (lesion diameter and location) between lesions with-versus-without rims were assessed with a t test and Fisher exact test when appropriate.
Results
One hundred discrete supratentorial chronic MS lesions were initially evaluated (5 lesions per patient). Two lesions were excluded from the final analysis, one for abutting a confluent lesion and one for obvious changes in size at the second time point (time lapse, 1.7 and 1.4 years, respectively). Of the remaining 98 lesions, 35 (36%) were periventricular; 39 (40%), in the deep white matter; and 24 (24%), juxtacortical/leukocortical.
Lesion Rim Assessment at 3T MR Imaging (Masked to the 7T Data)
Of 98 analyzed lesions, 36 had a paramagnetic rim on 3T phase images by consensus agreement. Rim lesions were larger than nonrim lesions (mean diameter, 8.1± 2.3 mm and 6.7 ± 2.3 mm, respectively; t test, P = .007). Overall, we did not notice any preferential lesion location: 13 lesions with rim were periventricular (38% of total periventricular lesions), 14 were in the deep white matter (38% of total deep white matter lesions), and 9 were juxtacortical/leukocortical (38% of total juxtacortical/leukocortical lesions).
The intrarater and interrater agreement results are provided in Table 2. The reliability between each rater and the final consensus agreement was “substantial/good,” with a Cohen κ ranging from 0.71 to 0.79 and a pair-wise agreement ranging from 86% to 90%.
Intra- and interrater agreement for paramagnetic rim evaluation on 3T and 7T phase MRI
Sixteen of 36 lesions with a phase rim (44%) also showed a rim on T2* magnitude images. The presence of a T2* rim was significantly associated with the detection of a rim on phase images by consensus (Fisher exact test, P < .0001).
Lesion Rim Assessment at 7T MR Imaging (Masked to the 3T Data)
Of 98 analyzed lesions, 34 had a paramagnetic rim on 7T phase images by consensus agreement. Twenty-one of 34 lesions with a phase rim (62%) also showed a rim on T2* magnitude images (Fig 1). The intrarater and interrater agreement results are provided in Table 2. The reliability between each rater and the final consensus agreement was “almost perfect,” with a Cohen κ ranging from 0.81 to 0.91 and a pair-wise agreement ranging from 91% to 96%.

A right periventricular lesion in a 55-year-old woman with relapsing-remitting MS. A paramagnetic rim can be easily seen on 3T and 7T phase images (magnified view) as well as on the 7T T2* magnitude image (red arrows). On susceptibility images, medullary veins crossing the lesion are also prominent.
Lesion Rim Assessment at 3T versus 7T and Analysis of Disagreements
Rims were seen in 34 lesions on 7T phase images and in 36 lesions on 3T phase images by consensus. The reliability between the consensus agreement at 3T versus 7T was substantial/good, with a Cohen κ of 0.78 and a pair-wise agreement of 90%. After discussion, discrepancies between 3T and 7T were seen in 10 lesions:
Four lesions were considered to have been missed at 3T (“false-negative”). One possible explanation is a small susceptibility effect at the edge of these lesions because none had a T2* rim.
Three lesions identified as having rims at 3T did not have rims at 7T and were therefore considered “false-positive” at 3T. On review, this misinterpretation was thought to be related to a “rim-like” configuration of vessels at the lesion edge.
Two lesions were considered to have been missed at 7T. On review, this was thought to be due to the relatively thick slices in the 7T acquisition (1 mm versus 0.65 mm at 3T).
One lesion, even after re-evaluation, was considered to have a rim at 3T but not at 7T. For this lesion, the 3T scan preceded the 7T scan by 1 month, and none of the other lesions in this case were discordant.
Representative concordant and discordant cases are shown in Figs 1⇓–3.

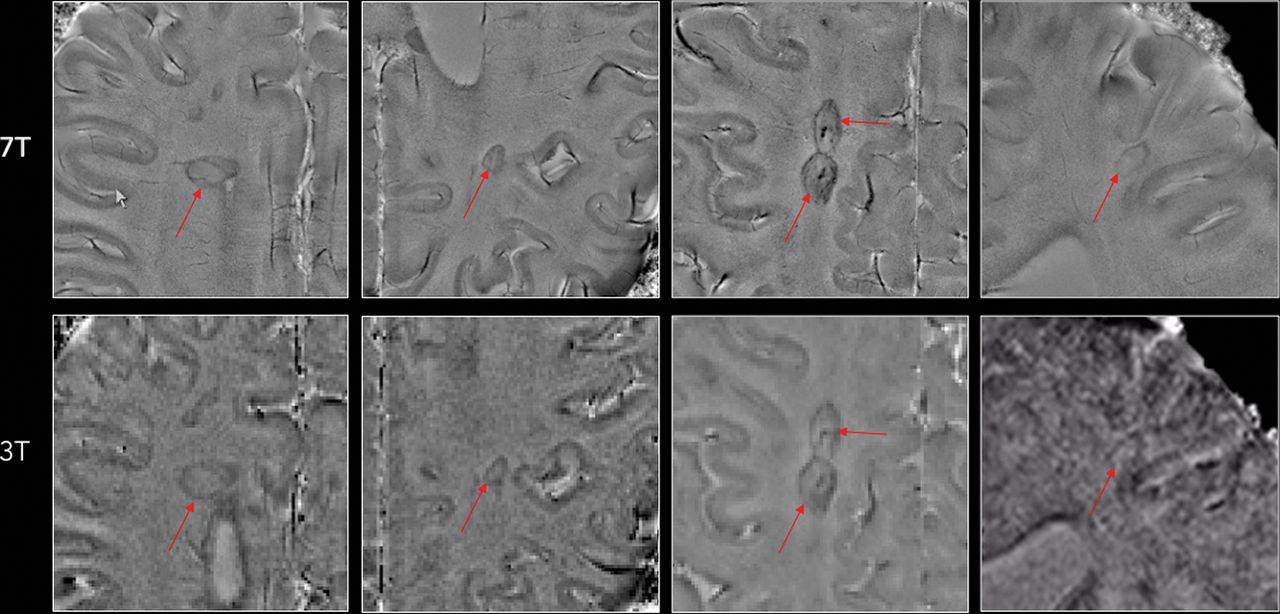
Representative examples of MS lesions in which a paramagnetic rim (red arrows) can be easily seen on both 7T and 3T phase images. Note the superior image quality at 7T in at least 3 of the 4 examples.

A left centrum semiovale lesion in a 30-year-old woman with relapsing-remitting MS; the time lapse between 3T and 7T scans was 6 months. In this case, the lesion was judged to have a rim on 3T (red arrows), but not on 7T phase images. The false-positive rim at 3T is related to the configuration of blood vessels at the lesion edge. On the other hand, the central vein of the lesion is prominent in both phase images (white arrows).
Discussion
In this study, we tested the reliability of 3T susceptibility-based imaging in visualizing 7T-detected paramagnetic rims in nonenhancing MS lesions. Anticipated difficulties revolved mainly around the lower sensitivity of 3T MR imaging to susceptibility effects, as well as the lower voxel volume of the 3T acquisition. At 7T MR imaging, the mean rim thickness in nonenhancing MS lesions has been estimated at ∼430 μm (range, 150–1200 μm),14 indicating the necessity of acquiring submillimeter susceptibility-based imaging. Here, we implemented a 3T whole-brain 3D segmented EPI sequence, providing 0.65-mm isotropic voxels and both T2* magnitude and phase contrasts. This is the optimized sequence for FLAIR* imaging16 and the related assessment of the central vein sign in MS lesions.17⇓⇓⇓–21 The potential of detecting central vein and paramagnetic rims with the same sequence would also be a clear advantage in terms of acquisition time in a clinical setting. In addition, like the central vein, small 7T MR imaging studies showed that lesions with rims are not frequently seen in other inflammatory disorders of the central nervous system such as neuromyelitis optica spectrum disorder25,26 and Susac syndrome.27
Overall, detection of paramagnetic rims performed well at 3T; representative examples are shown in Figs 1 and 2. Intra- and interrater agreement was substantial/good or better28 for both 3T and 7T. Most important, agreement was not perfect at 7T; this outcome suggests that a clear MR imaging definition of what constitutes a rim is necessary for future research studies (population analysis) and/or MR imaging–based clinical trials. In addition, our results suggest that dedicated training in MS MR imaging should be a prerequisite for assessing this important morphologic feature at both 3T and 7T.
The discussion that took place within our group during the consensus process highlighted several important observations about imaging of paramagnetic rim lesions at 3T. On the one hand, rim detection on 3T phase images was more reliable when the rim was seen: 1) on T2* magnitude and phase images, indicating stronger susceptibility effects; 2) on >1 consecutive slice; and 3) on multiple orthogonal views. On the other hand, rim detection was less reliable: 1) in areas with a high density of veins, such as around the ventricular horns; 2) within the corpus callosum; 3) when the rim was seen only partially around the lesion; 4) when the rim did not match the edge of the lesion seen on T2-FLAIR images; and 5) in areas with motion and/or bulk susceptibility artifacts.
One important limitation of phase imaging at both 3T and 7T is the presence of dipolar fields surrounding cerebral vessels and some MS lesions. These dipolar projections may hinder the detection of phase rims (especially thin ones) or may be misinterpreted as (false-positive) phase rims.29,30 One way to remove these dipolar fields is to apply an extra processing step called Quantitative Susceptibility Mapping (QSM), which computes the magnetic susceptibility of tissues by solving the field-to-source inversion problem using the dipole model.31 However, the appearance of QSM images depends heavily on the choice of the algorithm and parameters used for solving the inversion problem.32 Moreover, QSM images are typically smoothed. This step can result in a loss of conspicuity for fine structures such as the thin paramagnetic rims frequently observed in our study (On-line Figure). Therefore, further development is warranted for establishing a robust and effective QSM algorithm that can display all types of paramagnetic rims around MS lesions.
Potential limitations of our study are the limited number of lesions included in the analysis and the sometimes long time lapse between 3T and 7T MR imaging acquisitions, which ranged from 2 days to 3.4 years (mean, 0.9 years, median, 0.7 years). Because paramagnetic rims in chronic lesions have been consistently shown to remain stable for similar durations of follow-up,13⇓–15 any detection difference is more likely to be related to different magnetic strengths (3T versus 7T) than to the biologic variability of this feature.
Conclusions
Our results show that nearly all 7T paramagnetic rims can also be seen at 3T. This finding suggests the possibility of implementing paramagnetic rims for MS diagnosis and as outcome measures in MR imaging–based clinical trials, potentially affecting perilesional persistent microglial/macrophage-mediated inflammation.
Acknowledgments
We thank the study participants, the Neuroimmunology Clinic for recruiting and evaluating the patients and for coordinating the scans, and the National Institutes of Health Functional Magnetic Resonance Imaging Facility. We thank Souheil Inati, John A Derbyshire, and Sunil Patil for support with MR imaging sequences and Christian Langkammer for help with QSM image processing.
Footnotes
Disclosures: Martina Absinta—UNRELATED: Grant: National Multiple Sclerosis Society and Conrad N. Hilton Foundation.* Daniel S. Reich—UNRELATED: Grants/Grants Pending: Vertex Pharmaceuticals*; Payment for Lectures Including Service on Speakers Bureaus: At the Limits, Comments: Continuing Medical Education lecture; Travel/Accommodations/Meeting Expenses Unrelated to Activities Listed: Verily Life Sciences, Biogen, Comments: support for travel and accommodations to present scientific lectures.* *Money paid to the institution.
This work was supported by the Intramural Research Program of National Institute of Neurological Disorders and Stroke.
Indicates open access to non-subscribers at www.ajnr.org
References
- Received December 8, 2017.
- Accepted after revision March 13, 2018.
- © 2018 by American Journal of Neuroradiology


Jump to section
Related Articles
Cited By...
- Genetic variation in HIF1A is associated with smoldering inflammation and disease progression in Multiple Sclerosis
- QSMRim-Net: Imbalance-Aware Learning for Identification of Chronic Active Multiple Sclerosis Lesions on Quantitative Susceptibility Maps
- Paramagnetic rim lesions are associated with pathogenic CSF profiles and worse clinical outcomes in multiple sclerosis: a retrospective cross-sectional study
- Evaluation of Ultrafast Wave-Controlled Aliasing in Parallel Imaging 3D-FLAIR in the Visualization and Volumetric Estimation of Cerebral White Matter Lesions
- Chronic White Matter Inflammation and Serum Neurofilament Levels in Multiple Sclerosis
- Disease correlates of quantitative susceptibility mapping rim lesions in multiple sclerosis
- Quantitative susceptibility mapping captures chronic multiple sclerosis rim lesions with greater myelin damage: Comparison with high-pass filtered phase MRI
- Evaluation of Ultrafast Wave-CAIPI 3D FLAIR in the Visualization and Volumetric Estimation of Cerebral White Matter Lesions
- Fully Automated Detection of Paramagnetic Rims in Multiple Sclerosis Lesions on 3T Susceptibility-Based MR Imaging
- Value of 3T Susceptibility-Weighted Imaging in the Diagnosis of Multiple Sclerosis