
Abstract
BACKGROUND AND PURPOSE: Amide proton transfer imaging has been successfully applied to brain tumors, however, the relationships between amide proton transfer and other quantitative imaging values have yet to be investigated. The aim was to examine the additive value of amide proton transfer imaging alongside [18F] FDG-PET and DWI for preoperative grading of gliomas.
MATERIALS AND METHODS: Forty-nine patients with newly diagnosed gliomas were included in this retrospective study. All patients had undergone MR imaging, including DWI and amide proton transfer imaging on 3T scanners, and [18F] FDG-PET. Logistic regression analyses were conducted to examine the relationship between each imaging parameter and the presence of high-grade (grade III and/or IV) glioma. These parameters included the tumor-to-normal ratio of FDG uptake, minimum ADC, mean amide proton transfer value, and their combinations. In each model, the overall discriminative power for the detection of high-grade glioma was assessed with receiver operating characteristic curve analysis. Additive information from minimum ADC and mean amide proton transfer was also evaluated by continuous net reclassification improvement. P < .05 was considered significant.
RESULTS: Tumor-to-normal ratio, minimum ADC, and mean amide proton transfer demonstrated comparable diagnostic accuracy in differentiating high-grade from low-grade gliomas. When mean amide proton transfer was combined with the tumor-to-normal ratio, the continuous net reclassification improvement was 0.64 (95% CI, 0.036–1.24; P = .04) for diagnosing high-grade glioma and 0.95 (95% CI, 0.39–1.52; P = .001) for diagnosing glioblastoma. When minimum ADC was combined with the tumor-to-normal ratio, the continuous net reclassification improvement was 0.43 (95% CI, −0.17–1.04; P = .16) for diagnosing high-grade glioma, and 1.36 (95% CI, 0.79–1.92; P < .001) for diagnosing glioblastoma.
CONCLUSIONS: Addition of amide proton transfer imaging to FDG-PET/CT may improve the ability to differentiate high-grade from low-grade gliomas.
ABBREVIATIONS:
- ADCmin
- minimum ADC
- APT
- amide proton transfer
- AUC
- area under the curve
- NRI
- net reclassification improvement
- ROC
- receiver operating characteristic
- S0 image
- reference dataset acquired without presaturation
- SUV
- standard uptake value
- T/N
- tumor-to-normal
MR imaging has an established role for the localization, characterization, and diagnosis of brain tumors, as well as for assessing the effects of treatment. Several studies have demonstrated the utility of various types of advanced sequences for grading brain tumors through the visualization of water diffusion, tumor metabolites, or perfusion characteristics.1,2 For pre- and postoperative assessment of gliomas, DWI has been the most commonly used of these advanced sequences,2 and the derived ADC is a quantitative parameter that is inversely correlated with tumor cellularity and hence glioma grade.3,4 However, its clinical impact has remained limited because of the substantial overlap in regional ADCs among gliomas of different grades.5
PET is another quantitative imaging technique used in neuro-oncology.2 The standard uptake value (SUV) obtained with FDG-PET also plays an important role in the grading of brain tumors.2 High-grade gliomas generally show a higher level of glucose metabolism than low-grade gliomas and therefore exhibit increased SUV. However, physiologic FDG uptake by the brain may obscure tumor uptake. PET also has shortcomings in terms of the cost, exposure to radiation, and relatively low spatial resolution.
In addition to the aforementioned methods, chemical exchange–dependent saturation transfer imaging has recently emerged as a new contrast mechanism for MR imaging in the field of cellular and molecular imaging.6⇓–8 This method of magnetization transfer imaging has several variants, one of which is amide proton transfer (APT) imaging, which focuses on endogenous cytosolic proteins and peptides with amide protons in the peptide bond.9 This technique has been successfully applied to human brain tumors.3,10⇓⇓⇓⇓⇓–16 Some reports have shown that the APT asymmetry value is useful in tumor grading, allowing differentiation of pseudoprogression from recurrence17 and the assessment of treatment response.18,19 However, the relationship between APT and other quantitative imaging values has yet to be investigated.
The purposes of this study were the following: 1) to compare the diagnostic accuracy of APT imaging for preoperative grading of glial tumors with that of DWI and [18F] FDG-PET, and 2) to examine the additive value of APT imaging combined with [18F] FDG-PET and DWI for the preoperative grading of gliomas. To quantify the additive value of APT imaging, we used a statistical method called the net reclassification index (NRI), an index that shows how well a new model reclassifies subjects.20 NRI is calculated as the difference in the proportion of subjects classified correctly as opposed to wrongly classified after application of a new model. This measure can demonstrate the superiority of a new model over a previous one.
Materials and Methods
Our institutional review board approved this retrospective study (R0120), and the requirement to obtain informed consent was waived.
Patients
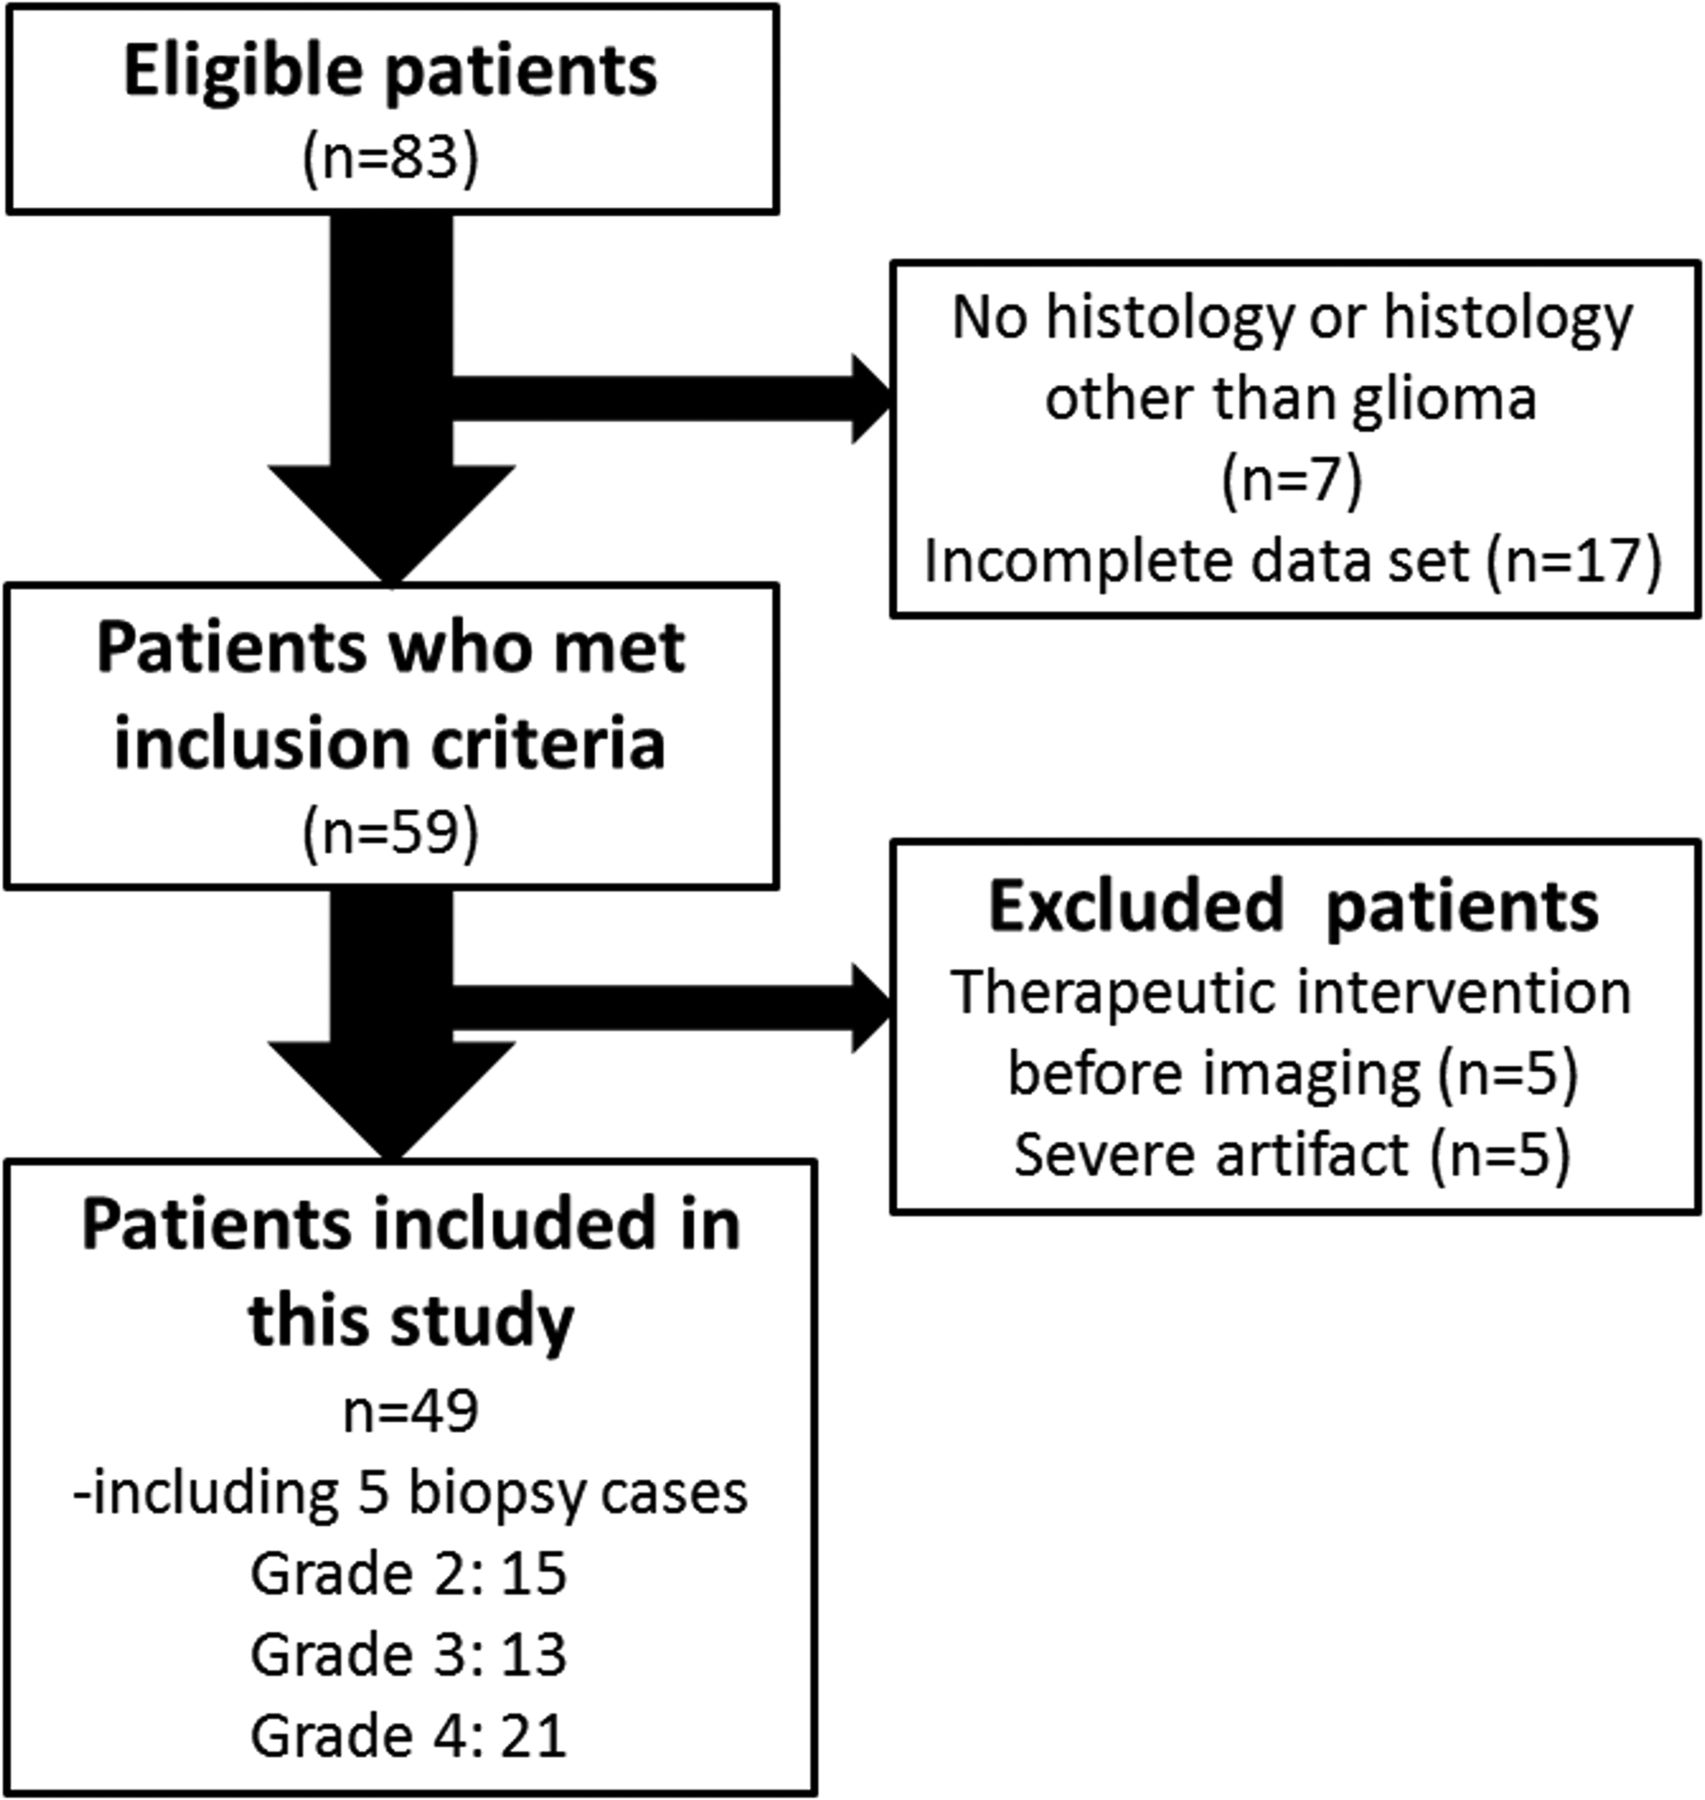
Eighty-three consecutive adult (older than 18 years of age) patients with suspected supratentorial gliomas who were treated at our hospital between December 2012 and April 2015 were reviewed. The inclusion criteria were the following: 1) pathologic diagnosis of grades II–IV diffuse glioma (2007 World Health Organization criteria)21; 2) the availability of results from preoperative MR imaging, including DWI and APT imaging, and FDG-PET obtained within the year before the operation. Twenty-four patients did not meet the inclusion criteria because of no histology or histology other than glioma (n = 7) or incomplete datasets (n = 17). Ten patients were also excluded because of major therapeutic intervention (such as an operation, radiation therapy, or chemotherapy including steroids) before imaging (n = 5) or severe artifacts (n = 5). Finally, we analyzed data from 49 patients who underwent [18F] FDG-PET/CT and MR imaging, including DWI and APT imaging. Subsets from this patient population (n = 26; 13 each) have been used in previous publications,15,22 though not with the research focus presented in the current study (Fig 1).

Flowchart showing the 83 eligible patients who received a histologic diagnosis of primary glioma after MR imaging and PET and subsequently underwent an operation during the 29-month period.
Imaging Acquisition
DWI.
MR imaging was conducted by using two 3T scanners (Magnetom Trio; Siemens, Erlangen, Germany) with 32-channel head coils. In addition to the conventional FLAIR sequence (TR/TE, 12,000/100 ms; TI, 2760 ms; flip angle, 120°; resolution, 0.69 × 0.69 mm), T2-weighted FSE (TR/TE, 3200/79 ms; flip angle, 120°; resolution, 0.49 × 0.49 mm) and pre- and postcontrast-enhanced T1-weighted imaging were acquired (using magnetization-prepared rapid acquisition of gradient echo with the following settings: TR/TE, 6/2.26 ms; flip angle, 15°; resolution, 0.9 × 0.9 × 0.9 mm). Contrast materials used were 0.1 mmol/kg of gadopentetate dimeglumine (Magnevist; Bayer HealthCare Pharmaceuticals, Wayne, New Jersey) or gadoteridol (ProHance; Bracco Diagnostics, Princeton, New Jersey). DWI (TR/TE, 5000/77 ms; resolution, 1.4 × 1.4 mm; slice thickness, 3 mm with a 1-mm gap) was performed with motion-probing gradients of b = 1000 s/mm2 applied in 3 orthogonal directions. Images without motion-probing gradients were also obtained, and ADC maps were calculated.
APT.
APT imaging was conducted using a prototype 3D gradient-echo pulse sequence (TR/TE, 8.3/3.3 ms; flip angle, 12°; 24 slices; resolution, 1.72 × 1.72 × 4 mm). The presaturation pulses consisted of 3 consecutive radiofrequency pulses of 100-ms duration with 100-ms interpulse delays and a time-average amplitude of 2 μT. Eighteen consecutive datasets were acquired with different offset frequencies Δω (0, ± 0.6, ± 1.2, ± 1.8, ± 2.4, ± 3.0, ± 3.6, ± 4.2, and ± 4.8 ppm) from the bulk water resonance. Saturated images (S[Δω]) were normalized with a reference dataset acquired without presaturation (S0 image). The APT effect was calculated as the asymmetry of the magnetization transfer rate using the following equation: APTasym = (S[−3.5 ppm] − S[+3.5 ppm]) / S0 × 100 (%). The APTasym at 3.5 ppm was obtained from linear interpolation between the originally sampled points using an offset resolution of 0.1 ppm and subsequent correction for inhomogeneity of the static magnetic field, as previously described.23
[18F] FDG-PET.
PET was performed with a PET/CT scanner (Discovery ST Elite; GE Healthcare, Milwaukee, Wisconsin). Each patient fasted for at least 4 hours before PET. After intravenous administration of FDG at 4 MBq/kg body weight, the patient rested in a waiting room for 30 minutes. After performing low-dose CT for attenuation correction, we performed emission scans of the brain for 15 minutes with a 128 × 128 matrix and 47 slices (resolution, 2.0 × 2.0 × 3.27 mm). The reconstructed PET data were converted to SUV data using the following equation: SUV = Count at a Pixel (kBq/cm3) / Injection Dose (MBq) / Weight (kg).
Imaging Analysis
All image processing was conducted by 2 neuroradiologists (A.S. and T.O., with 4 and 22 years of experience of imaging processing) in consensus to double-check the quality. Images were coregistered using SPM8 software (http://www.fil.ion.ucl.ac.uk/spm/software/spm12) implemented in Matlab (MathWorks, Natick, Massachusetts). All postcontrast T1-weighted, ADC, S0, and APT images were coregistered to the corresponding FLAIR images and resliced; S0 images were used for coregistration of APT images to anatomic images. Registrations were visually inspected and manually corrected if necessary. FDG-PET images were not coregistered to MR images because the image resolution and contrast were different.
Minimum ADC
Two board-certified neuroradiologists (A.S. and T.D., each with 7 years of experience in diagnostic neuroradiology) analyzed the ADC maps independently using ImageJ, Version 1.48 (National Institutes of Health, Bethesda, Maryland). All continuous sections that included tumor were evaluated by placing 3 circular ROIs over the low-intensity area corresponding to the solid portion of the tumor.24 The area of the ROIs was predefined as 30 mm2, and each ROI was carefully positioned to avoid contamination from adjacent tissues and estimation errors caused by necrosis, hemorrhage, or calcification.
APTmean
For the APT images, board-certified neuroradiologists (A.S. and T.D.) independently placed an ROI over a representative slice of the tumor (1 ROI per patient). In case of tumors with an enhancing portion, ROIs were drawn on the enhanced area (viable tumor core) on the contrast-enhanced T1-weighted images. When such enhancement was absent, ROIs were drawn by selecting abnormal signal areas on the FLAIR images. Foci of necrosis, hemorrhage, or calcification were manually avoided. All ROIs were applied to the resliced APT images, and mean values (APTmean) were calculated.
Tumor-to-Normal Ratio
For SUVmaximum measurement, 2 neuroradiologists with board certification in nuclear medicine (Y.F. and T.O., with 13 and 18 years of experience respectively) independently drew several oval ROIs (diameter = 10 mm) to include the area with the highest SUV. The number of ROIs varied, depending on the size of the tumor (median, 9; range, 1–25). Fifteen ROIs (5 ROIs on each of 3 axial slices) were also placed on the contralateral frontoparietal gray matter. When a tumor occupied the bilateral lobes, the hemisphere with the largest part of the tumor was defined as the side of the tumor. Semiquantitative analysis was performed using the tumor-to-normal (T/N) ratio, defined as the SUVmaximum in the tumor divided by the average SUV of the normal gray matter.25
Pathologic Analysis
Tumors were graded according to the 2007 World Health Organization classification of brain tumors by board-certified neuropathologists with >15 years of experience.21 The grade of glial tumor was determined on the basis of histologic characteristics such as nuclear atypia, mitosis, microvascular proliferation, and the presence of necrosis. Immunohistochemical analyses were used when necessary. Grade III and IV tumors were considered high-grade, and grade II tumors, as low-grade.
Statistical Analysis
To determine the interrater reliability for continuous data (T/N ratio, minimum ADC [ADCmin] and APTmean measurements), the intraclass correlation coefficient was calculated with a 2-way random model with absolute agreement on average measures. Interpretation of the intraclass correlation coefficient followed methods described by Landis and Koch26: <0, no reproducibility; 0.0–0.20, slight reproducibility; 0.21–0.40, fair reproducibility; 0.41–0.60, moderate reproducibility; 0.61–0.80, substantial reproducibility; and 0.81–1.00, almost perfect reproducibility.
To assess the ability to correctly differentiate high-grade gliomas, we conducted receiver operating characteristic (ROC) curve analysis for APTmean, ADCmin, and the T/N ratio. We compared the areas under the curve (AUCs) using the method described by DeLong et al.27
Clinical models were created for logistic regression analysis, combining 2 of the 3 parameters APTmean, ADCmin, and the T/N ratio. The added value of the additional imaging beyond [18F] FDG-PET (which showed the highest AUC for the primary outcome) was quantified by consecutively extending the basic model and assessing the increase in AUC. Furthermore, the number of patients correctly reclassified after adding these parameters was expressed as the NRI. The continuous NRI generalizes a summary measure proposed for reclassification tables by eliminating risk categories and defining any increase in model-based probability resulting from the addition of a new marker as upward reclassification, and any decrease as downward reclassification. The continuous NRI index is equal to twice the difference in the probabilities of upward reclassification for the events minus the nonevents.20 Internal validation for both logistic regression analysis and NRI was performed with 1000 bootstrapped samples. Furthermore, we conducted additional ROC and NRI analyses to evaluate the additive value of APT to ADC.
Statistical analysis was performed using STATA, Version 13 software (StataCorp, College Station, Texas). P < .05 was considered indicative of a significant difference.
Results
Patient Characteristics
Forty-nine patients (32 men, 17 women) with a new histopathologic diagnosis of glioma and adequate image sets were included in this study. The mean age was 58.3 years (range, 21–90 years). Grade II glioma was seen in 15 patients (9 diffuse astrocytomas, 4 oligodendrogliomas, 2 oligoastrocytomas); grade III glioma, in 13 patients (9 anaplastic astrocytomas, 1 anaplastic oligodendroglioma, 3 anaplastic oligoastrocytomas); and glioblastoma, in 21 patients. Five patients underwent surgical biopsy, and 44 patients underwent surgical resection. The characteristics of the patients with low- and high-grade gliomas are given in Table 1. Representative cases are shown in Figs 2 and 3.
Patient characteristics

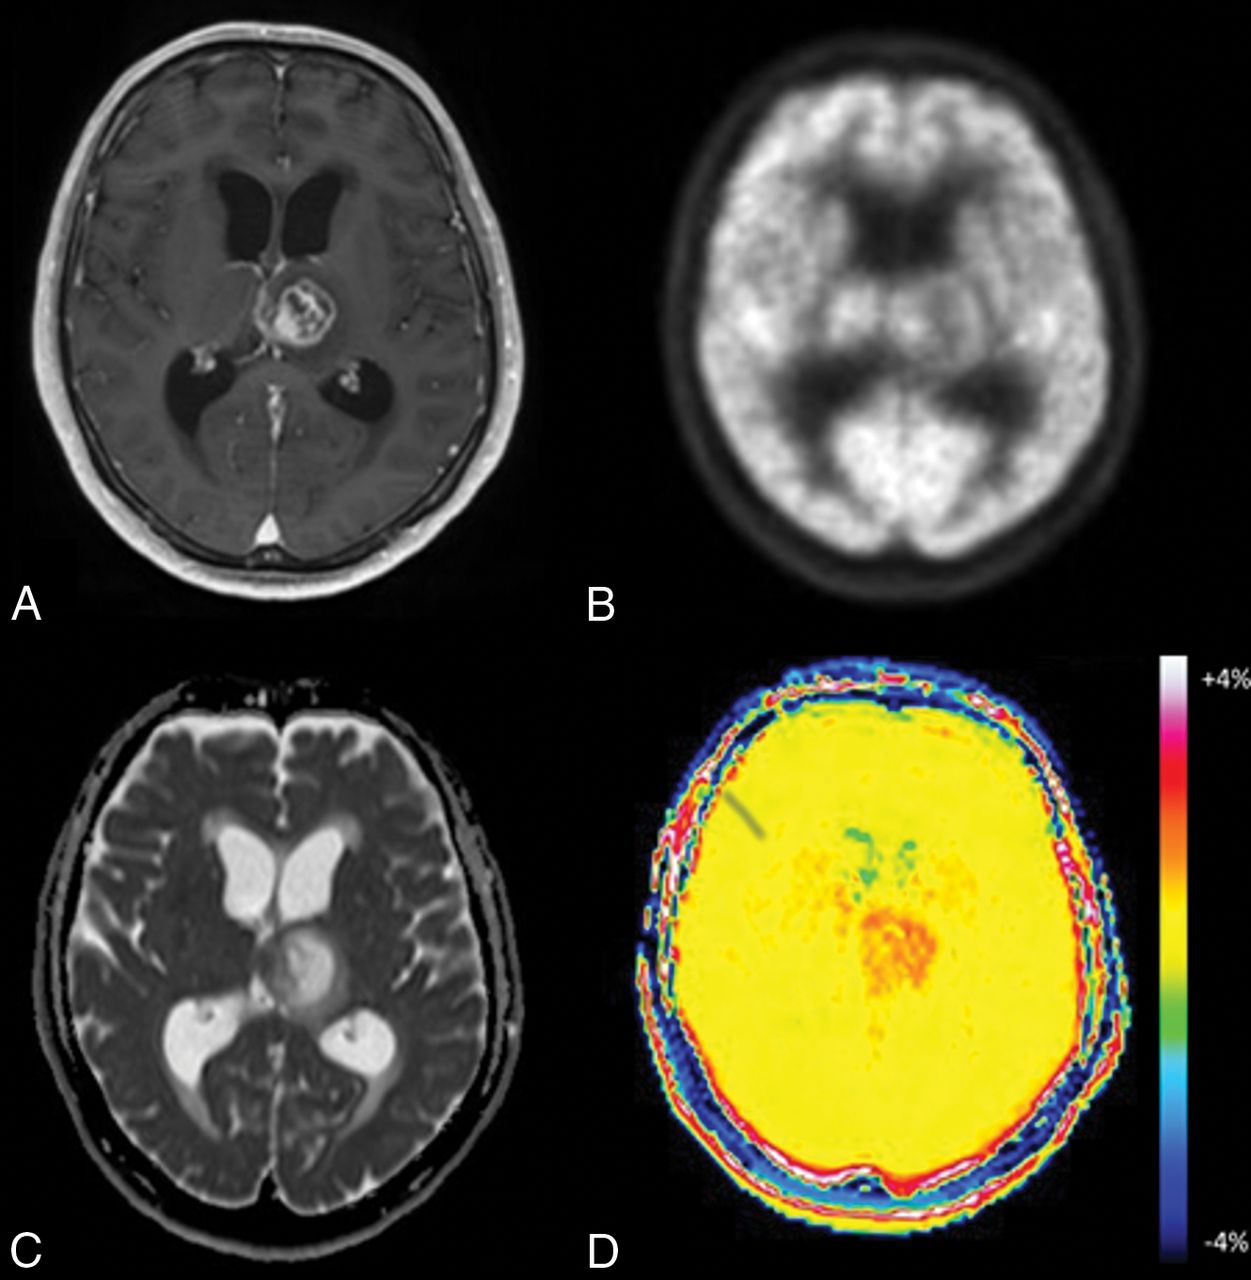
Glioblastoma in a 65-year-old man. A, Axial MR imaging shows a contrast-enhancing lesion in the left thalamus. B, FDG-PET shows less uptake by the lesion compared with gray matter. C, On the ADC map, the medial portion of the tumor demonstrates focal low-to-intermediate ADC values in comparison with normal brain. D, The APT image shows increased signal in both solid and necrotic portions of the tumor.

Oligodendroglioma in a 45-year-old woman. A, Axial MR imaging shows no contrast-enhancing lesion in the right frontal lobe. B, FDG-PET demonstrates little uptake by the lesion compared with gray matter. C, On the ADC map, the tumor shows foci with no diffusion restriction within the tumor. D, The APT image shows no increased signal in this lesion.
Interrater Reliability
Interrater reliability showed almost perfect reproducibility for the T/N ratio, ADCmin, and APT measurements, with intraclass correlation coefficients of 0.89 (95% confidence interval, 0.81–0.94) for T/N ratio, 0.90 (95% CI, 0.82–0.95) for ADCmin, and 0.97 (95% CI, 0.95–0.99) for APT. Given the high interrater reliability, the subsequent statistical evaluation of these measurements used the mean of the values measured by both raters for each patient.
ROC Curve for Each Single Method and Comparison of AUCs
Table 2 and On-line Fig 1 summarize the results of ROC curve analysis for each parameter. No significant differences were seen among T/Nratio, APTmean, and ADCmin in the differentiation of higher grade gliomas from lower grade ones (grades III and IV versus grade II, P = .60; grade IV versus grades II and III, P = .68).
AUCs of each single parameter for predicting glioma grading
Logistic Regression Analysis to Evaluate the Added Value of APT Imaging to [18F] FDG-PET for Differentiation of High- from Low-Grade Gliomas
Table 3 and On-line Fig 2 summarize the results for the AUCs of each combination of the 2 parameters. In comparison with the AUC for the T/N ratio alone, some tendencies toward improvement were seen with either combination of the T/N ratio and APTmean, but the differences did not reach statistical significance.
AUCs of each combination of parameters for predicting glioma grading
Net Reclassification Improvement to Evaluate the Added Value of APT Imaging to [18F] FDG-PET for the Diagnosis of High-Grade Glioma
Table 4 summarizes the NRI results for each combination of the 2 parameters. When APTmean was combined with the T/N ratio, the continuous NRI was 0.64 (95% CI, 0.036–1.24, P = .04) for diagnosis of high-grade glioma and 0.95 (95% CI, 0.39–1.52; P = .001) for the diagnosis of glioblastoma.
Continuous NRI results with the combination of 2 imaging parameters
Validation
Results of the internal validation are summarized in Tables 5 and 6.
Validated logistic regression analysis results with the combination of 2 imaging parameters
Validated continuous NRI results with the combination of 2 imaging parameters
Additive Value of APT Imaging to DWI for Glioma Grading
Table 7 summarizes the results of the AUCs for a combination of ADCmin and APTmean. In comparison with the AUC for ADCmin alone, some improvement was observed, though the difference did not reach statistical significance (grades III and IV versus grade II, P = .36; grade IV versus grades II and III, P = .42). The continuous NRI was 0.48 (95% CI, −0.13–1.09, P = .12) for the diagnosis of high-grade glioma and 1.14 (95% CI, 0.58–1.71; P < .001) for diagnosis of glioblastoma when the APTmean was combined with the ADCmin.
AUCs of ADCmin and APTmean for predicting glioma grading using ROC curve analysis
Discussion
This study has 2 major findings. First, we demonstrated that APTmean offered good diagnostic accuracy for high-grade glioma, comparable with that of other single imaging biomarkers such as ADCmin or the T/N ratio from [18F] FDG-PET. Second, our results also indicated that multiparametric analysis including APT and FDG-PET can improve the classification of gliomas of differing aggressiveness.
By focusing on amide protons, APT imaging has been used to visualize endogenous mobile proteins and peptides, and tissue pH, without requiring administration of a contrast agent.9,28,29 The method involves a chemical exchange saturation transfer mechanism, with the signal changes observed being the result of a reduction in the bulk water signal intensity caused by chemical exchanges with magnetically labeled backbone amide protons on a resonance of around +3.5 ppm of that of free water.
Prior studies on APT imaging have been successfully applied to the assessment of human brain tumors.3,11⇓⇓⇓⇓⇓⇓–18 However, details of the relationships between APT imaging and other clinical imaging parameters of malignancy have yet to be fully elucidated. This study confirmed that APT imaging can be used for grading glial tumors, with a diagnostic accuracy comparable with that of other imaging biomarkers derived from DWI and FDG-PET. Previous studies have shown the diagnostic accuracy of APT imaging to be comparable with DSC-PWI,13,16 and better than contrast-enhanced T1-weighted imaging.22 As in previous studies, our results also demonstrated excellent interrater reproducibility in the measurement of APT.3,11⇓⇓⇓⇓–16 We believe that for the preoperative grading of brain tumors, APT can be considered an alternative approach to PET and other MR imaging methods such as DWI.
Multiparametric analysis including APT has the potential to improve the diagnostic accuracy in glioma grading. Several researchers have argued that multiparametric MR imaging methods have the potential to improve the diagnostic performance of preoperative glioma grading.30⇓–32 Furthermore, Yoon et al1 reported that adding FDG-PET to multiparametric MR imaging, including DWI, PWI, and MR spectroscopy, can improve the diagnostic accuracy of glioma grading. However, few studies have examined glioma grading with multiparametric imaging that included APT imaging and PWI or DWI.10,16 To the best of our knowledge, our investigation represents the first study to show the utility of multiparametric analysis, including APT and PET, in the preoperative grading of gliomas.
To assess discrimination in the multiparametric logistic regression analysis, we applied 2 different statistical methods: ROC curve analysis and NRI. In ROC analysis, the AUC is commonly used to measure the discriminatory ability of a model to correctly classify subjects with or without a disease and has thus been a standard metric used to quantify improvement. However, this metric is known to have various limitations, including a lack of clinical relevance and difficulty in interpreting small-magnitude changes.16 We did not observe any significant gains to the AUCs with the addition of eitherAPTmean or ADCmin to the T/N ratio. This was partly due to the relatively high diagnostic accuracy of each single method. As an alternative, NRI allows quantification of the degree of correct reclassification.33,34 This measure is calculated as a change in the proportion of correct classifications minus incorrect ones, resulting from the new model in comparison with the former one.20 Using this approach, we demonstrated that the addition of APTmean to the first model with a T/N ratio achieved significant improvements, while the addition of ADCmin offered no significant improvement in the discrimination of high-grade gliomas. On the basis of our observations and prior reports that have shown moderate correlations between APTasym values and histologic or other imaging biomarkers, we believe that APT shows potential as another useful and adjunctive biomarker of tumor aggressiveness in neuro-oncology.
We conducted further analysis to evaluate the additive value of APT imaging to DWI, and our results showed that a combination of APT and ADC did not significantly improve the primary outcome (ie, the diagnostic accuracy of high-grade glioma). This is different from a previous study that demonstrated a significant improvement.16 Differences in the acquisition parameters may explain the different findings of the 2 studies, but our results may indicate the importance of multitechnique imaging–based diagnosis.
Several limitations must be considered when interpreting the present results. This study was retrospective in design and included a relatively small cohort. We included approximately 20 patients with low-grade gliomas, which prevented us from conducting robust multivariate regression analyses with >2 variables. Second, we excluded patients with grade I glioma for 2 reasons: one being that adult cases with grade I glioma are relatively rare, with most patients with grade I glioma being diagnosed as having pilocytic astrocytoma in our hospital, in addition to being mostly younger than18 years of age; and the second reason being that grade I glioma is known to be different from diffuse glioma in its pathologic, genetic, and even imaging characteristics.35,36 Third, the intervals between imaging and an operation were longer for low-grade gliomas than for high-grade gliomas. This difference was because elective operations were conducted for patients with suspected low-grade gliomas, with FDG-PET being performed in the initial assessment of the tumor in our institution. FDG-PET was usually not repeated before the operation, due to the high cost and radiation exposure. We found no size increases on conventional MR imaging during this interval, so we do not consider this delay as likely to have affected the results, especially considering the relatively low proliferative activity of low-grade glioma.
Fourth, we analyzed only a single representative slice from the APT imaging. However, a previous study has shown that the difference of measurements on APT imaging has little effect on glioma grading.15 Fifth, we conducted this study using 2 scanners of the same type, with the same sequences and parameters. To our knowledge, there is no study assessing interscanner or intervendor differences in APT imaging. There may well be some interscanner differences, even between scanners of the same type; however, our results showed that APT imaging has additive value, even when different scanners of the same type are used. Finally, we did not examine the relationship between the imaging parameters and the molecular profiles of tumors. Several recent studies have clarified the importance of the molecular status of the tumor, including the mutation of genes such as IDH-1, ATRX, and TERT.37,38 We should conduct further studies to investigate the potential associations between imaging parameters and such molecular or genetic profiles of gliomas.
Conclusions
Our findings indicate that APT, DWI, and FDG-PET are useful for predicting the malignant grade of cerebral glioma. In combination with FDG-PET, APT showed the potential to improve the diagnostic performance in the identification of high-grade glioma. To investigate the accuracy of our results, external validation using larger samples should be conducted in future clinical studies.
Acknowledgments
We thank Karl Embleton, PhD, from Edanz Group (www.edanzediting.com/ac) for editing a draft of this article.
Footnotes
Disclosures: Tomohisa Okada—UNRELATED: Payment for Lectures Including Service on Speakers Bureaus: Siemens Healthcare Japan, Comments: honorarium for a talk; OTHER RELATIONSHIPS: I have a research collaboration with Siemens Healthcare, Japan. Benjamin Schmitt—UNRELATED: Employment: Siemens Healthcare, Comments: full-time employee. Kaori Togashi—RELATED: Grant: Ministry of Education, Culture, Sports, Science and Technology, Japan (No. 25120002), Comments: governmental research grant; OTHER RELATIONSHIPS: I am conducting collaborative work with Siemens Healthcare.
This work was supported by a Grant-in-Aid for Scientific Research on Innovative Areas “Initiative for High-Dimensional Data-Driven Science through Deepening of Sparse Modeling” of Ministry of Education, Culture, Sports, Science and Technology, Japan, provided to K.T. (MEXT grant number 25120002).
Indicates open access to non-subscribers at www.ajnr.org
References
- Received May 19, 2017.
- Accepted after revision October 20, 2017.
- © 2018 by American Journal of Neuroradiology


Jump to section
Related Articles
Cited By...
- No citing articles found.