
Abstract
BACKGROUND AND PURPOSE: Temporal lobe epilepsy is the most common type of epilepsy. Early surgical treatment is superior to prolonged medical therapy in refractory temporal lobe epilepsy. Successful surgical operations depend on the correct localization of the epileptogenic zone. This study aimed to evaluate the clinical value of hybrid TOF-PET/MR imaging–based multiparametric imaging in localizing the epileptogenic zone in patients with MR imaging-negative for temporal lobe epilepsy.
MATERIALS AND METHODS: Twenty patients with MR imaging-negative temporal lobe epilepsy who underwent preoperative evaluation and 10 healthy controls were scanned using PET/MR imaging with simultaneous acquisition of PET and arterial spin-labeling. On the basis of the standardized uptake value and cerebral blood flow, receiver operating characteristic analysis and a logistic regression model were used to evaluate the predictive value for the localization. Statistical analyses were performed using statistical parametric mapping. The values of the standardized uptake value and cerebral blood flow, as well as the asymmetries of metabolism and perfusion, were compared between the 2 groups. Histopathologic findings were used as the criterion standard.
RESULTS: Complete concordance was noted in lateralization and localization among the PET, arterial spin-labeling, and histopathologic findings in 12/20 patients based on visual assessment. Concordance with histopathologic findings was also obtained for the remaining 8 patients based on the complementary PET and arterial spin-labeling information. Receiver operating characteristic analysis showed that the sensitivity and specificity of PET, arterial spin-labeling, and combined PET and arterial spin-labeling were 100% and 81.8%, 83.3% and 54.5%, and 100% and 90.9%, respectively. When we compared the metabolic abnormalities in patients with those in healthy controls, hypometabolism was detected in the middle temporal gyrus (P < .001). Metabolism and perfusion asymmetries were also located in the temporal lobe (P < .001).
CONCLUSIONS: PET/MR imaging–based multiparametric imaging involving arterial spin-labeling may increase the clinical value of localizing the epileptogenic zone by providing concordant and complementary information in patients with MR imaging-negative temporal lobe epilepsy.
ABBREVIATIONS:
- AI
- asymmetry index
- ASL
- arterial spin-labeling
- EZ
- epileptogenic zone
- FCD
- focal cortical dysplasia
- HS
- hippocampal sclerosis
- SPM
- statistical parametric mapping
- SUV
- standardized uptake value
- SUVr
- standardized uptake value ratio
- TLE
- temporal lobe epilepsy
Epilepsy is a common chronic neurologic disorder characterized by recurrent spontaneous seizures. It has an incidence of 50 per 100,000 persons per year.1 Temporal lobe epilepsy (TLE) is the most common type of epilepsy. A published randomized trial reported that early surgical treatment is superior to prolonged medical therapy in refractory TLE.2 Successful operations depend on the correct localization of the epileptogenic zone (EZ). MR imaging is a powerful tool in identifying the lesions causing epilepsy, such as hippocampal sclerosis (HS). However, approximately 16% of patients with TLE have a normal MR imaging appearance.3 Histopathologic studies have shown that many focal cortical dysplasias (FCDs) are small or subtle and are difficult to identify visually using MR imaging.4 FCDs are identified as the most common histopathologic abnormality in MR imaging-negative TLE.5 Therefore, additional functional imaging is needed for localization. The increase in neuronal activity triggered by an epileptic seizure is associated with an increase in neuronal metabolism and regional blood flow.6 Therefore, analyses of cerebral perfusion and the metabolic status are widely used in presurgical evaluation to identify the EZ.7,8
[18F] FDG-PET reveals areas of interictal cerebral hypometabolism associated with epileptic activity and epileptogenic lesions and is being used for presurgical evaluation of the EZ.9 PET has been shown beneficial in patients with MR imaging negative epilepsy or nonconcordant electroencephalography and neuroimaging findings.10,11 Moreover, FDG-PET-positive, MR imaging-negative TLE patients had excellent surgical outcomes.12,13 Arterial spin-labeling (ASL) MR imaging is a noncontrast perfusion technique increasingly used to evaluate the brain cerebral blood flow (CBF). It uses the magnetically labeled arterial blood as an endogenous contrast agent. Previous studies have shown increased perfusion during the peri-ictal period, decreased perfusion during the postictal period, and hemispheric hemodynamic asymmetry in patients with epilepsy.14,15 Thus, ASL perfusion MR imaging might help to confirm the location and extent of the EZ in the presurgical work-up of epilepsy.16,17
Previous studies were obtained with separate PET, MR imaging, and coregistered PET/MR imaging. Hybrid PET/MR imaging provides simultaneous acquisition in the same physiologic or pathophysiologic states and may be advantageous in various neurologic disorders.18,19 A few studies with PET/MR imaging that evaluated refractory focal epilepsy have been reported.20⇓–22 Ding et al20 showed specific patterns of metabolic abnormality and asymmetry in patients with epilepsy, which may help to understand the etiopathogenesis. Shin et al21 evaluated the improved accuracy of hybrid PET/MR imaging compared with separate MR imaging and PET/CT in localizing the EZ. Boscolo Galazzo et al22 reported a high level of correlation between PET and ASL and found that the statistical approach could improve the diagnostic value. However, as far as we know, no study has revealed the relationship between metabolism and perfusion with the EZ confirmed by histopathology in hybrid PET/MR imaging. This pilot study aimed to investigate the clinical value of localizing the EZ using hybrid TOF-PET/MR imaging–based multiparametric imaging in patients with MR imaging-negative TLE.
Materials and Methods
Subjects
Twenty patients (13 males and 7 females; 26.5 ± 9.48 years of age) who were diagnosed with medically refractory TLE and who underwent standard anterior temporal lobectomy with en bloc resection between September 2015 and April 2017 at Xuanwu Hospital were retrospectively evaluated. The inclusion criteria were as follows: 1) TLE confirmed by histopathology, 2) no structural abnormalities revealed on MR images, and 3) no seizure for at least 72 hours before PET/MR imaging. The exclusion criteria were as follows: 1) abnormalities observed in MR images, and 2) serious medical or nonepilepsy neurologic disorders. All patients received the same standardized preoperative assessment protocol, including a detailed clinical and medical history, neuropsychologic examination, long-term ictal and interictal scalp electroencephalography surveillance, and anatomic and functional neuroimaging studies, which included a brain MR imaging, PET/CT, and hybrid PET/MR imaging. Patient demographics, clinical characteristics, surgical approach, and histopathologic findings are summarized in Table 1.
Study population demographics
For comparison, 10 healthy controls were recruited (6 men and 4 women, 44.1 ± 8.0 years of age). All healthy controls were right-handed with normal brain MR imaging findings. No familial or personal history of neurologic or psychiatric diseases was noted. The clinical study was approved by the ethics committee of Xuanwu Hospital, and written informed consent was obtained from all participants before the study.
Surgical Approach and Outcome
All patients underwent standard anterior temporal lobectomy, including 11 who had an operation on the left side and 9 who had an operation on the right side. Nine patients were evaluated after a postoperative follow-up period of at least 1 year. The Engel classification was used in the evaluation of surgical outcomes (class I: free of disabling seizures; class II: rare disabling seizures [almost seizure-free]; class III: worthwhile improvement; and class IV: no worthwhile improvement).23 There were 7 patients with Engel class I and 2 with Engel class II results.
Histopathologic Examination and Findings
The laboratory protocols used for specimen preparation were similar in all samples as described previously.24 Tissue sections were fixed overnight in 10% buffered formalin and then orientated and cut perpendicularly to the cortical surface. Following routine paraffin embedding, 4- or 8-μm-thick sections were stained with hematoxylin-eosin and Luxol fast blue. The selected sections were also tested for immunohistochemical reactions. Histopathologic diagnoses were made by an experienced neuropathologist. There were 15 cases of FCD type I and 5 of FCD type III–HS.
PET/MR Imaging Acquisition
Each subject was scanned with an imaging protocol consisting of injecting FDG (mean, 264.0 ± 46.8 MBq), with the scan being initiated 40 minutes after the injection. All studies were performed on an integrated simultaneous Signa PET/MR imaging system (GE Healthcare, Milwaukee, Wisconsin). The PET bed position included a simultaneous 18-second 2-point Dixon scan for MR imaging–based attenuation correction as well as additional diagnostic MR images. The attenuation map for the head frame was created with atlas-based methods, in which a coregistered MR imaging–CT atlas dataset was used to derive a pseudo-CT image from the patient's MR image.
The ordered subsets expectation maximization algorithm was used for PET image reconstruction, and the detailed parameters were the following: 8 iterations, 32 subsets, and full width at half maximum of a Gaussian filter of 3.0 mm. The PET images were reconstructed to a matrix of 192 × 192, and the slice thickness was 2.44 mm. Imaging parameters of the ASL perfusion MR images were as follows: TR = 4852 ms, TE = 10.7 ms, TI = 2025 ms, FOV = 24 × 24 cm2, gap = 0 mm, matrix size = 512 × 8, postlabel delay = 2 seconds. CBF maps were generated on-line from the console using an AW4.6 Workstation (GE Healthcare). We also obtained routine anatomic acquisitions: axial T2-weighted fast spin-echo (TR = 9600 ms, TE = 149 ms, matrix size = 256 × 256, slice thickness = 3.0 mm, gap = 1.0 mm); axial T1-weighted fast spin-echo (TR = 3286 ms, TE = 24 ms, matrix size = 288 × 256, slice thickness = 3.0 mm, gap = 1.0 mm).
Visual Inspection
All PET and CBF maps were evaluated in a blinded manner by at least 2 experienced neuroradiologists independently, without any knowledge of the patients, operations, histopathology, or follow-up results. They were requested to identify the brain lobes with abnormalities of metabolism and perfusion. Any disagreement between the 2 observers was resolved by consulting a third reader to reach a final consensus.
Statistical Parametric Mapping Analysis of PET and ASL Data
All standardized uptake value (SUV) and CBF images were processed and analyzed using statistical parametric mapping (SPM8; http://www.fil.ion.ucl.ac.uk/spm/software/spm12) and Matlab 7.14 (MathWorks, Natick, Massachusetts) with a dedicated in-house code developed for this study. PET images were spatially normalized to the Montreal Neurological Institute template space. The images were then smoothed using an isotropic Gaussian kernel with a full width at half maximum of 8 mm for all directions. PET data in the Montreal Neurological Institute space were transformed into maps representing the standardized uptake value ratio (SUVr), which were normalized by scaling to a common value (50) for all scans. Similarly, each CBF map was registered to a specific template in the Montreal Neurological Institute space with a resolution of 2 × 2 × 2 mm3 using a nonlinear registration and then smoothed using an 8-mm full width at half maximum Gaussian kernel. According to the histopathologic findings, FDG-PET SUV images and ASL MR imaging perfusion CBF maps of the right hemisphere needed to be left-right flipped for further data analysis to ensure a homogeneous group with all patients having the EZ on the same side.
Analysis of the Asymmetry Index of FDG-PET and ASL MR Imaging
An asymmetry index (AI), which was used for detecting left-right asymmetries, was calculated for the FDG-PET SUV and ASL MR imaging CBF based on the following equation: AI = 2 (Left − Right) / (Left + Right).25 The normalization of the SUV and CBF images allowed identification of left-right asymmetries in the cerebral hemispheres; voxelwise AIs for both the SUV and CBF maps of each patient were then calculated. After we calculated the mean (μAI) and SD (SDAI) of the overall AI map, a voxelwise AI z score map (ZAI) was derived as follows: ZAI = (ValueAI − μAI) / SDAI.22 The metabolic and perfusion asymmetries were evaluated by referring to the normal distribution values of the healthy controls.
Statistical Analysis
A κ test was used to determine the degree of concordance between the 2 readers. Correlation analysis between regional SUVr and CBF was used, and the Spearman rank correlation coefficient was obtained. On the basis of the values of the SUVr and CBF, receiver operating characteristic analysis was used to assess the predictive value of each parameter. The highest area under the curve and sensitivity and specificity were obtained. A logistic regression model with stepwise regression was used to select the optimal model for the location of the EZ. Statistical analyses were performed using SPSS 21.0 (IBM, Armonk, New York). A P value < .05 was considered statistically significant.
For statistical parametric mapping (SPM) analysis, the 2-sample t test was used for comparing the difference in SUV, CBF, and AI in the whole brain between patients and healthy controls. Hypometabolism, hypoperfusion, and AI were regarded as statistically significant using an uncorrected P value of < .001 with a minimum cluster size of 50 voxels.
Results
The FDG-PET, ASL perfusion MR imaging, and histopathologic findings are summarized in Table 2. The concordance between the 2 neuroradiologists in the interpretation of the PET and ASL CBF maps was good (κ = 0.86, 0.74).
Summary of findings of PET and ASL in hybrid PET/MR imaging and histopathology
Comparison of Histopathologic Findings with PET and ASL
Hypometabolism was observed by visual assessment of PET images in 19/20 patients. Concordant lateralization with the EZ was confirmed by histopathology in 18/20 patients, and 15/18 patients showed focal hypometabolism concordant with the localization of the EZ. The remaining 3/18 patients had at least 1 hypometabolic area, which showed partial concordance with histopathologic findings.
In ASL perfusion MR imaging, the readers agreed on the presence of hypoperfusion in 14 of 20 patients. In the 14 patients, 11 were in complete agreement with the localization of the EZ. In the other 3 patients, ASL and histopathologic findings had partial concordance with 1 common lobe identified.
The best performance was FDG-PET SUVr with an area under the curve of 0.932, a sensitivity of 100%, and a specificity of 81.8%, followed by ASL perfusion MR imaging CBF with an area under the curve of 0.636, a sensitivity of 83.3%, and a specificity of 54.5% (Fig 1).

Receiver operating characteristic curves for SUVr, CBF, and combined SUVr and CBF to predict EZ. The combined PET and ASL obtain the highest area under the curve (0.970) with high sensitivity (100%) and specificity (90.9%). PET has more diagnostic information with an area under the curve of 0.926, compared with ASL (area under the curve of 0.679). The combined PET and ASL show the best performance in specificity for predicating EZ.
Evaluation of Combined FDG-PET and ASL MR Imaging in the Location of EZ
A complete concordance in lateralization and localization among the PET, ASL, and histopathologic results was found in 12/20 patients. A representative image set is shown in Fig 2. Concordance of histopathologic results with either FDG-PET or ASL MR imaging was also obtained in the remaining 8 patients.

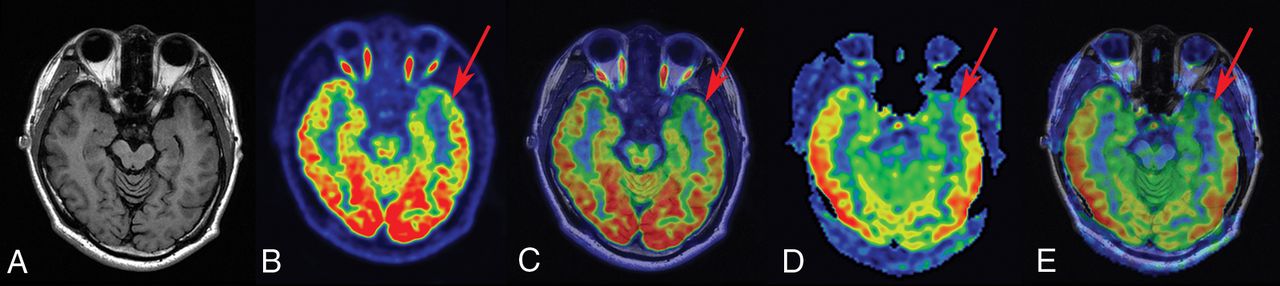
FCD type Ib in a 23-year-old patient with a history of seizures, onset at 14 years of age. A, T1-weighted axial image has normal findings. B and C, PET and PET-T1WI fused images (arrow) indicate a well-defined area of focal hypometabolism in the left temporal lobe region. D and E, ASL and ASL-T1WI fused images (arrow) show hypoperfusion in the same brain region. After a left anterior temporal lobectomy, histopathologic findings showed FCD type Ib. After a postoperative follow-up of at least 1 year, the patient was classified as having an Engel class I outcome.
Six of 8 patients (patients 3, 5, 8, 14, 19, and 20) showed normal perfusion in ASL images; however, concordant hypometabolic areas in PET images were observed. A representative patient with normal finding in ASL image and hypometabolism in PET image is shown in Fig 3. In addition, patient 1 showed a PET image with findings that seemed normal on visual inspection; however, focal hypoperfusion was identified as the EZ by histopathology. Bilateral brain regions (right temporal and left frontal lobe) with hypometabolism were seen in patient 13. However, only the right temporal lobe with hypoperfusion was identified as the EZ (Fig 4).

FCD type IIIa–HS in a 29-year-old patient with a history of seizures, onset at 15 years of age. A, T1-weighted axial image has normal findings. B and C, PET and PET-T1WI fused images (arrows) indicate a well-defined area of focal hypometabolism in the left temporal lobe region. However, ASL and ASL-T1WI fused images (D and E, arrows) have normal findings in the same brain region. After a left anterior temporal lobectomy, histopathologic findings of the surgical specimen were consistent with FCD type IIIa–HS. This patient with TLE had an Engel class I outcome after >1 year of follow-up.

FCD type I in a 26-year-old patient with a history of seizure onset at 14 years of age. The T1-weighted axial image (A), PET image (B), and fused image (C) have normal findings. D and E, ASL and ASL-T1WI fused images (circles) show a well-defined area of focal hypoperfusion in the left temporal lobe region. After a left temporal lobe resection, pathologic findings were consistent with FCD type I. The patient had a follow-up time of >1 year, showing Engel class I outcome.
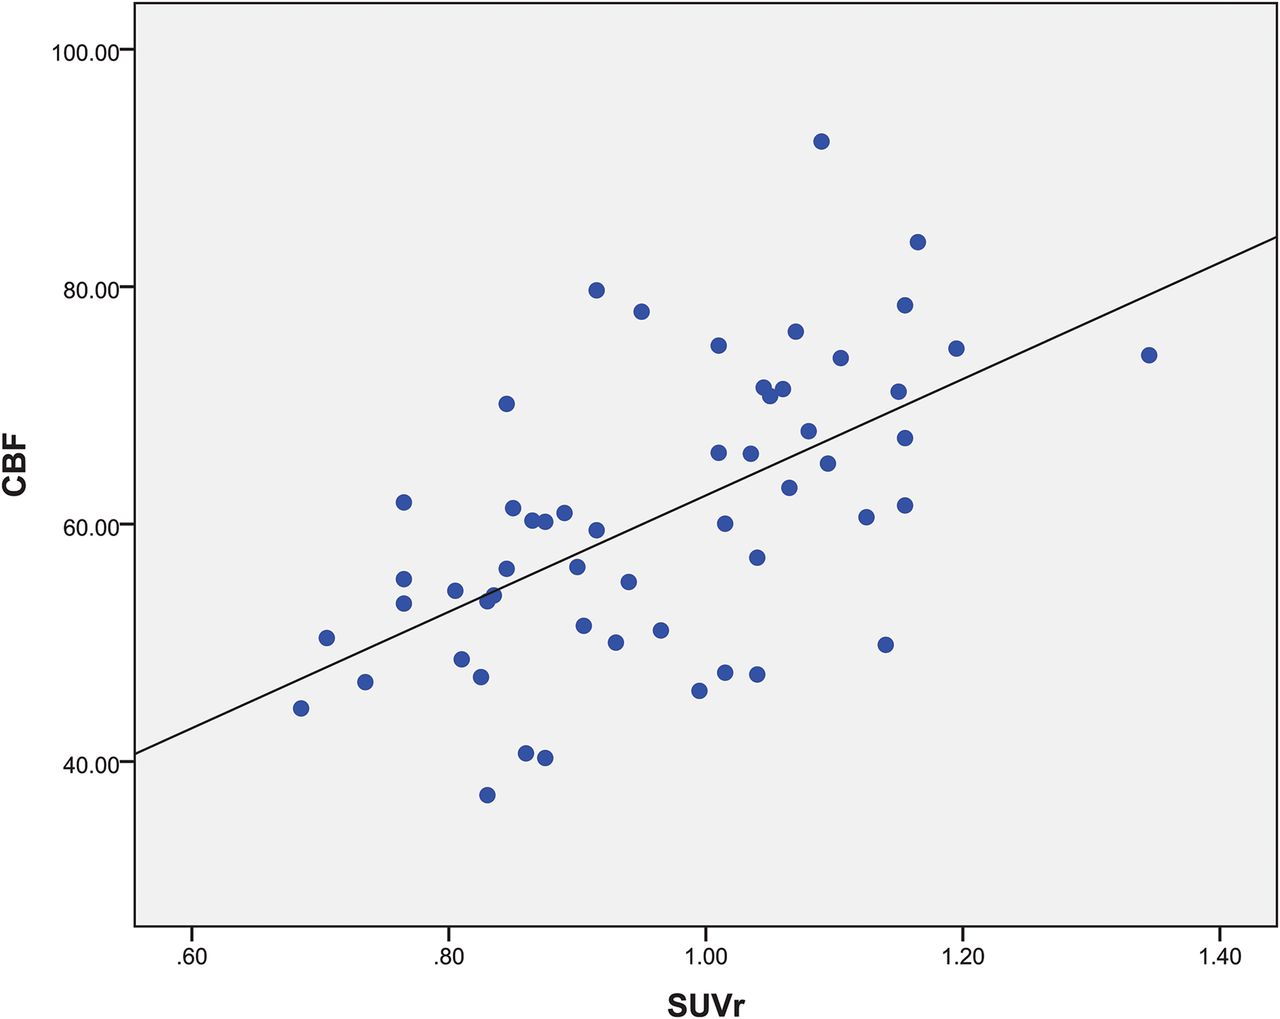
Scatterplots of the mean SUVr and CBF values from FDG-PET and ASL MR imaging in a series of ROIs with hypometabolism and hypoperfusion are presented in Fig 5. The correlation between PET and ASL across 20 patients was good (r = 0.587, P < .001). Significantly improved logistic regression models were identified for combining FDG-PET SUVr and ASL perfusion MR imaging CBF to predicate localization with a sensitivity of 100% and a specificity of 90.9% (Fig 1).

Regional comparison across the 20 patients for ROIs with hypometabolism in PET and hypoperfusion in ASL (r = 0.587, P < .001).
SPM Analyses of the Patient Group
Figure 6 illustrates the results from the statistical SPM analysis between patients and healthy controls in FDG-PET SUV images. The interictal metabolic activities in patients were compared with those in healthy controls using voxelwise normalization methods: Hypometabolism of the middle temporal gyrus was mainly detected, which reached perfect agreement with the histopathologic findings (P < .001). As discussed, metabolic abnormalities were mainly identified in the temporal lobe region by visual inspection, which was concordant with the results of SPM analysis. A more focal area of functional alteration using SPM analysis was detected. Similarly, statistical analysis automatically identified the areas of decreased perfusion in all patients compared with the healthy controls. However, no areas with a statistically significant hypoperfusion were detected in the patient group.

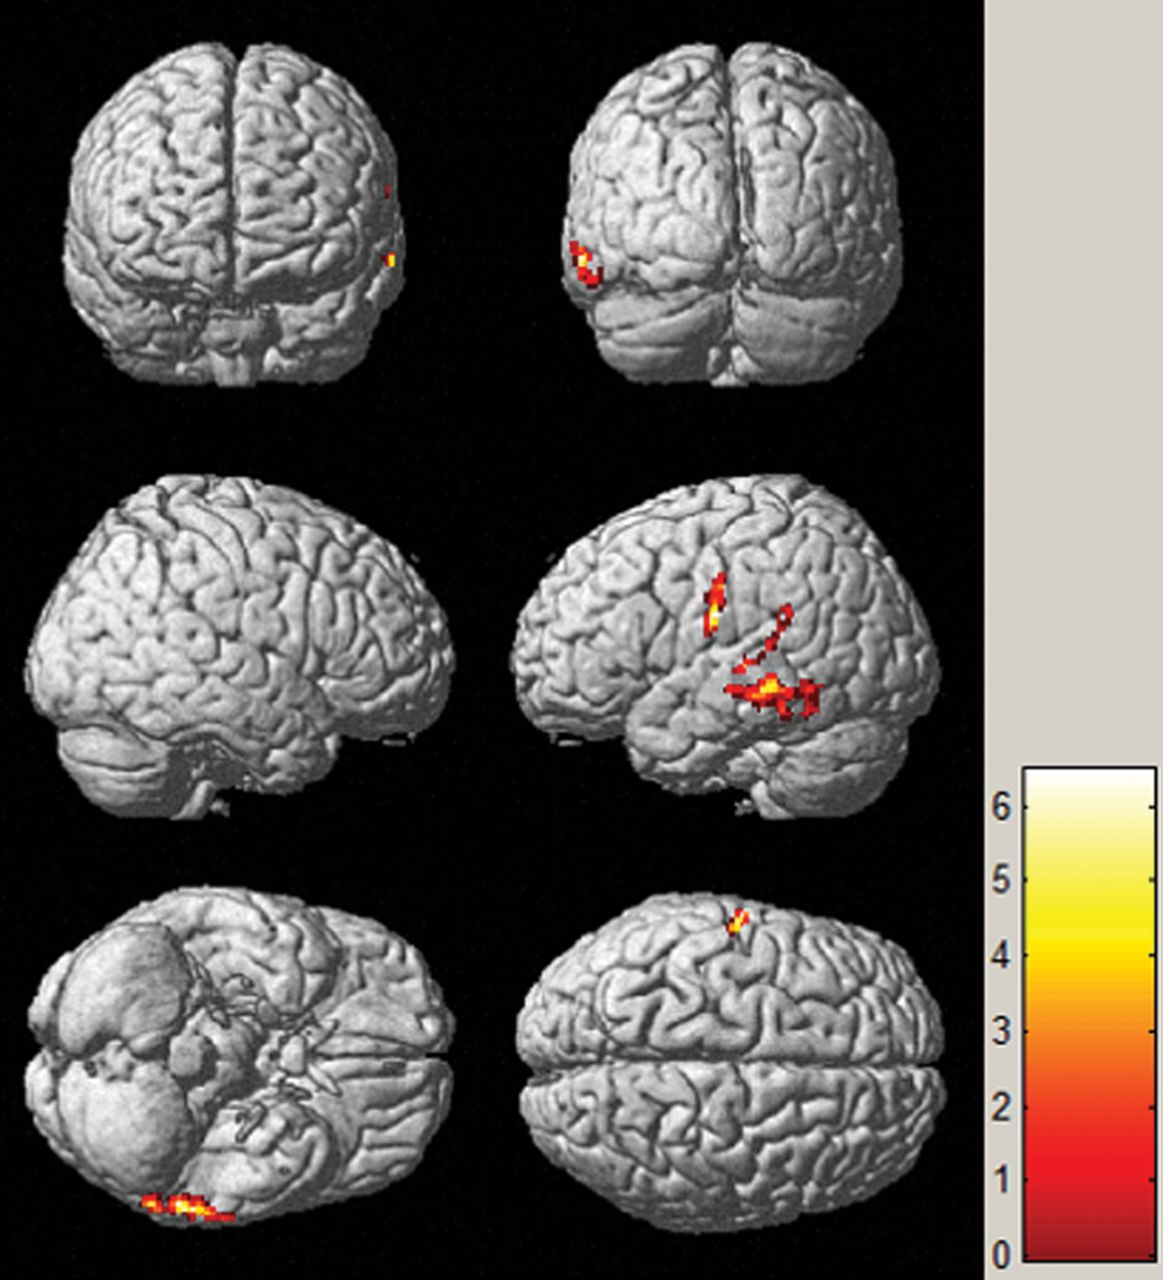
SPM analysis of [18F] FDG-PET images in localizing the EZ between patients and healthy controls. The hypometabolic region is mainly identified in the middle temporal gyrus. The threshold P value is set at .001.
The ZAI map of the assessment of metabolic and perfusion abnormalities is shown in Fig 7. The metabolism asymmetry mainly located in the middle temporal gyrus was found to be statistically significant compared with that in the control group, showing agreement with the histopathologic findings (P < .001). When we compared the patient group with the control group, a statistically significant asymmetry of perfusion was located in the superior temporal gyrus and insula, in line with the histopathologic results (P < .001).

Brain regions of metabolism and perfusion asymmetry of patients compared with controls by SPM analysis in PET (A) and ASL images (B), respectively. The regions of metabolism and perfusion asymmetry are mainly identified in the middle temporal gyrus and superior temporal gyrus, respectively. The threshold P value is set at .001.
Discussion
This study demonstrated the value of hybrid PET/MR imaging in localizing the EZ in patients with MR imaging-negative TLE using the simultaneous acquisition of PET and ASL. The metabolic abnormalities seen in the PET images and abnormal perfusion in ASL images corresponded well with the EZ confirmed by histopathology. Furthermore, PET and ASL could provide concordant and complementary information in localizing the EZ.
The value of localization using FDG-PET based on visual inspection varied from 36% to 73% in extratemporal epilepsy and reached up to 90% exclusively in temporal lobe cases.26,27 The maximum value for clinical management of FDG-PET can be achieved in patients with MR imaging-negative TLE because it can correctly localize lesions in 80% of the patients.28 For FCD, FDG-PET is more sensitive than MR imaging.29 Our study found that the sensitivity and specificity of FDG-PET were 100% and 81.8%, respectively. There were 3 patients who showed a widespread area of hypometabolism extending beyond the EZ and 2 patients who showed incorrect lateralization and localization, in agreement with the findings of previous studies.10,30
Many previous ASL studies have reported interictal hypoperfusion at the site of seizure in patients with TLE and found that interictal ASL might help in localizing the EZ in FCD.31,32 The recommended postlabel delay was used in this study to ensure that the brain parenchyma was sufficiently perfused, which could help to avoid false reduction of relative CBF as estimated with ASL.33 The results of the ASL perfusion MR imaging study showed that the sensitivity and specificity were 83.3% and 54.5%, respectively. The hypoperfusion regions extending beyond the EZ in 3 patients were likely due to confounding factors, such as age, leukoaraiosis, and so forth.34
Previous studies reported that areas of hypoperfusion on the ASL MR imaging were well-associated with the hypometabolic areas on the PET.35,36 Our study with simultaneous acquisition of FDG-PET and ASL MR imaging also showed good overall correlation between them. Combined FDG-PET and ASL MR imaging was studied to find the optimal model for evaluating the value of EZ localization. Receiver operating characteristic analysis and logistic regression models are widely used to evaluate and optimize the performance of clinical diagnostic tests, especially for the predictive value of neurologic diseases.37,38 A combined PET and ASL model was identified with a higher area under the curve compared with PET or ASL only. Moreover, the specificity of combined FDG-PET and ASL MR imaging was improved, which suggested that multiparametric imaging is potentially valuable for EZ localization. In terms of individual patients, there were 6 patients with hypometabolism in PET but normal findings in ASL and 2 cases showing that ASL can also provide complementary values. These findings suggest that the combined use of PET and ASL can yield excellent performance in lateralization and localization.
Multiparametric imaging is now widely practiced in presurgical evaluation to identify the EZ, especially for patients with MR imaging-negative epilepsy.39 However, the nonsynchronized and nonsimultaneous acquisition of different functional parameters might lead to potential biases in the EZ localization. The hybrid PET/MR imaging can provide simultaneous acquisition of PET and ASL in the same physiologic or pathophysiologic states.
Although visual analysis is widely used in clinical practice, it is subjective and relies on the knowledge and experience of physicians. SPM has proved to be an objective and useful method for quantitative analysis in epilepsy with FDG-PET and ASL MR imaging.28,40 Metabolic abnormalities were mainly found in the middle temporal gyrus when comparing patients with healthy controls. However, no statistically significant hypoperfusion was observed in the qualitative assessment of CBF maps, potentially due to the limiting size of the patient cohort. In addition, the AI is also suggested for analysis. Previous studies used voxelwise or region-wise asymmetries to evaluate metabolism and perfusion abnormalities between the 2 hemispheres.41,42 Our results show that the asymmetries of metabolism and perfusion were mainly located in the temporal lobe. These findings suggest that PET and ASL had excellent performance.
There were several limitations to this study. First, the number of the patients and healthy controls was relatively small, and the participants were not age-matched because the participants had to be exposed to radioactive material. Future studies with larger cohorts are needed for further confirmation of the findings. Second, visual assessment combined with SPM analysis should be used with each patient in localizing the EZ. Third, the spectrum of histopathologic changes observed in tissue specimens from the patients with MR imaging negative for epilepsy could be divided into 4 categories as follows: FCD, HS, abnormalities in white matter, and microscopically nonlesional (eg, astrogliosis). The most common histopathologic abnormality identified is FCD. Increased numbers of heterotopic white matter neurons can be encountered in epileptic brain tissue, which are usually not visible at the MR imaging level. Five percent to ten percent of patients with histopathologically confirmed TLE with HS do not present with MR imaging abnormalities. Eight percent of all specimens were microscopically reported nonlesional or negative for epilepsy.43 Because the pathologic findings in MR imaging-negative TLE were all FCDs in our study, multicenter studies involving other pathologic types will be needed to make the results more comprehensive and of statistical significance in the future.
Conclusions
Hybrid PET/MR imaging plays an increasingly important role in the study of refractory focal epilepsy, especially with MR imaging-negative TLE. Complementary information with simultaneous acquisition of metabolism and perfusion was shown to be useful in localizing the EZ for MR imaging-negative TLE.
Acknowledgments
We thank Judy Buchanan, Division of Nuclear Medicine, Johns Hopkins University, and Abby Barre, Laboratory for the Study of the Brain Basis of Individual Differences, Massachusetts General Hospital, for their helpful editing and suggestions.
Footnotes
This work was supported by the National Natural Science Foundation of China (Grant No. 81522021) and the National Key Research and Development Program of China (Grant No. 2016YFC0103000).
Paper previously presented, in part, at: Annual Meeting of the Society of Nuclear Medicine and Molecular Imaging, June 10–14, 2017; Denver, Colorado.
Indicates open access to non-subscribers at www.ajnr.org
References
- Received April 4, 2018.
- Accepted after revision July 18, 2018.
- © 2018 by American Journal of Neuroradiology


