
Abstract
BACKGROUND AND PURPOSE: The heterogeneity of glioblastoma contributes to the poor and variant prognosis. The aim of this retrospective study was to assess the glioblastoma heterogeneity with MR imaging textures and to evaluate its impact on survival time.
MATERIALS AND METHODS: A total of 133 patients with primary glioblastoma who underwent postcontrast T1-weighted imaging (acquired before treatment) and whose data were filed with the survival times were selected from the Cancer Genome Atlas. On the basis of overall survival, the patients were divided into 2 groups: long-term (≥12 months, n = 67) and short-term (<12 months, n = 66) survival. To measure heterogeneity, we extracted 3 types of textures, co-occurrence matrix, run-length matrix, and histogram, reflecting local, regional, and global spatial variations, respectively. Then the support vector machine classification was used to determine how different texture types perform in differentiating the 2 groups, both alone and in combination. Finally, a recursive feature-elimination method was used to find an optimal feature subset with the best differentiation performance.
RESULTS: When used alone, the co-occurrence matrix performed best, while all the features combined obtained the best survival stratification. According to feature selection and ranking, 43 top-ranked features were selected as the optimal subset. Among them, the top 10 features included 7 run-length matrix and 3 co-occurrence matrix features, in which all 6 regional run-length matrix features emphasizing high gray-levels ranked in the top 7.
CONCLUSIONS: The results suggest that local and regional heterogeneity may play an important role in the survival stratification of patients with glioblastoma.
ABBREVIATIONS:
- CM
- co-occurrence matrix
- GBM
- glioblastoma
- RFE-SVM
- recursive feature-elimination–based support vector machine classifier
- RLM
- run-length matrix
- ROC
- receiver operating characteristic
- SVM
- support vector machine
- TCGA
- the Cancer Genome Atlas
Glioblastoma (GBM) is the most common malignant brain tumor.1 Despite maximal safe surgery plus radiation therapy and chemotherapy, the prognosis of patients with GBM remains poor. The median survival of patients with GBM is only 10∼14 months,2 though some patients can survive longer than 36 months.3 Because the heterogeneity of GBM contributes to its poor and variant prognosis,4 it is very important to evaluate the heterogeneity and analyze the relationship between GBM heterogeneity and survival time.
As a common method to explore intratumoral characterization in the clinic, percutaneous biopsy can only provide limited information about a tumor at the biopsy site and does not represent the heterogeneity of the entire tumor.5 With the development of medical imaging, an image-based approach may avoid the risks of biopsy and assess heterogeneity more comprehensively.6,7 Tumor heterogeneity occurs at the molecular level, but heterogeneity can be macroscopically reflected by the texture patterns observed in medical imaging. Texture analysis refers to the various mathematic methods that allow pattern evaluation of gray-level intensities and pixel positions on medical images, which have been proved an effective way to measure tumor heterogeneity, as shown in studies related to breast cancer,8 lung cancer,9 colorectal cancer,10 and so forth. These studies suggest that texture analysis would be effective in evaluating GBM heterogeneity and its correlation with survival time.
As a type of heterogeneous tumor,4,11 GBM varies across geographic regions. Thus, some researchers segmented the heterogeneous GBM into multiple regions, including active tumor, necrosis, and edema and used the texture features of these regions to predict prognosis.12,13 Considering that the region of active tumor better reflects the molecular activities in GBM, Itakura et al14 further used the enhanced region of postcontrast T1-weighted MR imaging to identify different phenotypic subtypes of GBM. On the basis of the relationship between the GBM heterogeneity and the enhanced region of postcontrast T1WI, recently Molina et al15 used the Cox proportional hazards analysis to correlate the texture features of the enhanced region with GBM heterogeneity. Although they verified that the texture analysis could assess the heterogeneity of GBM and predict prognosis,15 the types of texture features that could better characterize the heterogeneity and which heterogeneous characterizations play a key role in prognosis prediction are still unknown.
Materials and Methods
Study Design
In this study, we aimed to investigate the relationship between GBM heterogeneity characterized by MR imaging texture analysis and survival time. The data processing mainly included 3 parts: 1) Preprocessing, based on the contrast-enhanced regions of postcontrast T1WI (the tumor regions were manually contoured); 2) Heterogeneity Measurements, the co-occurrence matrix (CM), run-length matrix (RLM), and histogram-based features, reflecting the local, regional, and global spatial variations of tumor, respectively, extracted to measure the heterogeneity on different scales; and 3) Heterogeneity-Survival Analysis, the support vector machine (SVM) classification used to determine how the 3 texture types perform in differentiating the 2 groups, both alone and in combination. After that, the recursive feature-elimination–based SVM classifier (RFE-SVM) was used to obtain an optimal feature subset with the best differentiation performance.16 On the basis of the optimal feature subset, the model for survival stratification of the patients with GBM can be built. With the model, the stratification of all patients with GBM was estimated, and Kaplan-Meier plots were used to assess the model. The schematic diagram for the data processing is shown in Fig 1.

The schematic diagram for data processing and analysis.
Dataset
A dataset of 133 patients with primary GBM was collected from the Cancer Genome Atlas (TCGA, https://wiki.cancerimagingarchive.net/display/Public/TCGA-GBM). Although the dataset contains >200 GBM cases, only the cases scanned with postcontrast T1WI and filed with a clinical survival time were included. On the basis of the overall survival, the patients were divided into 2 groups: long-term survival (overall survival, ≥12 months, n = 67) and short-term survival (overall survival, <12 months, n = 66). A summary of patient characteristics of long-term and short-term groups is shown in Table 1. All MR images were acquired before treatment, and the patients were subsequently diagnosed as having GBM on the basis of histologic examination. Because all the patient data in TCGA were deidentified, an institutional review board approval was waived.
Summary of patient characteristics of long- and short-term groups
Image Preprocessing
All MR images in this study were acquired in axial sections. The postcontrast T1WI was acquired with a spin- or gradient-echo sequence with the following range of parameters: TE/TR = 2.48∼20/7.62∼880 ms, section thickness = 1∼6 mm, spacing between sections = 0.8∼7.8 mm, and matrix size = 256 × 256 or 512 × 512.
In light of the different imaging parameters, we preprocessed the MR images to standardize the data analysis across patients. On the basis of the contrast-enhanced regions of the postcontrast T1WI, ROIs were manually contoured by 2 neuroradiologists with a custom-developed package in Matlab R2012b (MathWorks, Natick, Massachusetts). The 2 neuroradiologists had 23 and 8 years of MR imaging interpretation experience. During the delineation, they were blinded to all the clinical information and delineated the contours of the tumors from each patient slice by slice, independently. Then, they worked together on the outlined contours of each patient via a consensus reading. Finally, matrices above 256 × 256 were resampled to this resolution, to avoid the effect of resolution on the textural analysis.17
Heterogeneity Measurements
To alleviate the effect of variations in the section thickness and spacing on the feature analysis, we extracted 2D texture features from each tumor ROI. In this study, the image section for the 2D analysis was judged by the maximum tumor area. Then, the 2D texture features were computed to measure the heterogeneity of the tumors.18 According to the different scales, we used the CM, RLM, and histogram-based features to quantify the local,15 regional,17,19 and global heterogeneity in the ROIs of the tumor.20
The CM features proposed by Haralick et al21 describe the arrangements of pixel pairs within 2D images.22 They are defined to measure the relations between 2 neighboring pixels and reflect the local heterogeneity of the tumor region.15 In this study, for each 2D tumor region, 4 CMs were constructed along 4 directions (0°, 45°, 90°, and 135°). For each CM, Haralick et al proposed 13 features, named “Haralick features.” Thus, the 13 Haralick features were successively extracted from 4 directions. The mean and range (the difference between the maximum and minimum values) of the 13 features were calculated to keep the features rotationally invariant.
The RLM features essentially describe the distribution of the gray-level runs, in which the run length is defined to measure the contiguous gray-levels along a specific orientation.19,23 Thus, the RLM features can characterize groups of pixels within the tumor to represent the regional heterogeneity information.17,19 In the tumor region, fine textures tend to have a short run length, while coarser textures would result in a longer run length. In this study, we calculated the mean and range of the 11 RLM features over 4 directions (0°, 45°, 90°, and 135°), to constitute the final RLM features.
The histogram shows the number of pixels in the whole image having the same intensity. The common histogram-based features include the mean, entropy, uniformity, SD, smoothness, skewness, third-order moment, kurtosis, and so forth.24 These features represent the statistical properties of an image and further describe the heterogeneity of the entire tumor.20,25
We used 26 CM features, 22 RLM features, and 8 commonly used histogram-based features, taken together, to measure GBM heterogeneity on different scales (Table 2). In this study, all the features were extracted with a custom-developed package in Matlab R2012b.
Texture features extracted from ROIs of GBM images
Classification Performance with Different Texture Types
To evaluate the performance of different texture types in the differentiation task, we performed an SVM classifier with a radial basis function kernel implemented by the LIBSVM package (https://www.csie.ntu.edu.tw/∼cjlin/libsvm/).26 After all the features were normalized to [−1, 1], the grid search method was used to search for the optimal parameter combination of an SVM classifier.27,28 Then, a 10-fold cross-validation was implemented to extensively evaluate the performance of different feature combinations.29
After classification, the results, namely the sensitivity, specificity, accuracy, and area under the curve of the receiver operating characteristic (ROC), were calculated to evaluate the classification performance.
Feature Selection for the Optimal Feature Subset
Considering that the correlation and redundancy among the features would inevitably affect the classification performance,30⇓–32 the RFE-SVM method was used to first find the optimal feature subset and then verify its overall performance in the prediction. According to feature selection and ranking, the optimal feature subset, containing the first N features with the highest mean accuracy, was finally determined with the SVM and a 10-fold cross-validation. On the basis of the optimal feature subset, we can build a model to predict the survival stratifications of patients with GBM.
Survival Analysis
On the basis of the model built in the above section, the survival stratifications of all 133 patients with GBM were estimated. Then, a Kaplan-Meier plot and a log-rank analysis were used to assess the model, performed by SPSS software, Version 22.0.00 (IBM, Armonk, New York).
Results
Classification Performance with the Different Texture Types
The performances of the different combinations of the 3 texture types (CM, RLM, and histogram) in the differentiation of patients with GBM with long- and short-term survival times were compared (Table 3). When used alone, the CM was the best texture type for classification performance. When combined in pairs, the combination of CM and RLM obtained the best classification performance. When all the features were used, the specificity, accuracy, and area under the curve reached the highest value.
The performance of feature combinations with the SVM classifier in differentiating long- and short-term survival time
The ROC curves of the feature combinations with the SVM classifier were plotted, as shown in Fig 2. Consistent with results shown in Table 3, any combination including CM or CM alone demonstrated a better classification performance. Furthermore, the combination of the 3 texture types showed the best performance.

ROC curves of the different feature combinations with the SVM classifier (CM, RLM, and Hist stand for the co-occurrence matrix, run-length matrix, and histogram-based texture types, respectively).
Optimal Feature Subset Selection with RFE-SVM
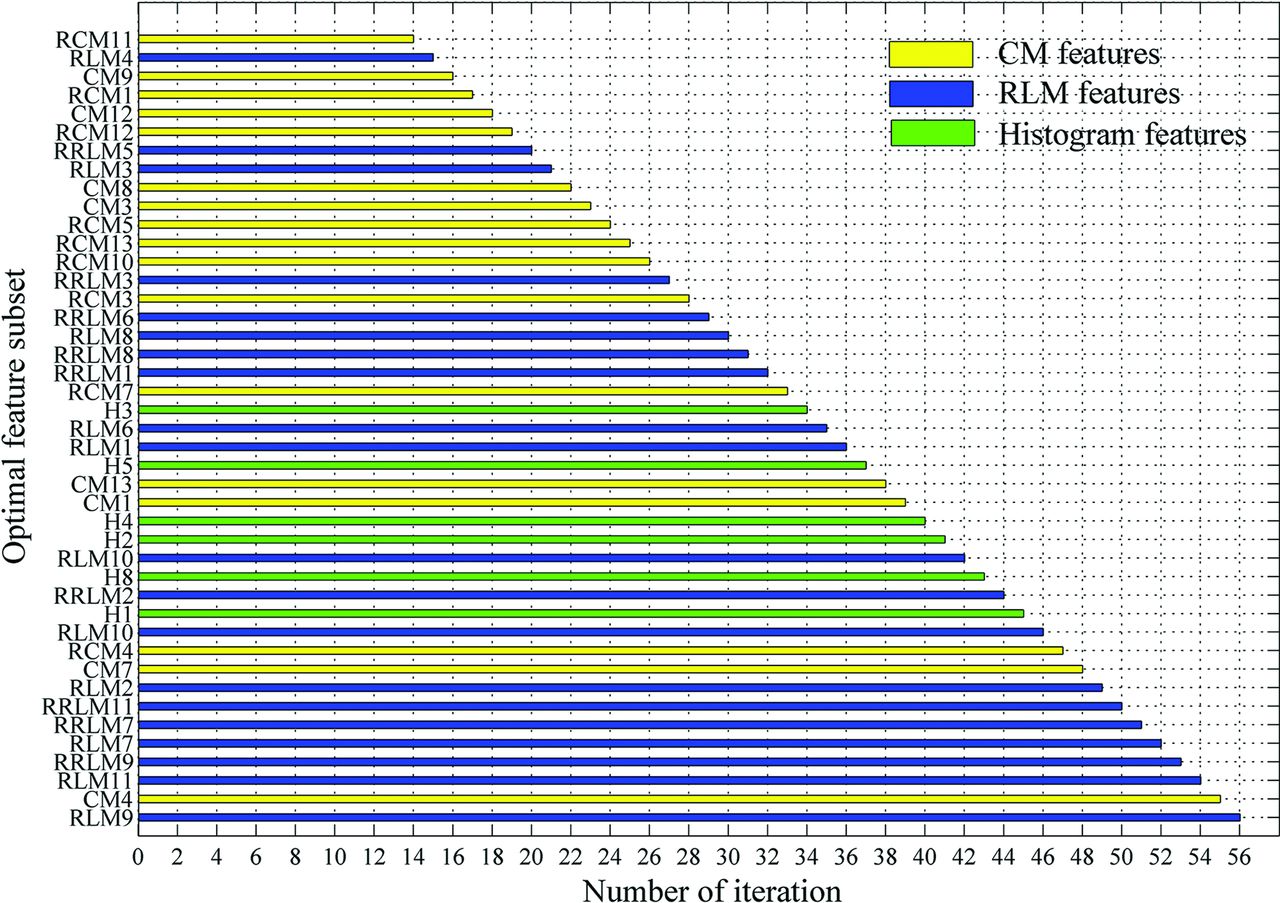
Applying the RFE-SVM method on all 56 features, the selection process for the optimal feature subset and the corresponding ROC curve are shown in Fig 3. Finally, the feature subset consisting of 43 top-ranked features was selected as the optimal subset, which obtained the optimal classification performance (sensitivity = 0.7910, specificity = 0.7727, accuracy = 0.7820, area under the curve = 0.8104). The relative ranking orders of all features in the optimal subset are shown in Fig 4. The length of each bar represents the iteration number at which the feature was rejected by RFE. The longer the bar is, the higher the feature ranks. Furthermore, the top 3 features, short-run high gray-level emphasis (RLM9), variance (CM4), and long-run high gray-level emphasis (RLM11), can obtain a relatively stable accuracy (0.7519).

Optimal feature subset selection. A, Selection process of the optimal feature subset with RFE-SVM. B, ROC curve of the optimal feature subset selected.

Ranking orders of all features in the optimal subset. The length of each bar represents the iteration number at which the feature was rejected by the RFE.
Survival Analysis
On the basis of the model built by the optimal feature subset, the survival stratifications (long- and short-term survival groups) of 133 patients with GBM were estimated. The Kaplan-Meier plot of the 2 groups indicated that their survival difference was significant (log-rank test, P < .001), as shown in Fig 5.

Kaplan-Meier survival curves determined by the log-rank test (P < .001).
Discussion
Tumor heterogeneity is one of the major causes of treatment resistance in GBM,33 directly affecting the prognosis.8,34 On the basis of the MR imaging data from the TCGA, the heterogeneity was first characterized by texture features on different scales. On this basis, the present study investigated the impact of heterogeneity on survival time and obtained an optimal feature combination for survival stratification. The results indicate that CM and RLM type features, which reflect the local and regional heterogeneity, play an important role in survival stratification. Furthermore, regional features that emphasize high gray-level distribution ranked higher in the optimal feature subset and contributed more to prognosis.
As a powerful description of the spatial distribution of the pixel intensity within images, the texture features are sensitive to the reflection of tissue types and pathologic properties.35,36 Among the texture features, the first-order features were derived from the gray-level histogram. They mainly take into account the frequency of the appearance of each gray-level within the tumor, rather than the relative spatial position of pixels (eg, histogram-based features used in this study). Second-order texture features describe the gray-level relationship of the nearby pixel pairs, thereby reflecting the spatial distribution of pixels in a local way. The CM used in this study is a typical second-order texture description method. The high-order features measure the regional distributions (ie, groups of pixels with the same gray-level values). The RLM is a high-order texture method designed to characterize the regions with the same gray-level in the tumor. Therefore, the CM, RLM, and histogram features used in this study can characterize the local,15 regional,17,19 and global heterogeneity20,25 of GBM on different scales. Only the features reflecting GBM heterogeneity were included in the present study because the present study aimed to investigate the impact of the different heterogeneous characterizations on the prognosis, though it may result in a lower accuracy in differentiating the long- and short-term groups.
Although texture features are capable of characterizing the gray-level heterogeneity of GBM, different types of textures may make different contributions to the survival stratification. The results (as shown in Table 3 and Fig 2) indicated that local heterogeneity, identified by the CM features, played a key role in the survival stratification, while global heterogeneity (histogram features) had little effect. Although the classification performance using the RLM alone was not good, its performance improved greatly when it was combined with the CM features. Taken together, the local and regional heterogeneity may have more impact on the prognosis. Meanwhile, the combination of multiple types of features might complement each other, thus improving the classification performance.
Except for the evaluation of the different texture types on the prognosis, the ranking orders and optimal subset of all features were calculated on the basis of the maximum accuracy from the SVM. The top 10 features include 7 RLM features and 3 CM features, supporting the conclusion of the texture type analysis in the last paragraph. Although the CM features demonstrate a high performance compared with other texture types, the RLM features performed better in the optimal subset. This is probably derived from the RLM properties, which reflect relatively moderate (regional) heterogeneity information. In particular, all 6 RLM features emphasized high gray-levels (RLM7, RLM9, RLM11, and their ranges) ranked in the top 7 of the optimal subset, indicating that the tumor regions with high gray-levels or intensity in postcontrast T1WI might contribute more to the prognosis of patients with GBM. This may also indicate that the further segmentation of the active tumor into multiple subregions spatially and the prognosis prediction within these subregions may improve the predictive performance.
Some limitations still need further investigation. First, as a retrospective study, the MR imaging data were acquired on a variety of imaging platforms with different protocols, imaging parameters, and gadolinium-based contrast agents. Second, we divided all the patients into short- and long-term survival with the criterion of 12 months. If more patients with GBM are recruited, a more detailed classification (eg, 6-, 12-, and 24 months) would be further performed. Third, the demographic and treatment information of the patients with GBM might also influence the survival. The adjustment for the demographic and treatment factors should be considered in future studies. Fourth, considering the large section thickness and spacing in most data, we used the 2D texture analysis instead of the 3D analysis, which may result in certain information missing. Finally, only a portion of the subjects in TCGA had multimodality data. Because it was a primary study, our aim was to examine the relationship between GBM heterogeneity characterized by texture features in postcontrast T1WI and survival time. Further study may benefit from the combined use of more anatomic and functional images.
Conclusions
We used the postcontrast T1WI of patients with GBM from the TCGA to investigate the impact of different heterogeneous characterizations on survival stratification, characterized by texture features on different scales. The results of our study indicated that local and regional heterogeneity may play an important role in the survival stratification.
Footnotes
Yang Liu and Xiaopan Xu contributed equally to this work.
Disclosures: Yang Liu—RELATED: Grant: Military Science Foundation of China, Comments: grant No. BWS14J038.* Xiaopan Xu—RELATED: Grant: National Natural Science Foundation of China, Comments: grant No. 81230035.* Lulu Yin—RELATED: Grant: National Natural Science Foundation of China, Comments: grant No. 81402049.* Xi Zhang—RELATED: Grant: National Natural Science Foundation of China, Comments: grant No. 81230035.* Hongbing Lu—RELATED: Grant: National Natural Science Foundation of China, Comments: grant No. 81230035.* *Money paid to the institution.
This work was supported by the National Natural Science Foundation of China (grant Nos. 81230035 and 81402049) and the Military Science Foundation of China (grant No. BWS14J038).
Indicates open access to non-subscribers at www.ajnr.org
References
- Received January 26, 2017.
- Accepted after revision April 25, 2017.
- © 2017 by American Journal of Neuroradiology


