
Abstract
BACKGROUND AND PURPOSE: Intracerebral hemorrhage accounts for 6.5%–19.6% of all acute strokes. Initial intracerebral hemorrhage volume and expansion are both independent predictors of clinical outcomes and mortality. Therefore, a rapid, unbiased, and precise measurement of intracerebral hemorrhage volume is a key component of clinical management. The most commonly used method, ABC/2, results in overestimation. We developed an interactive segmentation program, SegTool, using a novel graphic processing unit, level set algorithm. Until now, the speed, bias, and precision of SegTool had not been validated.
MATERIALS AND METHODS: In a single stroke academic center, 2 vascular neurologists and 2 neuroradiologists independently performed a test-retest experiment that involved repeat measurements of static, unchanging intracerebral hemorrhage volumes on CT from 76 intracerebral hemorrhage cases. Measurements were made with SegTool and ABC/2. True intracerebral hemorrhage volumes were estimated from a consensus of repeat manual tracings by 2 operators. These data allowed us to estimate measurement bias, precision, and speed.
RESULTS: The measurements with SegTool were not significantly different from the true intracerebral hemorrhage volumes, while ABC/2 overestimated volume by 45%. The interrater measurement variability with SegTool was 50% less than that with ABC/2. The average measurement times for ABC/2 and SegTool were 35.7 and 44.6 seconds, respectively.
CONCLUSIONS: SegTool appears to have attributes superior to ABC/2 in terms of accuracy and interrater reliability with a 9-second delay in measurement time (on average); hence, it could be useful in clinical trials and practice.
ABBREVIATIONS:
- ICH
- intracerebral hemorrhage
- LS
- level set
- MDC
- 95% minimum detectable change
Mortality from intracerebral hemorrhage (ICH) is between 31% and 34% at 7 days and 53% and 59% at 1 year.1 Initial ICH volume and rate of growth are independent predictors of clinical outcome and mortality.2 Attenuation of growth is an important treatment strategy.2 Consequently, a rapid, unbiased, and precise measurement of ICH volume is an important component of clinical management.
CT is sensitive for identifying ICH and is commonly used for clinical management.3 The most common method to measure ICH volume is the simplified ellipsoid formula (ABC/2),4 “where A is the greatest hemorrhage diameter by CT, B is the diameter 90° to A, and C is the approximate number of CT sections with hemorrhage multiplied by the section thickness.”5 Use of this formula often results in large volume-estimation errors, particularly for large or irregularly shaped objects.4,6
There is particular interest in semiautomatic computer models that can offer fast, low-bias, and precise lesion volume measurements.7 Among computer-based models, level set (LS) algorithms8 have become widely used to determine lesion, organ, and bone volumes in recent years.9⇓–11 LS algorithms grow a “seed” placed within the ROI. Several parameters, including the rate of growth and curvature of the segmented surface, are controlled by local image properties and can also be adjusted by the reader.12 LS algorithms are robust and flexible and prevent growth of the seed across weak, incidental connections into areas outside the lesion.13
For example, Cates et al14 demonstrated, in a study of 9 meningioma or low-grade glioma MR images, that LS volume measurements produce results that are similar to those from hand tracings. Colliot et al15 found that measurement bias was low when they used LSs to measure cortical dysplasia lesions on MR imaging in 18 patients. Similarly, Saba et al16 obtained a low bias with LSs to measure carotid artery wall thickness on MR images of 10 patients; the LS volumes were compared with volumes calculated with manual tracings in both studies.
However, LS algorithms require an enormous number of computations and long execution times on central processing units. To address this issue, we previously developed a novel LS algorithm that leverages the massive parallelism of commodity graphic processing units.13 This algorithm is 14 times faster than the fastest previously reported parallel algorithm and hundreds of times faster than serial algorithms on current central processing units. The algorithm had low bias and variability when segmenting tissues in a realistic brain phantom, an anatomically accurate 3D simulation of the human brain.13 Dang et al17 reported that its speed, bias, and precision in measuring meningioma volume were superior to the modified McDonald criteria and manual outlining on 25 contrast-enhanced MR imaging examinations. To our knowledge, the speed, bias, and precision of LS algorithms have not been previously tested with a large sample size of ICH and multiple clinician readers, the objective of this study.
In summary, growth in ICH volume is often used to inform treatment decisions in clinical practice. For example, Dowlatshahi et al18 reported that hematoma expansion of 33% or 12.5 mL was highly predictive of poor outcome. As described above, the ABC/2 method can be used to estimate hematoma volume. However, it has poor accuracy, which limits its clinical utility. Manual outlining by an expert can provide accurate volume measurements. However, the associated time penalty limits its clinical utility. Thus, there is an unmet clinical need for simple, rapid, and accurate measurement of ICH volume. Characterizing, validating, and integrating such a tool into clinical workflows would allow clinicians to provide more precise and personalized care.
Materials and Methods
After institutional review board approval, images for this study were obtained from an existing data base of hemorrhagic stroke cases presenting to Mayo Clinic Hospital in Arizona between January 2007 and January 2013. Seventy-six consecutive cases with CT imaging available showing intraparenchymal hematomas were selected. Exclusion criteria included extracerebral hemorrhage and/or intraventricular hematoma. Six cases were randomly withheld from the experimental dataset and used for training purposes.
Four operators, 2 neuroradiologists and 2 vascular neurologists, collected measurements in this study. ABC/2 measurements were acquired with OsiriX Imaging Software (http://www.osirix-viewer.com). LS measurements were acquired with SegTool, a custom-developed in-house program that runs on Windows 7 (Microsoft, Redmond, Washington) computers equipped with graphic processing units (CUDA; Nvidia, San Jose, California). During the measurements, SegTool ran on a stand-alone computer and was not integrated into the PACS workflow. All the operators had experience with the ABC/2 method but no prior knowledge of SegTool. The 70 evaluation cases were each measured twice by 4 operators using both methods, for a total of 1120 measurements (70 cases × 4 operators × 2 methods × 2 repeats). One of the neurologists and one of the neuroradiologists also manually outlined lesions with OsiriX (70 cases × 2 operators × 2 repeats) to estimate true lesion volumes (described below).
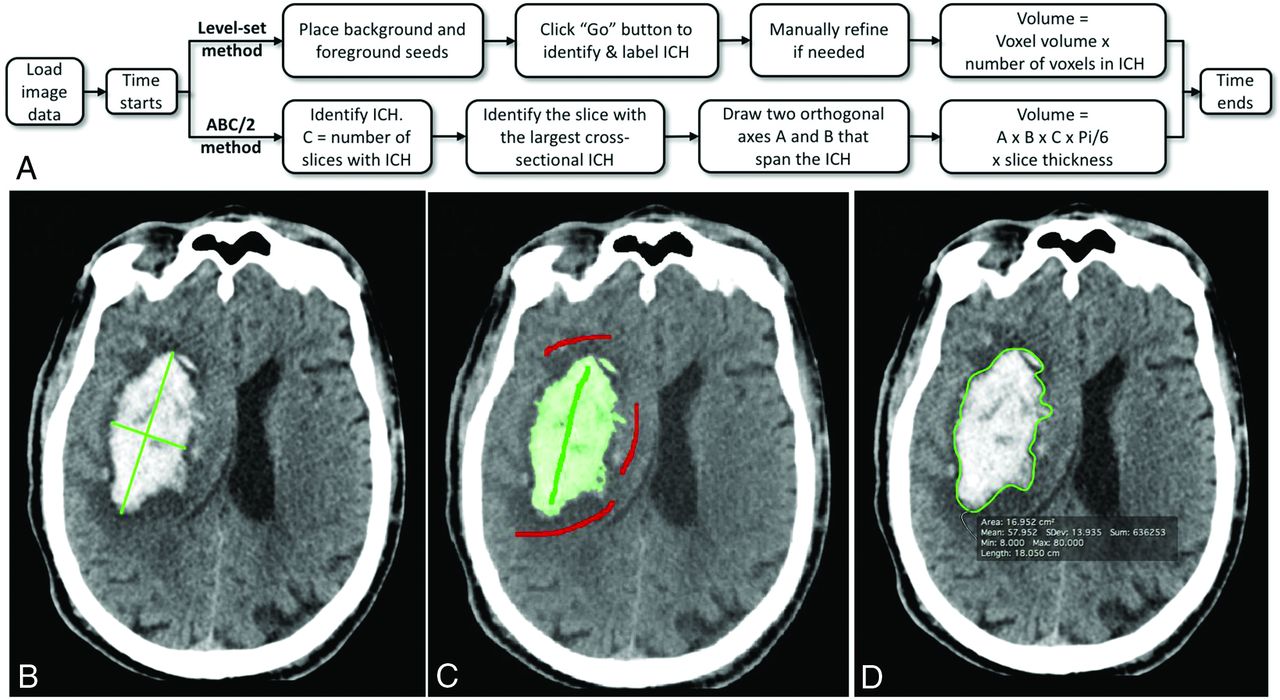
Repeat measurements of all cases in random order occurred after a minimum 2-week delay to limit learning effects. To minimize the bias from the results of SegTool, we conducted the measurements in the following order: Manual tracings were performed first, followed by ABC/2, and finally SegTool. An additional SegTool correction process was introduced after initial data analysis. Figure 1A reviews the workflow for both the ABC/2 and SegTool measurement processes.

Hemorrhage measurement methods. A, A flowchart describes steps in the ABC/2 and level set measurement processes. B, Results from the ABC/2 method. C, Results from the level set method. Green and red strokes were placed by the user. Green indicates desired tissue (foreground), and red indicates undesired tissue (background). The level set region grows in 3D after the user clicks “Go” (Fig 2). D, Manual outlining of the boundary in a single axial section. This process was replicated in each axial section with visible ICH. Each true volume was determined from 4 manual tracings. Two operators each performed 2 repeat manual tracings. A minimum interval of 2 weeks between repeat tracings was required. Any voxel selected in at least 3 of the 4 manual tracings was labeled a “true” lesion voxel and was used to estimate the true lesion volume.
ABC/2 Method
The operator identified the axial sections with the largest lesion extent and then measured the 2 longest orthogonal diameters of the lesion with the OsiriX ROI Length Tool (Fig 1B). The lesion volume was estimated as
 where A and B are the length of the 2 diameters and C is section thickness multiplied by the number of sections where the lesion was visible.
Level Set Method
The operator drew ≥1 green stroke in the ICH and ≥1 red stroke in the surrounding tissue that they did not want to include (surrounding brain parenchyma in our experiments). Strokes were placed on 2D axial sections (Figs 1C and 2A). The operator then clicked a “Play” button to initiate object growth. Growth occurred in real-time and could be visualized in 2 or 3 dimensions interactively (Fig 2B, -D). The algorithm naturally handles the simultaneous growth, merging, and separation of multiple distinctly seeded regions.

The SegTool ICH segmentation process in a CT scan with a 512 × 512 × 36 array. A, The user placed foreground (green) and background (red) seeds in an axial section (Fig 1C). Here the seeds are viewed in 3D. After the user clicks the “Play” button (not shown), the level set evolves to cover the ICH. In this example, a 41-mL ICH is segmented in 3 seconds (B and C). The final segmented region can be viewed in 2D or 3D by rotating the CT scan volume (D).
The surface propagation was guided by a K-nearest neighbor statistical model of the intensity values provided by the seed points and a curvature parameter between 0 and 1 that determined the surface stiffness. In all cases, the curvature parameter was initialized to 0.25. During or following region growth, the operator could adjust a slider to manipulate the curvature parameter. Higher values encouraged smoother, smaller volumes. Lower values encouraged larger, more irregular volumes. The effects of changes in the curvature parameter on the segmented volume occurred and were displayed in real-time.
The user had the ability to then review the segmentation in 2D or 3D by rotating the CT scan volume (Fig 2D). After the user accepted the results, SegTool calculated and recorded the ICH volume, measurement time, and binary mask (segmentation) of the ICH.
A common issue in LS segmentation is “leakage.” Artificial connections between blood and bone (both bright on CT) can be caused by partial volume effects between hemorrhage and skull (due, in part, to the large section thickness of clinical image examinations). These can be corrected by either increasing the LS surface stiffness (causing the leak to retract back into the segmented region) or removing the leaked regions with editing tools.
An informal review of the SegTool volume measurements was performed by several of the authors (S.V., W.X., C.M.Z., J.R.M.) to check for possible leaks. Results from this review were not shared with the operators. The review proceeded, step by step, through all ICHs. At each step, all measurements for a specific ICH were compared. Several of the ICHs had a single volume measurement that was more than double the median volume. Closer inspection of these saved segmented regions revealed that large leaks had occurred (Fig 3).

The level set algorithm may leak. An axial (A) and 3D view (B) of 1 segmented ICH lesion (enclosed in a red ellipse) along with level set leakage outside the lesion. Leakage was caused by partial volume effects between hemorrhage and skull (due, in part, to the large section thickness of the clinical imaging examinations). This can be corrected by either increasing the level set surface stiffness or removing the leaked regions with editing tools. However, when the transparency of the segmented (green) region was high (as it was by default), operators found it difficult to detect leaks. Consequently, we asked all operators to perform a blinded review of their level set segmentations. They performed this by interactively reducing the transparency of the green region until it was opaque and then viewing their segmentation in 3D (B). If, for any reason, they were not satisfied with the labeled region, they were asked to re-segment the lesion. In the text, we describe several enhancements to the tool that could be made to help operators detect leaks before saving the final segmented region.
It was then discovered that the default transparency level of the segmented region was such that operators found it difficult to detect leaks into bone (Fig 3A). Consequently, all operators performed a review of their SegTool 3D measurements with the suggested workflow that reduced the transparency of the green region until it was opaque (Fig 3B). Readers were permitted to correct any segmentation by either editing or starting over. Readers recorded and compared both the initial and “after review” SegTool measurements using ABC/2.
True ICH Volume Estimation
The true ICH volume was estimated from manual tracings. One neurologist and 1 neuroradiologist operator each independently manually traced the lesion on each axial section in which it was apparent with the ROI Pencil Tool of OsiriX (Fig 1D). OsiriX was used to calculate the area in each section, and the lesion volume was calculated as

Each true volume was estimated from 4 manual tracings by the 2 operators. Any voxel selected in at least 3 of the 4 manual tracings was labeled a “true” lesion voxel and was used to estimate the true lesion volume.
Statistical Analysis
We used methodology recommended by the Quantitative Imaging Biomarker Alliance19 to assess the uncertainty in volume measurement. In particular, we used a disaggregate approach to express uncertainty in terms of bias and precision. They defined “bias” as “the difference between the average (expected value) of measurements made on the same object and its true value.” They defined “precision” as “the closeness of agreement between measured quantity values obtained by replicate measurements on the same or similar experimental units under specified conditions.”
Precision is related to the variability in volume measurement. There are several ways it can be described numerically. Here, we chose to express precision as a clinically relevant threshold: the 95% minimum detectable change (MDC).19 Magnitude changes in volume ≤ MDC can be explained by variability in the measurement process alone with 95% confidence. Therefore, magnitude changes in volume > MDC can be ascribed to lesion growth (or shrinkage) with a type II error rate of 5%.
We used a 2-way random-effects analysis of variance as previously described20,21 to estimate between- and within-operator variability for both measurement methods. These values were then used to calculate the between- and within-operator MDC for each method. The measurement bias of each method was determined by comparing the mean measured ICH volume with the estimated true ICH volume. The measurement time of ABC/2 was determined by timing the readers as they measured the volumes. The measurement time of SegTool in seconds was recorded directly by the program.
Results
Summary statistics for our experiments are presented in the Table. ABC/2 produced larger volume estimates than SegTool. SegTool measurements, after review, were smaller, on average, than the initial SegTool measurements. Operators modified 140 (of 560) SegTool measurements during the review process.
Summary statistics for our experimentsa
Figure 4 shows the measurement bias (Fig 4A), precision (Fig 4B), and time (Fig 4C) for the ABC/2 and SegTool (after review) methods. On average, ABC/2 and SegTool produced measurements that were 45% and 3% larger than truth, respectively. (The slope of the line of best fit for ABC/2 and SegTool was 1.45 and 1.03, respectively.) The slope of the line of best fit for SegTool was not statistically different from 1.0, the line of perfect agreement between measured and true volumes (P > .05).

The bias (A), precision (B), and time (C) for ICH volume measurement. Measurements made using the ABC/2 method are shown in red. Those made using SegTool are shown purple (initial) or blue (after review). A, Bias: the dashed (purple) line indicates perfect agreement between measured and true volumes. Each true volume was determined from 4 manual tracings placed by experts (details in the text). The solid markers indicate the mean measured volume determined from 8 measurements (4 operators × 2 measurements/operator). The error bars indicate the 95% confidence interval for the mean measured volume. The solid lines show a linear regression fit through all measurements for each method. The shaded zone around each solid line indicates the 95% confidence interval for the slope of the line. Each line is labeled with its equation, the P value from the linear regression, and the coefficient of determination describing goodness of fit (1.0 equals a perfect fit). B, Precision: lower values are better. Changes in ICH volume less than the indicated value can be explained by measurement variability alone, with 95% confidence. The values in the “Between Operator” group are all statistically significantly different (P < .02). The “SegTool (initial)” value in the “Within Operators” group is significantly different than the other values (P < .001), which are not significantly different from each other (P = .8). C, Time: each bar indicates the mean value from 560 measurements (70 ICH lesions × 4 operators × 2 repeated measurements). The SegTool time is based on the initial measurements. The error bars indicate the standard error of the mean. On average, SegTool required an extra 8.9 seconds to measure ICH volume. This difference is statistically significantly different from 0 (P < .0001).
Between-operator MDC for ABC/2 was 13.94 mL. This was significantly higher (worse) than the SegTool MDC before (11.93 mL, P < .02) and after (9.51 mL, P < .02) the operators reviewed for LS leakage.
Within-operator MDC for ABC/2 was 7.47 mL. This was significantly lower than the MDC for the initial group of SegTool measurements (9.93 mL, P < .001). However, after the operators reviewed and revised their SegTool measurements to eliminate leaks, SegTool MDC improved to 7.37 mL. This value was not statistically significantly different from the ABC/2 MDC (P = .8).
Measurement time is the total time required to complete the steps listed in Fig 1A, after the data were loaded. The average measurement times for ABC/2 and SegTool (initial) were 35.7 and 44.6 seconds, respectively. The average measurement time for repeating the SegTool measurements (after review) was not statistically significantly different from the average initial measurement time (data not shown). SegTool required an extra 8.9 seconds to complete measurements, on average. This difference was significantly different from zero (P < .001).
Discussion
True lesion volumes are required to determine bias. These are often unknown in clinical experiments. A compromise is to estimate the true volume of each lesion with a consensus of expert segmentations in medical images. In our experiments, we assumed that true ICH voxels were those that were selected in at least 3 out of 4 manual outlinings by experts (2 experts × 2 repeated measurements each). Other schemes are also possible.19 Several studies have reported that baseline ICH volume is highly predictive of 30-day morbidity and mortality.22,23 It is also well-acknowledged that ABC/2 tends to overestimate lesion volumes.24,25 In our study, ABC/2 overestimated ICH volume by 45%, on average. While the mean SegTool measurements were not significantly different from the estimated true ICH volumes, the low measurement bias of SegTool could be important for future clinical trials that rely on baseline ICH volume for patient stratification.
There was no significant difference in the within-operator MDC between ABC/2 and SegTool (after review to check for leaks). However, SegTool had between-operator MDC that was approximately 50% lower (better) than ABC/2. This is important because in many clinical scenarios, it is difficult to ensure that a single individual performs all volume measurements.
A recent study by Dowlatshahi et al18 reported that hematoma expansion of 33% or 12.5 mL was highly predictive of poor outcome. The between-operator MDC of ABC/2 in our study was 13.94 mL. Consequently, an expansion of 12.5 mL measured this way can be explained by measurement variability alone (with 95% confidence) and may not correspond to true hematoma growth. SegTool, on the other hand, had a between-operator MDC of 9.51 mL. An expansion of 12.5 mL measured this way is too large to be explained by measurement variability alone. Consequently, it may be ascribed to ICH growth.
A number of previous studies have compared ABC/2 with ≥1 computer-assisted method for measuring ICH volume. For example, Divani et al4 compared ABC/2 with planimetric measurements made with Medical Image Processing, Analysis, and Visualization (National Institutes of Health, Bethesda, Maryland) and with computer-assisted segmentation with Analyze software (AnalyzeDirect, Overland Park, Kansas) and Voxar 3D (Barco NV, Kortrijk, Belgium). Their study focused on determining measurement bias. Measurements were made from a silicone phantom and from simulated lesions implanted in cadaver brains. A variety of CT protocols were used. They found that ABC/2 produced large overestimations of lesion volume. They did not report measurement precision or time.
Freeman et al26 compared ABC/2 with Analyze in a series of 8 patients with ICH treated with warfarin. They used the Analyze measurements to estimate true lesion volumes. These were then used to estimate the measurement bias of ABC/2. They concluded that ABC/2 has a small measurement bias for small lesions but can produce large errors (both over- and underestimation of true volume) for large or complex lesions. They did not exhaustively examine measurement time but reported that the most accurate method of measuring lesion volume with Analyze required 20–30 minutes per study, after a steep learning curve. They did not report measurement precision.
Xu et al24 compared ABC/2 with computer-assisted measurements made with an intensity-threshold algorithm in 3D Slicer (http://www.slicer.org) in 294 CT examinations. Two physicians each made a single measurement of each lesion with each method. They used the Slicer measurements to estimate true lesion volumes. These were then used to estimate the measurement bias of ABC/2. They also divided the lesions into groups based on size and shape and compared the 2 measurement methods between groups. They concluded that ABC/2 overestimated lesion volumes and that these errors increased with lesion volume and more complex shape. They reported that the average time required to measure lesion volume with 3D Slicer was 96 seconds. They did not report measurement precision or ABC/2 measurement times.
Kosior et al7 compared ABC/2 with computer-assisted measurements made using custom-developed software (Quantomo) that used an intensity-threshold algorithm available as part of the Insight Segmentation and Registration Toolkit (National Institutes of Health, Bethesda, Maryland). The study of Kosior et al was focused on evaluating measurement precision. As in our study, they used a test-retest experiment and a 2-way random-effects ANOVA to determine the MDC for each method. They also had 4 operators each perform 2 repeat measures using each measurement method. They reported the within-operator MDCs for ABC/2 and Quantomo as 15.7 and 5.3 mL, respectively (versus our values of 7.47 and 7.37 mL for ABC/2 and SegTool [after review], respectively). Their reported between-operator MDCs for ABC/2 and Quantomo were 37.0 and 8.1 mL, respectively (versus our results of 13.94 and 9.51 mL, respectively). There were several differences between their methods and ours. These include the following: 5 days between repeated measures (versus 2 weeks in our study) and measurement of 30 CT scans (versus 70 in our study). It is also likely that their CT protocol was more consistent among patients than ours because their patients were recruited from a clinical trial, whereas ours were recruited from our general patient population during several years. Finally, they did not report measurement bias or times.
One of the weaknesses of our study was the need to have operators review their initial SegTool measurements. This review was performed in a blinded fashion—operators were not provided with any information on which studies may have had leaks. They were free to redo or edit any, all, or none of their prior measurements. In total, 140 of the initial 560 segmentations were revised. The median result was to reduce the lesion volume by 0.01 mL. The mean effect was to reduce lesion volume by 2.2 mL. The impact on measurement precision was to reduce between-operator MDC from 11.93 to 9.51 mL and to reduce the within-operator MDC from 9.93 to 7.37 mL.
We could make several modifications to SegTool to increase the visibility of LS leaks and/or reduce their likelihood. By default, the segmented region was highly translucent. This made LS growth into brightly saturated bone very difficult to see. Simply increasing the default opacity of the segmented region would address this limitation. We could also preprocess the image volumes to strip skulls. Several open-source algorithms are available to perform this task; however, this would cause delays in interpretation.
Conclusions
SegTool measurements took 9 seconds longer to complete on average. However, the SegTool measurements were not significantly different from the true ICH volumes, while ABC/2 overestimated ICH volume by 45%. The between-operator measurement variability with SegTool was 50% less than that with ABC/2. SegTool was capable of detecting clinically important differences in ICH volume, whereas the ABC/2 was not. Consequently, SegTool could be useful in clinical trials and clinical practice when intervention and prognostication rely on accurate baseline ICH volume or detecting changes in serial ICH volumetric measurements.
Footnotes
The first authors, W. Xue and S. Vegunta, contributed equally to this work.
The senior authors, B.M. Demaerschalk and J.R. Mitchell, contributed equally to this work.
Disclosures: Bart M. Demaerschalk—UNRELATED: Other: Co-Editor-in-Chief of Neurologist.
REFERENCES
- Received September 6, 2016.
- Accepted after revision April 9, 2017.
- © 2017 by American Journal of Neuroradiology


