
Abstract
BACKGROUND AND PURPOSE: MR imaging has been shown to be useful in the diagnosis of juvenile idiopathic arthritis of the temporomandibular joint. Prior MR imaging approaches have relied mainly on the subjective interpretation of synovial enhancement as a marker for synovial inflammation. Although, more recently, several attempts have been made to quantify synovial enhancement, these methods have not taken into account the dynamic enhancement characteristics of the temporomandibular joint and the effect of sampling time. Our aim was to develop a clinically feasible, reproducible, dynamic, contrast-enhanced MR imaging technique for the quantitative assessment of temporomandibular joint synovitis in patients with juvenile idiopathic arthritis and to study the effect of sampling time on the evaluation of synovitis.
MATERIALS AND METHODS: This was a retrospective study of all patients who had dynamic, contrast-enhanced coronal T1 3T MR imaging through the temporomandibular joint at our institution between January 1, 2015, and July 8, 2016. Patients in this cohort included those with a history of juvenile idiopathic arthritis and control patients who underwent MR imaging for other routine, clinical purposes. Synovial enhancement was calculated for each temporomandibular joint using 3 different types of equations termed normalization ratios. The enhancement profiles generated by each equation were studied to determine which provided the best discrimination between affected and unaffected joints, was the least susceptible to sampling errors, and was the most clinically feasible.
RESULTS: A ratio of synovial enhancement (defined as the difference between the postgadolinium and the pregadolinium T1 signal of the synovium) to the postgadolinium signal of the longus capitis provided the best discrimination between affected and unaffected joints, the least susceptibility to sampling error, and was thought to be the most clinically feasible method of quantification of synovial inflammation. Additional synovial enhancement ratios studied did not provide the same level rates of discrimination between the affected and unaffected joints and were thought to be too temporally variable to provide reliable clinical use.
CONCLUSIONS: We provide a robust, reproducible, dynamic gadolinium-enhanced MR imaging technique for the quantitative assessment of temporomandibular joint synovitis in patients with juvenile idiopathic arthritis.
ABBREVIATIONS:
- JIA
- juvenile idiopathic arthritis
- LC
- longus capitis
- NR
- normalization ratio
- TMJ
- temporomandibular joint
The International League of Associations for Rheumatology defines juvenile idiopathic arthritis (JIA) as an arthritis of unknown etiology that begins before the sixteenth birthday and lasts for a minimum of 6 weeks.1 The incidence of JIA is estimated at 10.3/100,000.2 The temporomandibular joint (TMJ) is frequently involved in JIA; TMJ involvement in patients with JIA occurs in 17%–87% of patients.3
MR imaging has been shown to be useful in the diagnosis of JIA of the TMJ.4 While many prior MR imaging approaches have relied on subjective interpretation of synovial enhancement more recently, attempts have been made to assess the utility of quantitative analysis of TMJ synovial enhancements.5⇓⇓–8 Peacock et al6 defined a ratio of the TMJ synovial postgadolinium signal intensity normalized to the longus capitis muscle in control patients and found a 95% specificity threshold of 1.55. Resnick et al8 found that the 1.55 threshold had a 91% sensitivity and 96% specificity for detecting synovitis in symptomatic JIA TMJs. These results, however, rely on measurements of synovial enhancement at a single time point that may not reflect the dynamic contrast enhancement of the TMJ synovia and do not take into consideration the effect of sampling time. The purpose of our study was to establish a reproducible, practical technique for the study of dynamic enhancement curves of the TMJ in patients with JIA and in controls and to determine the effect of sampling time.
Materials and Methods
Study Design
This is an institutional review board–approved, retrospective study in patients who had dynamic contrast-enhanced MR imaging through the TMJ at our institution between January 1, 2015, and July 8, 2016. The dynamic contrast-enhanced technique used in this study was performed on all TMJ MRIs for patients with JIA and for some patients with neuroendocrine MRIs who served as controls.
Patients 18 years of age or younger who underwent dynamic contrast-enhanced MR imaging through the TMJ and longus capitis muscles were included. For controls, only patients in whom dynamic coronal T1 sequences included both the TMJ and the longus capitis muscle (and the target sella turcica) were included.
Exclusion criteria included a history of mandibular/facial trauma, jaw/neck tumor, craniofacial malformation, prior radiation, chemotherapy, or vasculopathy. For controls, additional exclusion criteria included any history of jaw findings: pain, limited range of motion, clicking, mandibular asymmetry, or retrognathia. Any study with artifact that compromised interpretation of the images was excluded.
Clinical Data
For patients with JIA, electronic medical records were reviewed for sex; International League of Associations for Rheumatology classification; age at the time of JIA diagnosis, at first presentation with TMJ findings, and at time of MR imaging; TMJ findings including limitation of jaw opening, pain, mandibular asymmetry, retrognathia, bilateral/unilateral TMJ involvement, presence of TMJ symptoms at MR imaging; and medication history, as described in On-line Tables 1 and 2.
For control patients, electronic medical records were reviewed for sex, age at MR imaging, indications for MR imaging, and use of any immunosuppressants within 3 months of MR imaging, as listed in On-line Table 3.
Imaging Technique
MRIs were performed on 2 platforms, either a Tim Trio 3T (Siemens, Erlangen, Germany) using a 32-channel head coil or a Discovery MR750 3T (GE Healthcare, Milwaukee, Wisconsin) using an 8-channel head coil. Details of the MR dynamic imaging technique are shown in Table 1.
Dynamic gadolinium MRI technique for imaging of the TMJ
Normalized Ratios
Measurements of the TMJ synovial signal were performed as follows: Ten 0.5-mm2 ROIs were measured over each TMJ on the precontrast sequence, 5 over the superior joint compartment and 5 over the lower joint compartment where the measurements were distributed in a standard fashion from lateral to medial across the joint (Fig 1). Ten 0.5-mm2 ROIs were then measured similarly over each TMJ on each of the 10 postgadolinium runs for a total of 100 postgadolinium measurements per joint (Fig 1). This technique resulted in 110 measurements per joint (100 postgadolinium + 10 pregadolinium) and 220 measurements per patient (Fig 1).

A and B, Coronal scanning plane and ROI-based measurements of the TMJ synovia. An oblique coronal plane was prescribed off the sagittal localizer to include the entire right and left TMJs and the longus capitis in the same coronal FOV. The coronal plane was angled superoanterior to posteroinferior to include both the TMJs from anterior to posterior and the longus capitis muscle; in controls, the oblique coronal plane included both TMJs, the longus capitis, and the sella turcica. C, An example of a single ROI at the superomedial synovial edge of the right TMJ (0.5 mm2) on a precontrast MR imaging and a single ROI placed along the longus capitis muscle (50 mm2), which was used for normalization. D, Example of the 10 ROIs placed on a postgadolinium MR imaging. These ROIs are placed along the superior and inferior synovial compartments of the left TMJ with the following designations: SL indicates superior compartment, lateral edge; SML, superior compartment, midlateral edge; SC, superior compartment, central; SMM, superior compartment, midmedial edge; SM, superior compartment, medial edge; IL, inferior compartment, lateral edge; IML, inferior compartment, midlateral edge, IC, inferior compartment, central; IMM, inferior compartment, midmedial edge; IM, inferior compartment, medial edge. Although attempts were made to measure the signal along the area closest to the disk edge in the expected location of the synovium, these measurements undoubtedly reflect a composite of signal produced by the synovium, cartilage, and perhaps the periosteum. Thus, the notion of “synovial signal” used in this report reflects this currently unavoidable composite measurement.
We then defined 3 distinct quantitative measures of synovial inflammation that we normalized to an internal structure (the longus capitis muscles) to allow for comparison across different patients and time points, ER1, ER2, and R, that we termed collectively “normalized ratios”. ER1 = (postgadolinium T1 signal of the TMJ synovium − the pregadolinium T1 signal of the TMJ synovium) divided by the (postgadolinium T1 signal of the longus capitis − the pregadolinium T1 signal of the longus capitis) where ER1 thus represents the ratio of the enhancement of the TMJ synovium to the enhancement of the longus capitis. ER2 = (postgadolinium T1 signal of the TMJ synovium − the pregadolinium T1 signal of the TMJ synovium) divided by the postgadolinium T1 signal of the longus capitis where ER2 thus represents the ratio of the enhancement of the TMJ synovium to the postgadolinium T1 signal of the longus capitis. R = the postgadolinium T1 signal of the TMJ synovium divided by the postgadolinium T1 signal of the longus capitis and thus represents a ratio of postgadolininium signals. R is not a true “enhancement” ratio as measures of enhancement require a subtraction of pregadolinium signal from postgadolinium signal that is incorporated into ER1 and ER2 but not into R (Table 2). Then, the individual and average values for ER1, ER2, and R were plotted over the entire 13-minute 10-second sampling period for each patient, for each joint, and at each time point, to yield dynamic normalized ratio profiles.
Measurements of signal intensity over the synovium and longus capitis muscles and calculation of the normalized ratios ER1, ER2, and R
The joints were then organized into 3 groups: 1) symptomatic joints in patients with JIA, 2) asymptomatic joints in patients with JIA, and 3) controls.
Peak, time to peak, and minimums for ER1, ER2, R, were plotted over the 13-minute 10-second sampling period for each joint.
The ER1s, ER2s, and Rs for each joint were grouped into 0 minutes 00 seconds to 3 minutes 50 seconds; 4 minutes 00 seconds to 7 minutes 50 seconds; and 8 minutes 00 seconds to 12 minutes 10 seconds minute intervals and averaged for each joint over these sampling intervals. The average rate of change of ER1, ER2, and R for each sampling period was determined for symptomatic JIA, asymptomatic JIA, and control joints.
R, the ratio of the postgadolinium T1 signal of the synovium to the postgadolinium T1 signal of the longus capitis, (one of the 3 normalized ratios used in this study), corresponds to the ratio previously published by Resnick et al8 and Peacock et al.6 In these publications, a 1.55 threshold was proposed as a reliable discriminator between symptomatic JIA and control joints.7,9 For each temporal sampling point, the relation of R, above or below, to the threshold 1.55 was recorded.
Similarly, for ER2, the relation of each sampling point, to a threshold value 0.95, above or below, was recorded.
Longus Capitis T1 Signal Measurements
The raw, non-normalized T1 signal from the longus capitis muscle was recorded on the pregadolinium T1 sequence and at each postgadolinium time point for the JIA and control patients.
Interrater Agreement
Measurements of synovial T1 signal intensity and the longus capitis were performed independently by 2 raters (K.B., a second-year neuroradiology fellow, and P.C., an attending neuroradiologist with 15 years of head and neck radiology experience).
In 10 joints, each at a different time points, both readers independently measured the lateral edge, center, and medial edge of either the superior or the inferior joint compartment. Thus, 30 ROIs were measured independently by both readers. Interrater agreement was calculated with a κ score.
Statistics
A Mann-Whitney U test was used to compare differences among symptomatic, asymptomatic, and control joints for the ER1 and ER2 equations among asymptomatic JIA and control joints, symptomatic JIA and asymptomatic JIA joints, and symptomatic JIA and control joints. These comparisons were made at each of the 10 postgadolinium sampling points.
Calculations were performed using MedCalc statistical software, Version 16.8.4 (MedCalc Software, Mariakerke, Belgium). A 2-tailed t test was used to evaluate differences in raw, non-normalized, average values of the longus capitis among the 3 clinical groups.
Results
Study Design
Eight patients (1 male, 7 females) with JIA (16 joints) and 4 (1 male, 3 females) control patients (8 joints) were included in this study.
Clinical Data
The clinical data for the patients with JIA and control group are shown in On-line Tables 1–3.
The average age at MR imaging of the JIA group was 16.1 ± 7.9 years (range, 7.1–33.3 years). The average age at MR imaging of the control group was 15.5 ± 3.7 years (range, 10–18 years). Seven of 8 patients with JIA had been treated with some type of anti-inflammatory agent, and 5 had undergone intra-articular steroid injection before MR imaging.
Results of the Dynamic NR TMJ Profiles
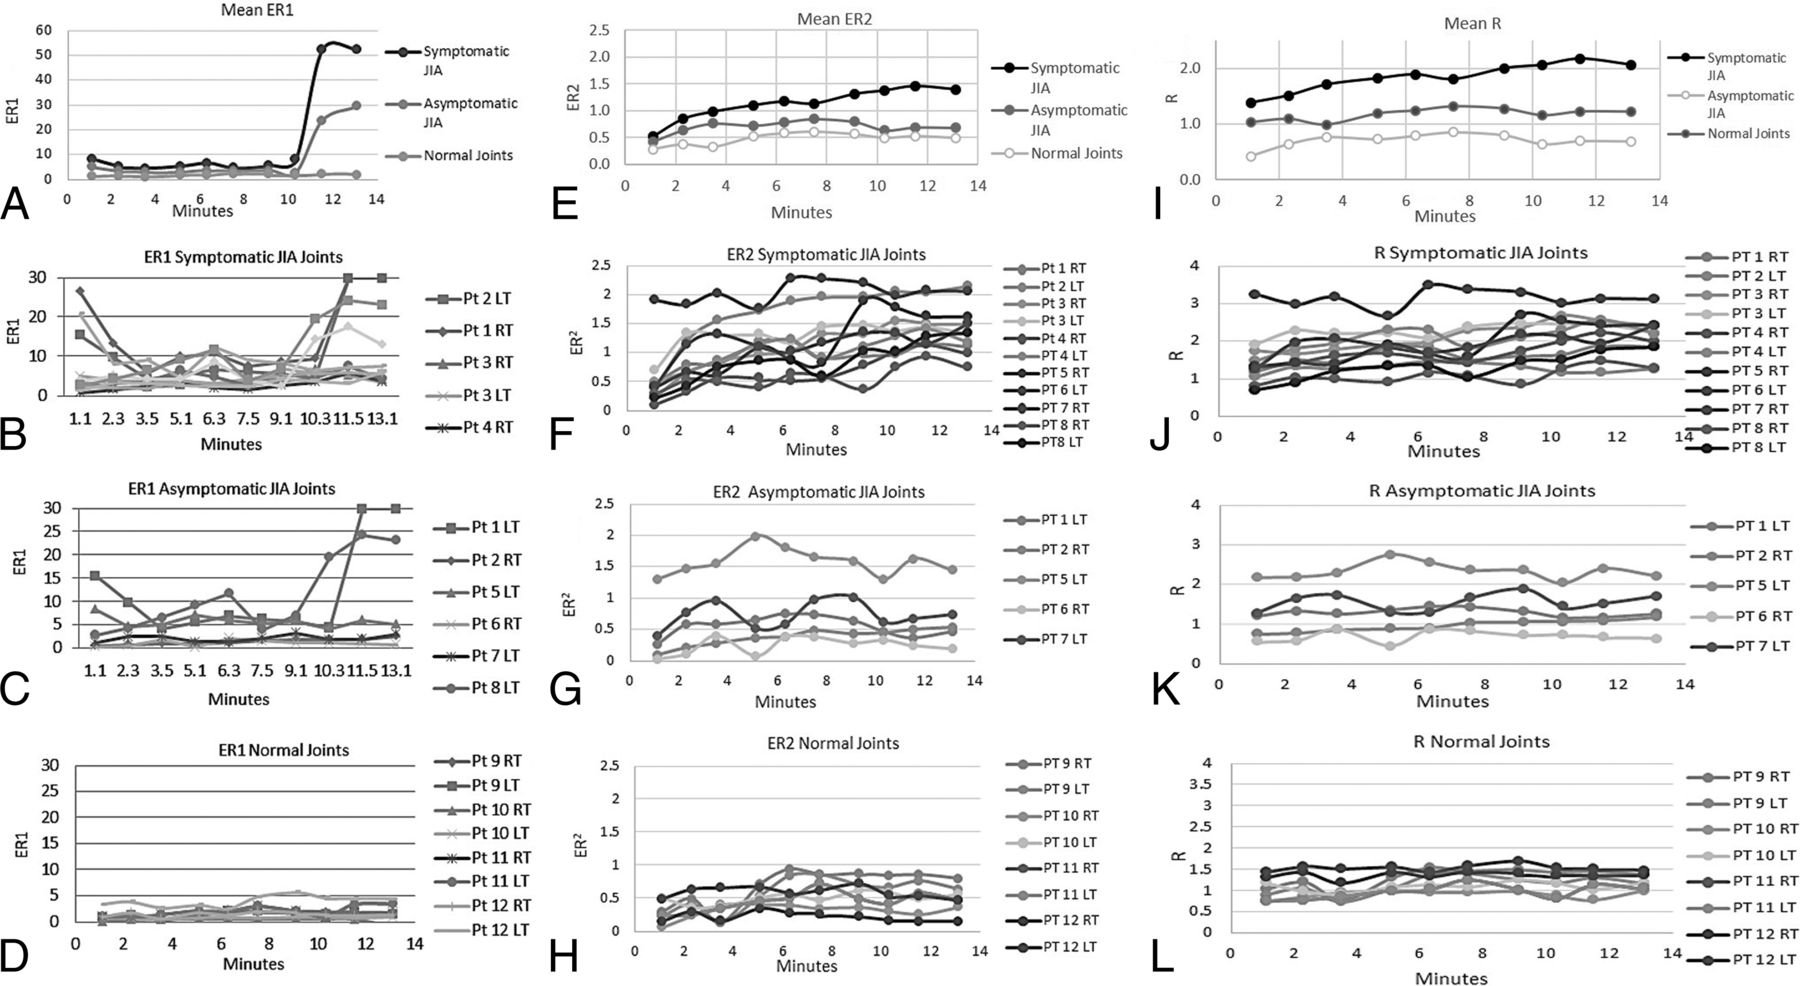
ER1, the ratio of the whole joint (superior and inferior synovia) enhancement normalized to the enhancement of the longus capitis muscle, is shown in Fig 2A–D. ER2, the ratio of the whole joint (superior and inferior synovia) enhancement normalized to the postgadolinium T1 value of the longus capitis muscle is shown in Fig 2E–H. R, the ratio of the whole joint (superior and inferior synovia) postgadolinium T1 signal value normalized to the postgadolinium T1 value of the longus capitis muscle is shown in Fig 2I–L.

A, Mean ER1 for the symptomatic JIA, asymptomatic JIA, and control joints. ER1 shows a monopeak profile with an upward slope that starts at 10 minutes 30 seconds at the end of run 8 and clear separation of the curves between 10 minutes 30 seconds and 13 minutes 10 seconds during runs 9 and 10. B, Individual patient profiles for ER1 for the symptomatic JIA joints. C, Individual patient profiles for ER1 for the asymptomatic JIA joints. D, Individual patient profiles for ER1 for the control TMJ joints. These joints exhibit relatively constant enhancement ratios between 0.73 and 5 at all time points. E, Mean ER2 for the symptomatic JIA, asymptomatic JIA, and control joints. Note the clear separation among the 3 groups at all sampling time points with the mean profile for the symptomatic JIA group showing a monopeak profile. Also, the mean profile of the asymptomatic JIA group is higher at all time points than the mean profile for the control group. F, Individual patient profiles for ER2 for symptomatic JIA joints. All but one of the symptomatic joints, patient 8 RT TMJ, pass above the threshold value of normal (0.95) at multiple time points that thus results in correct classification of 10/11 symptomatic joints. G, Individual patient profiles for ER2 for asymptomatic JIA joints. Most profiles stay below the threshold normal value (0.94) while several pass above. H, Individual patient profiles for ER2 for control TMJ joints. The initial ER2 at 1 minute 10 seconds ranges from 0.15 to 0.5, and the end ER2 for this group at 13 minutes 10 seconds ranges from 0.14 to 0.63. The maximum ratio (peak) reached by any single patient at any time point is 0.94 that serves as a threshold value for normal for ER2. I, Mean R for the symptomatic JIA, asymptomatic JIA, and control joints. Note the clear separation among the 3 groups at all sampling time points. The mean profile for the symptomatic JIA group shows a monopeak profile. J, Individual patient profiles for R for the symptomatic JIA joints. Two joints, patient 2 L TMJ and patient 8 R TMJ, never pass above the 1.55 threshold and thus would be misclassified by R as asymptomatic joints. A third joint, patient 8 L TMJ, passes above the threshold only twice that may result in an indeterminate or borderline classification. K, Individual patient profiles for R for the asymptomatic JIA joints. Two of these joints, patient 5 L TMJ and patient 7 L TMJ pass above the normal threshold. L, Individual patient profiles for R for the control TMJ joints. While most of these joints stay below the 1.55 threshold, one joint, patient 12 L TMJ passes above the threshold at 4 time points, that may lead to misclassification of this joint.
The individual patient and average group values for peak, time to peak, minimum, and average values grouped into 0–3:50, 4–7:50, and 8–12:10 minute intervals, and rates of change over these intervals for ER1, ER2, and R are reported in On-line Tables 4 and 5. For R, the number of times the NR profile for each joint fell below or above the 1.55 threshold is reported in On-line Table 4. For ER2, the number of times the NR profile for each joint fell below or above the maximum NR for the control joints of 0.94 is shown in On-line Table 5.
Longus Capitis T1 Signal
The longus capitis T1 signal profiles show a monomodal peak at 5 minutes 10 seconds for the JIA and control groups and a relative plateau from 5 minutes 10 seconds to 13 minutes 10 seconds (Fig 3).

Raw T1 hyperintensity curves of the longus capitis muscle as measured on the precontrast image and each of the 10 postgadolinium dynamic images. The raw signal of the longus capitis is similar at all sampling time points in both the JIA and control groups: no statistically significant difference (P = .99) was seen at any time point, suggesting that the longus capitis may serve as a normalization standard for both normal and symptomatic groups.
Statistics
The results of the statistical analyses are shown in On-line Table 6.
The results of the interrater agreement between the 2 raters, K.B. and P.C., was 0.73, corresponding to a κ rating of good agreement. P values for the average longus capitis T1 signal showed no statistically significant difference between the JIA and control patients (P = .99).
Comparison of Synovial Enhancement Using the ER1 Equation
Asymptomatic JIA versus Control Joints.
Significant differences in ER1 were noted between these 2 groups at the third postgadolinium time point (P = .03); however, ER1 values at the remaining postgadolinium time points did not demonstrate a statistically significant difference (P = .10–.88).
Symptomatic JIA versus Control Joints.
Statistically significant differences in ER1 were noted between these 2 groups at all postgadolinium time points (P ≤ .001–.04).
Asymptomatic JIA versus Symptomatic JIA Joints.
A statistically significant difference in ER1 between these 2 groups for the eighth postgadolinium time point (P = .009) was noted. Otherwise, no statistically significant difference between synovial enhancement ratios at the remaining postgadolinium time points (P = .08–.36) was seen.
Comparison of Synovial Enhancement Using the ER2 Equation
Asymptomatic JIA versus Control Joints.
No significant difference was observed for ER2 at all postgadolinium time points between these 2 groups (P = .06–1.0). Of note, the third postgadolinium time point trended toward significance with P = .06.
Symptomatic JIA versus Control Joints.
Significant differences were seen at all postgadolinium time points except for the first postgadolinium time point (P = .001–.006).
Asymptomatic JIA versus Symptomatic JIA Joints.
Significant differences were seen at later postgadolinium time points, between 9 minutes 20 seconds and 13 minutes 10 seconds (P = .01, .03, .01, respectively). There was no statistically significant difference at earlier time points (P = .08–.33).
Discussion
We propose the current study as an illustration of a rigorous technique for quantification of TMJ synovial inflammation in patients with JIA. The technique was controlled for hardware, sequences, injection technique, scan plane, mouth position, and timing of the postgadolinium images. We used 3T platforms with either 32- or 8-channel head coils, readily commercially available standard T1 postgadolinium spin-echo sequences in the coronal plane, and 10 sampling points during a 13-minute postinjection period. Prior studies using dynamic, contrast-enhancement techniques of the TMJ in patients with JIA were retrospective and thus have not been controlled rigorously for hardware, injection technique, or sampling timing.
Our results show that synovial enhancement curves for patients with JIA are, on average, notably temporally dependent so that technical variations in the acquisition of postgadolinium sequences can place the interpretation at risk of misclassification of a joint, underestimate degree of synovial inflammation, and, over serial scans, compromise evaluation of the response to treatment.
We used 5 separate ROIs spaced evenly across the TMJ in the coronal plane to sample synovial enhancement. The ROI-based assessment performed in this study using a small, 0.5-mm2 sampling area minimizes contamination of T1 signal intensity from the intra-articular disk. We found that 5 separate ROI measurements were associated with a good interrater agreement. We think that the coronal plane is superior to the axial plane in that it allows a more precise placement of ROIs along the synovia and allows inclusion of both TMJ in the same dynamic run.10
Our results show the longus capitis muscle to be an excellent candidate for normalization. No significant difference was seen between enhancement of the longus capitis muscle in JIA and control patients, and the longus capitis demonstrates a long postinjection temporal signal plateau. Synovial TMJ postcontrast T1 signal depends on multiple technical parameters, including magnet strength, scanner platform, TR/TE parameters and injection technique, patient hemodynamics, and intrinsic T1 signal intensity of the TMJ synovium. Because of these variations in both technical and physiologic parameters, it is important to adopt a method for normalizing the quantitative measurements of the synovium to allow comparisons between scans performed on different patients and at different time points. Prior publications have chosen different normalization ratios, normalizing to the same joint or normalizing by the signal-to-noise ratio.8,10 The longus capitis muscle was chosen as a candidate for normalization because it is not known to be affected in JIA; it lies in the center of the FOV and thus is less susceptible to peripheral scan artifacts or motion artifacts; and it can be feasibly included in coronal T1 sequences.
ER2 is preferable to ER1 and R in that ER2 provides the most favorable ratio of average peak values for symptomatic to asymptomatic joints at 1.73 (1.52/0.88), compared with ER1 1.65 (50.34/30.30) and R 1.4 (2.27/1.6), shows a more favorable ratio of average peak values between symptomatic joints and controls 2.27 (1.52/0.67) compared to R 1.67 (2.27/1.36), and exhibits a slightly more favorable ratio of average peak values between asymptomatic joints and controls 1.3 (0.88/0.67) compared to R, 1.2 (1.6/1.36).
ER2 is preferable to ER1 in that ER2 similar to ER1 discriminates with statistical significance between symptomatic JIA joints and controls at nearly all postgadolinium time points and ER2, unlike ER1, also discriminates with statistical significance between symptomatic and asymptomatic JIA joints beyond 10 minutes, a feasible sampling point for clinical use.
ER2 is preferable to ER1 also in that ER2 provides a longer temporal plateau from 9–13 minutes post injection, compared to ER1 that undergoes a steep upswing during this period (compare Fig 2A to Fig 2E). The long temporal plateau of ER2 is preferable in that it is less susceptible to technical variations in sampling time.
ER2 is preferable to R in that it classifies the TMJ joints better than R. We used the peak ER2 value among control patients over the entire dynamic profile (0.95, patient 9 [right TMJ] at 6 minutes 30 seconds) as a threshold for ER2 and the published 1.55 R threshold.6,8 Using these thresholds, we found that ER2 classified 10/11 symptomatic JIA joints correctly compared with 9/11 joints for R.
ER2 is also conceptually preferable to R in that ER2 is a measure of true synovial enhancement (postgadolinium T1 signal–pregadolinium T1 signal) whereas R reflects the ratio of postgadolinium signal in the synovium to postgadolinium signal in the longus capitis muscle but does not reflect synovial enhancement in the strict sense.
We determined the optimal sampling time to be between 7 minutes 50 seconds and 13 minutes 10 seconds. We studied the average NRs for ER1, ER2, and R over 3 sampling periods, 0–3 minutes 50 seconds; 3 minutes 50 seconds to 7 minutes 50 seconds; and 7 minutes 50 seconds to 13 minutes 10 seconds, reasoning that the most favorable sampling period would be when differences among the NRs for each group were greatest and the profiles exhibited a steady-state or temporal plateau. Our results showed the 7 minute 50 second to 13 minute 10 second periods to be preferable for such.
Our results raise some interesting considerations regarding the effect of medication. For ER2, for example, 3/5 asymptomatic JIA joints (patient 1, left TMJ; patient 2, right TMJ; and patient 6, right TMJ) fell below the control maximum at all sampling time points, thus showing an ER2 consistent with control joints. All 3 of these patients were on antitumor necrosis factor medications at the time of imaging. Two of 5 asymptomatic JIA joints fell above the control threshold, and one of these joints was above the control threshold at all time points, producing a profile curve like that of symptomatic JIA joints. This patient was not on systemic therapy and had no prior exposure to antitumor necrosis factor medications. These preliminary results allow the consideration that asymptomatic joints in patients with JIA behave differently than control joints and are suggestive of a possible normalizing effect of the antitumor necrosis factor medications on NRs that may reflect a therapeutic effect on clinically silent joints in patients with JIA.
Our study provides a robust technique for the quantitative evaluation of synovial enhancement as a biomarker for TMJ synovitis in JIA. Although our patient numbers are low, our data illustrate this method, for which larger numbers of patients would be required for more definitive characterization of enhancement profiles. The study is limited by image resolution. It is not currently feasible to sample the synovia separate from adjacent cartilage and periosteum. The study is limited by heterogeneity of patient treatment regimens. This limitation is nearly unavoidable because only rarely do patients with JIA present initially with TMJ symptoms. A future direction would be to develop a standardized imaging-treatment algorithm to monitor synovial enhancement in response to a controlled treatment regimen to understand the pathophysiology of JIA.
Our study is labor intensive in that each joint requires 110 measurements; however, we consider this limitation as a temporary step needed to characterize the temporal enhancement profile of the TMJ so that, in practice, once these profiles are fully characterized, the radiologist may target a particular number of samples and a particular temporal sampling point, for example, from 8–10 minutes post injection.
Conclusions
We provide a robust, clinically feasible, reproducible, dynamic gadolinium-enhanced technique for the quantitative assessment of TMJ synovitis in JIA. We explored 3 NRs, each of which normalizes the postgadolinium synovial signal to an easily measurable, internal reference and found that ER2 is the preferred equation for the quantitative assessment of synovial inflammation. Our data show the dependency of synovial enhancement on sampling time and the misclassification of joints that may result from sampling time inconsistencies and suggest that the preferred sampling time for synovial enhancement lies between 7 minutes 50 seconds and 13 minutes 10 seconds. We therefore provide what we hope will serve as a platform for the quantitative assessment of TMJ synovitis in JIA and areas for future research.
Footnotes
Disclosures: Zachary S. Peacock—UNRELATED: Grants/Grants Pending: Oral and Maxillofacial Surgery Foundation, AO Foundation, Comments: for research on distraction osteogenesis*; Payment for Lectures Including Service on Speakers Bureaus: Ethicon/Depuy Synthes, Comments: provided lecture to Ethicon employees on the use of their products for distraction osteogenesis in June 2016 and received honorarium. Hugh D. Curtin—UNRELATED: Royalties: Elsevier, Comments: royalties for a book. *Money paid to the institution.
Paper previously presented in part at: Annual Meeting of the American Society of Head and Neck Radiology, September 7–11, 2016; Washington, DC.
References
- Received April 5, 2017.
- Accepted after revision July 16, 2017.
- © 2017 by American Journal of Neuroradiology


Jump to section
Related Articles
Cited By...
- No citing articles found.