
Abstract
BACKGROUND AND PURPOSE: Photon-counting detectors offer the potential for improved image quality for brain CT but have not yet been evaluated in vivo. The purpose of this study was to compare photon-counting detector CT with conventional energy-integrating detector CT for human brains.
MATERIALS AND METHODS: Radiation dose–matched energy-integrating detector and photon-counting detector head CT scans were acquired with standardized protocols (tube voltage/current, 120 kV(peak)/370 mAs) in both an anthropomorphic head phantom and 21 human asymptomatic volunteers (mean age, 58.9 ± 8.5 years). Photon-counting detector thresholds were 22 and 52 keV (low-energy bin, 22–52 keV; high-energy bin, 52–120 keV). Image noise, gray matter, and white matter signal-to-noise ratios and GM–WM contrast and contrast-to-noise ratios were measured. Image quality was scored by 2 neuroradiologists blinded to the CT detector type. Reproducibility was assessed with the intraclass correlation coefficient. Energy-integrating detector and photon-counting detector CT images were compared using a paired t test and the Wilcoxon signed rank test.
RESULTS: Photon-counting detector CT images received higher reader scores for GM–WM differentiation with lower image noise (all P < .001). Intrareader and interreader reproducibility was excellent (intraclass correlation coefficient, ≥0.86 and 0.79, respectively). Quantitative analysis showed 12.8%–20.6% less image noise for photon-counting detector CT. The SNR of photon-counting detector CT was 19.0%–20.0% higher than of energy-integrating detector CT for GM and WM. The contrast-to-noise ratio of photon-counting detector CT was 15.7% higher for GM–WM contrast and 33.3% higher for GM–WM contrast-to-noise ratio.
CONCLUSIONS: Photon-counting detector brain CT scans demonstrated greater gray–white matter contrast compared with conventional CT. This was due to both higher soft-tissue contrast and lower image noise for photon-counting CT.
ABBREVIATIONS:
- CNR
- contrast-to-noise ratio
- EID
- energy-integrating detector
- ICC
- intraclass correlation coefficient
- PCD
- photon-counting detector
Brain CT remains the first-line technique of choice for the evaluation of traumatic and nontraumatic brain injury and is the most-often-performed CT examination in many emergency departments.1,2 However, there is limited gray matter–white matter differentiation with brain CT, decreasing the ability to assess the hypoattenuation and loss of GM–WM differentiation seen in early ischemic brain changes.3,4 In addition, beam-hardening artifacts due to attenuation by the skull of lower energy photons degrade brain CT diagnostic image quality, potentially mimicking intracranial hemorrhage and reducing GM–WM differentiation.5
The energy spectrum of x-ray tubes for CT is usually characterized by the peak kilovoltage, but the applied x-ray spectrum consists of a wide distribution of lower energy photons. Conventional CT uses energy-integrating detectors (EIDs) to combine the effects of x-ray photon number and photon energy into an intensity value through conversion of x-rays to light photons to electrical pulses. Consequently, with EID CT, low-energy photons (eg, 40–70 keV) have less contribution to the CT intensity value than high-energy photons (eg, 110–140 keV). For brain imaging however, it is these low-energy photons that have better soft-tissue discrimination for identification of gray–white matter contrast.
Photon-counting detectors (PCDs) are a new technology for CT imaging that directly converts x-ray photons into electrical pulses. PCDs measure the number of detected x-ray photons (ie, photon count) and their photon energy.6⇓⇓⇓⇓–11 These characteristics allow equal weighting of low- and high-energy photons and may therefore be useful for improving soft-tissue contrast in the brain.8 In addition, the direct conversion and counting of individual photons provide a better estimate of the underlying photon statistics, which, in turn, may improve image quality by reducing image noise.8,12⇓–14 We hypothesized that the combined effects of better contrast and reduced noise may lead to better overall GM–WM differentiation in brain PCD CT.
To date, PCD CT scanning of a cadaver head15 has suggested the feasibility of PCD for brain CT, but in vivo results have not been previously studied, to our knowledge. Thus, the purpose of the current study was to compare the image quality of PCD with that of conventional EID for human brain CT.
Materials and Methods
Ex Vivo Human Head Phantom Studies
We used a custom-made anthropomorphic head phantom made of a human skull embedded in plastic (Phantom Laboratory, Salem, New York) to assess image quality (Hounsfield unit accuracy and image noise) and calculate sample size. The phantom was filled with gel made from a mixture of agar and sucrose with attenuation values close to those of WM.
In Vivo Human Studies
This Health Insurance Portability and Accountability Act–compliant, institutional review board–approved study with informed consent prospectively enrolled 21 asymptomatic volunteers (42.9% men) older than 45 years of age at the National Institutes of Health Clinical Center. All study subjects were included in the analysis. Exclusion criteria were age younger than or equal to 45 years, prior CT scan within 12 months, pregnancy, and genetic predisposition to radiation-induced cancer.
Photon-Counting CT System
The whole-body prototype PCD CT system has been previously described.16 In brief, this hybrid scanner is based on a dual-source CT system (Somatom Definition Flash; Siemens, Erlangen, Germany) with 2 x-ray sources at 95° separation; one of the conventional EIDs was replaced with a cadmium-telluride PCD. The 2 subsystems cannot be operated simultaneously; however, it is possible to perform back-to-back EID and PCD scans with delays as short as 1 second. With identical x-ray sources and spectra and similar scanner geometries, this setup provides a convenient platform for EID versus PCD comparative studies. The EID and PCD have FOVs of 500 and 275 mm, and a collimation × pixel of 64 × 0.6 mm and 32 × 0.5 mm at the isocenter, respectively. Each PCD pixel consists of 4 × 4 subpixels, coupled to fast application–specific integrated circuits that count the number of electrical pulses created by incident photons and measure their energies above 2 set thresholds. The thresholds can be defined at 1-keV increments: low-energy threshold between 20 and 50 keV and high-energy threshold between 50 and 90 keV.
CT Scan Protocol
Spiral noncontrast EID brain CT scans were acquired at clinical routine settings according to the American Association of Physicists in Medicine guidelines (tube voltage/reference tube current-time product, 120 kVp/370 mAs; pitch, 0.55; rotation time, 1 second; volume CT dose index, 56.7 mGy).17 After a 5-second delay due to table movements, the EID scan was followed by a PCD scan with identical tube voltage, current-time, rotation time, and pitch values. The PCD energy thresholds were defined at 22 and 52 keV, resulting in 2 energy bins (low-energy bin, 22–52 keV; high-energy bin, 52–120 keV). The low threshold was set at 22 keV to capture all detected photons, whereas the high threshold was set at 52 keV to avoid low-energy scatter photons while still maintaining relatively high photon counts. We used the term “PCD images” to refer to images reconstructed from all detected photons with energies of >22 keV; the quality of these PCD images was compared with that of the EID images.
In addition, we investigated the quality of images reconstructed from low- and high-energy photons detected by the PCD. With the same tube voltage and tube current–time product settings, the volume CT dose index estimates for the PCD were approximately 10% higher than those for the EID. This is not a limitation of the PCD technology and can be attributed to the difference in z-axis collimation of the 2 detector systems in the prototype. Identical collimations would result in similar volume CT dose index values for both systems.18 Therefore, we matched the tube voltage and tube current–time product values to obtain a similar energy spectrum and the number of x-ray photons incident on both detector systems, allowing a fair comparison.13 The effective dose was calculated by multiplying the dose-length product by 0.0021 mSv/mGy as the constant k-value for brain imaging.
CT Image Reconstruction
Phantom scans were reconstructed using the sinogram-affirmed iterative reconstruction (strength 3 with J40f [medium] kernel) (ReconCT, Version 13.8.6.0; Siemens). Human scans were reconstructed with 2 different kernels: J40f to assess soft tissue and I70f (very sharp) to assess bone. The FOV was 250 mm with section thickness/increment of 2/2 mm and a 512 × 512 matrix size.
Qualitative Image Analysis
Two neuroradiologists (M.B. and D.S.R., with 23 and 14 years of experience, respectively) independently evaluated the image quality of the EID and PCD images on a conventional PACS system. Readers were blinded to CT detector type and study-subject demographics. Images were presented side by side in random order with initial standard window center/width values for brain (45/80 HU) and bone (490/2500 HU). This presentation resulted in 84 blinded image reads (21 subjects × 2 readers × 2 detectors). Image-quality scores were based on the European Guidelines on Quality Criteria for Computed Tomography.19 Readers evaluated GM–WM differentiation, the posterior cranial fossa, ventricles, bone, and subjective image noise on a 5-point scale. The images were re-evaluated by 1 reader (M.B.) after 4 weeks to assess intrareader reproducibility.
Quantitative Image Analysis
ROIs were carefully positioned in the center of the head phantom to assess attenuation values and image noise. Image noise was calculated from corrected SDs of the difference of 2 repeated acquisitions for each detector system; the radial noise-power spectrum was estimated for a set of 3.2 × 3.2 cm ROIs centered 5.5 cm away from the isocenter, as explained in detail in Friedman et al.20 For human datasets, ROIs were placed in the basal ganglia GM, the internal capsule WM, and the lateral ventricle CSF. The average ROI size was 24.7 ± 4.2 mm2. Image noise was calculated as the SD of each ROI. The signal-to-noise ratio for GM and WM ROIs was calculated as mean attenuation divided by the SD. GM–WM contrast was calculated as the difference of their mean attenuation values. GM–WM contrast-to-noise ratio (CNR) was calculated as the GM-WM contrast divided by the square root of the sum of the variances.
Statistical Analysis
R statistical and computing software, Version 3.3.1 (http://www.r-project.org) was used for statistical analysis. The Shapiro-Wilk test was used for normality testing. Continuous data were expressed as mean ± SD. The Wilcoxon signed rank test (paired) with continuity correction was used to compare reader quality scores. The paired t test was used to compare continuous variables. Interreader and intrareader reproducibility was scored with the intraclass correlation coefficient (ICC) as excellent (ICC, >0.75), good (ICC, 0.40–0.75), or poor (ICC, <0.40). Significance was defined as P < .05. The improvement ratio of PCD compared with EID was calculated as the difference between EID and PCD quality indices (image noise, SNR, contrast, and CNR) divided by the value for the EID as described by Pomerantz et al.21 A priori sample size calculation was based on the interstudy SD of image noise difference between EID and PCD in the head phantom as described by Machin et al22 and Altman23 with the following formula: n = f(α, P) × σ2 × 2/δ2, where α is the significance level, P is the study power, f is a function of α and P, with σ as the interstudy SD, δ as the desired percentage difference to be detected; and n is the sample size needed. An image noise δ of 10% would correspond to approximately 20% radiation dose reduction without compromising diagnostic image quality.24 To compensate for increased variability in human subjects compared with phantom experiments, we doubled the σ value of our phantom measurements (9.6%). Under these circumstances, a paired comparison of 21 subjects would be sufficient to reliably detect a 10% image noise difference with P = 90% and α = .05.
Results
Ex Vivo Human Head Phantom Studies
Attenuation values in the center of the head phantom were similar for EID and PCD scans (25.2 ± 0.3 versus 24.5 ± 1.5 HU, P = .170). PCD images showed 8.5% ± 4.8% less image noise than EID images (4.1 ± 0.3 versus 3.8 ± 0.2 HU, P < .001). The radial noise-power spectrum at 5.5-cm off-center was estimated for both detectors. The PCD images showed lower noise power in most of the detectable spatial frequencies (Fig 1).

Radial noise-power spectrum (NPS) measured in an anthropomorphic head phantom for energy-integrating detector and photon-counting detector scans at 120 kVp and 370 mAs. The PCD curve was lower than the EID curve. The difference is more prominent at mid-to-high spatial frequencies.
In Vivo Human Head CT Studies
Twenty-one subjects (9 men, 12 women) were evaluated. The mean age for men, women, and all subjects was 61 years (range, 48–79 years), 57 years (range, 45–70 years), and 59 years (range, 45–79 years), respectively. No clinically relevant incidental findings were detected in our study population. The volume CT dose index was approximately 10% higher for the PCD system (63.6 versus 56.7 mGy for PCD and EID, respectively) (see “Materials and Methods”). This resulted in a dose-length product/effective dose of 860.7 ± 43.1 mGy × cm/1.8 ± 0.1 mSv for EID and 957.8 ± 45.2 mGy × cm/2.0 ± 0.1 mSv for PCD.
Qualitative Image Analysis
Each reader scored 21 pairs (42 acquisitions) of EID and PCD CT images in a blinded fashion. PCD image-quality scores were significantly better for GM–WM differentiation and image noise (both P < .001) (Fig 2). EID scores were better for the evaluation of the posterior fossa (3.5 ± 0.7 versus 3.3 ± 0.5, P = .003). Bone image-quality scores were similar for both detectors. Reader reproducibility was excellent for all scores (ICC, ≥0.86, and ICC, ≥0.79, for intra- and interreader reproducibility, respectively) (Table 1). Sample EID and PCD images are shown in Figs 3 and 4.

Blinded reader evaluation of image quality for energy-integrating detector and photon-counting detector head images. PCD scores are better for gray matter-versus-white matter differentiation and image noise, whereas EID scores are better for posterior fossa image quality (all P < .001, paired Wilcoxon signed rank test). Image quality scores are based on the European Guidelines for Image Quality Criteria for Computed Tomography.19
Interreader and intrareader reproducibility of subjective image-quality analysis

Example energy-integrating detector and photon-counting detector images of a 59-year-old woman (section thickness, 2 mm; increment, 2 mm; window center, 45 HU; window width, 80 HU). A, Axial EID reconstruction at the level of the basal ganglia. B, Axial PCD reconstruction at the same level as A. Lower image noise is shown for the PCD image. Zoomed-in EID (C) and PCD (D) images at the same level as A and B. C indicates caudate; I, internal capsule; L, lentiform nucleus; Th, thalamus.

Sample energy-integrating detector and photon-counting detector images of a 67-year-old man (section thickness, 2 mm; increment, 2 mm; window center, 45 HU; window width, 80 HU). A, Coronal EID image at the level of the basal ganglia. B, Coronal PCD image at the same level as A shows lower image noise for the PCD image. Zoomed-in EID (C) and PCD (D) images at the same level. C indicates caudate; I, internal capsule; L, lentiform nucleus.
Quantitative Image Analysis
Attenuation measurements for basal ganglia GM, internal capsule WM, and lateral ventricle CSF were similar for the EID and PCD CT systems (Table 2). Image noise in GM, WM, and CSF was 12.8%–20.6% lower for PCD than for EID images (GM noise, 3.2 ± 0.5 HU for PCD versus 3.9 ± 1.0 HU for EID; WM, 2.7 ± 0.7 HU for PCD versus 3.4 ± 0.8 HU for EID; lateral ventricle CSF, 3.4 ± 0.7 for PCD versus 3.9 ± 0.8, for EID; all, P < .01). GM and WM SNR improvement of PCD CT versus EID CT was 19.0% and 20.0%, respectively. GM–WM contrast was 15.7% higher for PCD CT versus EID CT (10.3 ± 1.9 versus 8.9 ± 1.8 HU, respectively, P = .02) and GM–WM CNR was 33.3% higher (2.4 ± 0.8 versus 1.8 ± 0.5, respectively, P < .001). Quantitative quality indices are summarized in Table 3.
Mean attenuation value and SD of ROIs in energy-integrating detector and photon-counting detector CT images in human subjects
Image-quality comparison between energy-integrating detector and photon-counting detector CT for gray matter, white matter, and CSF
Spectral Analysis
We compared attenuation values and image-quality metrics between low- and high-energy bin images in the same ROIs (Table 4). The image noise for the low- and high-energy PCD bins for WM was 5.0 ± 1.6 and 3.9 ± 0.7 HU, respectively. Because each bin contained only a portion of the detected photons, the noise for each bin was higher than that of the PCD image (2.7 ± 0.7 HU) containing all detected photons. However, GM–WM contrast was significantly better for the low-energy bin images versus high-energy bin images (10.6 ± 2.3 versus 8.8 ± 2.5 HU, respectively, P = .02). GM and WM SNR and GM–WM CNR between the low- and high-energy bin images were not significantly different (Fig 5).
Attenuation values and image-quality comparison between photon-counting detector low-energy and high-energy bin images for gray matter, white matter, and CSF

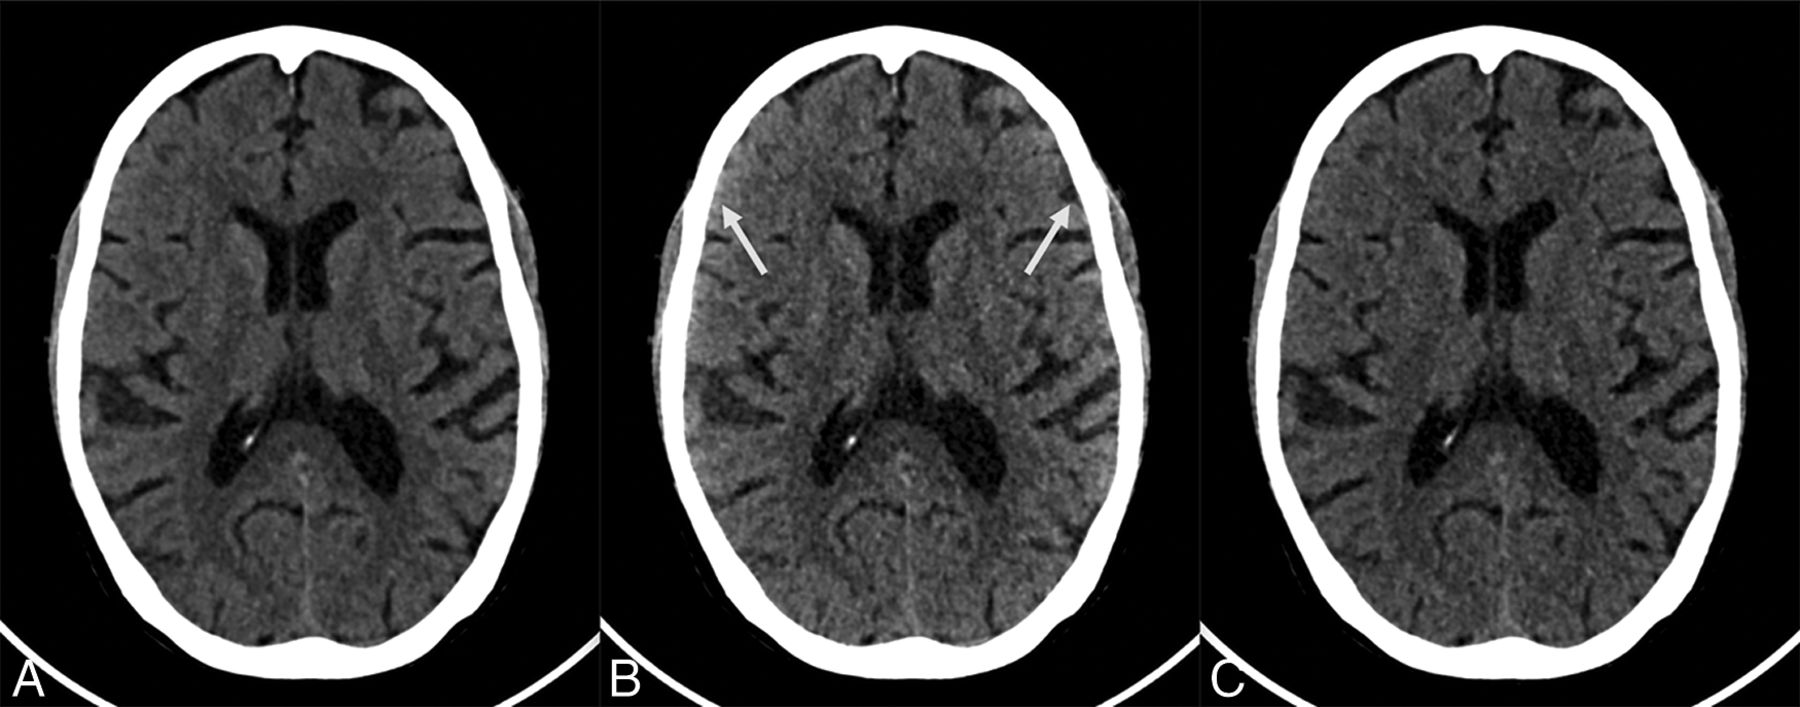
Sample photon-counting detector images of low- and high-energy bins of a 70-year-old woman (section thickness, 2 mm; increment, 2 mm; window center, 45 HU; window width, 80 HU). A, Axial PCD image reconstructed from all detected photons (22–120 keV) at the level of the basal ganglia. B, Axial PCD image reconstructed from a low-energy bin image (22–52 keV) at the same level as A. C, Axial PCD image reconstructed from the high-energy bin image (52–120 keV) at the same level as A. The image noise for both the low- and high-energy bins is higher than that of the PCD image reconstructed from all detected photons because each bin contains only a subset of all detected photons. The low-energy bins provide good gray matter–white matter differentiation but are susceptible to beam-hardening, best seen as an artifactual increase in attenuation of the cortical GM and the subarachnoid space (arrows in B). The high-energy photons are less susceptible to beam-hardening but have poorer GM–WM differentiation. The image reconstructed from all photons is a trade-off between the good GM–WM differentiation of the low-energy image and the lower beam-hardening artifacts of the high-energy images.
Discussion
Photon-counting CT is a new development in CT scanning in which fully digital detectors replace crystals that emit light and photodetectors. In this study, objective measures of image quality showed that improvement ratios of PCD CT compared with EID were 12.8%–20.6% for image noise, 19.0%–20.0% for SNR, 15.7% for GM–WM contrast, and 33.3% for GM–WM CNR. These improvements in image quality were detected by experienced neuroradiologists blinded to the type of CT scan (conventional versus photon-counting CT). Neuroradiologists identified better GM–WM differentiation and less image noise on PCD images. These initial, in vivo human results for a prototype photon-counting CT suggest a high potential for PCD CT to improve image quality for brain CT compared with conventional detector CT. Alternatively, the lower image noise of the PCD CT system could translate to reduced radiation dose (approximately 40%) at similar quality levels of current brain CT.24 Our results show that better GM–WM differentiation (CNR) with PCD versus EID CT is due to both higher GM–WM contrast and lower image noise. The improved contrast can be attributed to the better weighting of low-energy photons, which produce more contrast among soft tissues. The lower image noise in PCD was more visible in the mid-to-high frequencies of the noise-power spectrum.
Improved image quality and better gray–white matter contrast with PCD CT may be very relevant to interpretation of brain CT examinations. For example, early CT recognition of acute (1–3 hours) stroke relies on detection of subtle GM hypoattenuation changes such as obscuration of the lentiform nucleus or the insular ribbon sign due to cytotoxic edema.25 Detection of subtle attenuation differences also plays an important role in the diagnosis of other intracranial conditions such as hemorrhage, demyelinating diseases, and masses.26⇓–28 However, dedicated future studies are warranted to assess the potential impact of PCD technology on the diagnostic accuracy of brain CT.
Besides improved overall image quality for photon-counting CT of the brain, spectral imaging is inherent with this new type of CT detector. Similar to dual-energy CT, PCDs can use the attenuation measurements acquired with different energy spectra to differentiate materials.29 Material classification has mostly been examined in contrast-enhanced CT but may also play an important role in noncontrast brain CT (eg, differentiation between hemorrhage and calcification).30 Image analysis of the energy bins confirmed better GM–WM contrast for the low-energy images compared with the high-energy images; however, the low-energy images were more susceptible to beam-hardening artifacts. The PCD images reconstructed from all detected photons combined the good GM–WM differentiation of the low-energy image with the lower beam-hardening artifacts of the high-energy images. Further studies in patients with intracranial pathology are be needed to determine whether PCD CT may result in improved perception of brain abnormalities.
Although PCDs are already being used in nuclear medicine and mammography, the high x-ray photon flux required for body CT imaging has been a major challenge for photon-counting technology until recently. When incident x-ray photons are too close in time to be counted separately by the PCDs at high x-ray photon flux, multiple photons are counted as 1 photon. This phenomenon is known as “pulse pileup” and negatively affects image quality, Hounsfield unit accuracy, and material decomposition.8 However, recent advances in PCD technology with high-speed application-specific integrated circuits and small pixel sizes have led to the development of PCDs resistant to pulse pileup at clinically routine CT tube currents.15 Another PCD artifact is charge sharing, which occurs when the energy of an x-ray photon is distributed across multiple adjacent detector pixels, reducing the accuracy of the detected photon energy.8 Multiple anti-charge-sharing techniques are currently being developed to limit this artifact.31,32
There are several limitations of this study. Unlike the EID system, the current implementation of the PCD prototype does not support z-flying focal spot technology. This feature resulted in increased PCD streaking artifacts, especially in the infratentorial region (eg, the posterior fossa). However, these are not a limitation of photon-counting technology but rather of the prototype implementation. Second, radiation dose–saving technologies such as tube-current modulation and model-based iterative reconstruction were not available for the PCD system; therefore, the performance of PCD could not be assessed under these conditions. Finally, experienced neuroradiologists blinded to detector type preferred the PCD image quality to that of EID CT. However, further studies are needed to determine whether this preference would translate to clinically meaningful differences for brain lesion detection. On the other hand, it appears likely that the lower image noise for PCD could be used to reduce the radiation dose while providing “always on” spectral x-ray information.
Conclusions
Qualitative and quantitative analyses of human brain PCD CT scans demonstrated better GM–WM differentiation than conventional EID CT, due to higher soft-tissue contrast and lower image noise of photon-counting detectors.
Acknowledgments
The authors wish to thank Drs Bernhard Krauss and Bernhard Schmidt for their insightful discussions regarding the behavior of noise and artifacts in PCDs and Drs. André Henning, Martin Sedlmair, Rainer Raupach, and Friederike Schöck from Siemens for many helpful discussions and for building and maintaining the prototype scanner.
Footnotes
A. Pourmorteza and R. Symons contributed equally to this work.
Disclosures: Amir Pourmorteza—RELATED: Grant: National Institutes of Health intramural research program, Comments: ZIACL090019, ZIAEB000072, ZIANS003119*; Support for Travel to Meetings for the Study or Other Purposes: National Institutes of Health–Siemens Collaborative research and development agreement*; UNRELATED: Payment for Lectures Including Service on Speakers Bureaus: Delaware Valley Chapter of American Association for Physicists in Medicine, Comments: received honorarium for a Continuing Medical Association lecture on photon-counting CT at the Delaware Valley Chapter of the American Association of Physicists in Medicine meeting in 2017*; Travel/Accommodations/Meeting Expenses Unrelated to Activities Listed: Delaware Valley Chapter of American Association for Physicists in Medicine. Rolf Symons—OTHER RELATIONSHIPS: institutional collaborative research agreement with Siemens. Mohammadhadi Bagheri—OTHER RELATIONSHIPS: institutional collaborative research agreement with Siemens. Stefan Ulzheimer—UNRELATED: Employment: Siemens. David A. Bluemke—OTHER RELATIONSHIPS: research agreement with Siemens, nonfinancial. *Money paid to the institution.
This study was supported by the National Institutes of Health intramural research program (ZIACL090019; ZIAEB000072; ZIANS003119) and a collaborative research agreement with Siemens (Erlangen, Germany).
Data inclusion and analysis were performed by authors, who are not employees of or consultants for Siemens.
Indicates open access to non-subscribers at www.ajnr.org
References
- Received June 19, 2017.
- Accepted after revision July 20, 2017.
- © 2017 by American Journal of Neuroradiology


Jump to section
Related Articles
Cited By...
- Neurovascular Imaging with Ultra-High-Resolution Photon-Counting CT: Preliminary Findings on Image-Quality Evaluation
- Comparison of Image Quality and Radiation Dose in Pediatric Temporal Bone CT Using Photon-Counting Detector CT and Energy-Integrating Detector CT
- CMR and CT of the Patient With Cardiac Devices: Safety, Efficacy, and Optimization Strategies
- Comparison of a Photon-Counting-Detector CT with an Energy-Integrating-Detector CT for Temporal Bone Imaging: A Cadaveric Study