
Abstract
BACKGROUND AND PURPOSE: Polyglutamine expansion spinocerebellar ataxias are autosomal dominant slowly progressive neurodegenerative diseases with no current treatment. MR imaging is the best-studied surrogate biomarker candidate for polyglutamine expansion spinocerebellar ataxias, though with conflicting results. We aimed to review quantitative central nervous system MR imaging technique findings in patients with polyglutamine expansion spinocerebellar ataxias and correlations with well-established clinical and molecular disease markers.
MATERIALS AND METHODS: We searched MEDLINE, LILACS, and Cochrane data bases of clinical trials between January 1995 and January 2016, for quantitative MR imaging volumetric approaches, MR spectroscopy, diffusion tensor imaging, or other quantitative techniques, comparing patients with polyglutamine expansion spinocerebellar ataxias (SCAs) with controls. Pertinent details for each study regarding participants, imaging methods, and results were extracted.
RESULTS: After reviewing the 706 results, 18 studies were suitable for inclusion: 2 studies in SCA1, 1 in SCA2, 15 in SCA3, 1 in SCA7, 1 in SCA1 and SCA6 presymptomatic carriers, and none in SCA17 and dentatorubropallidoluysian atrophy. Cerebellar hemispheres and vermis, whole brain stem, midbrain, pons, medulla oblongata, cervical spine, striatum, and thalamus presented significant atrophy in SCA3. The caudate, putamen and whole brain stem presented similar sensitivity to change compared with ataxia scales after 2 years of follow-up in a single prospective study in SCA3. MR spectroscopy and DTI showed abnormalities only in cross-sectional studies in SCA3. Results from single studies in other polyglutamine expansion spinocerebellar ataxias should be replicated in different cohorts.
CONCLUSIONS: Additional cross-sectional and prospective volumetric analysis, MR spectroscopy, and DTI studies are necessary in polyglutamine expansion spinocerebellar ataxias. The properties of preclinical disease biomarkers (presymptomatic) of MR imaging should be targeted in future studies.
ABBREVIATIONS:
- AD
- axial diffusivity
- CAG
- cytosine-adenine-guanine
- CAGexp
- CAG repeat length on the expanded allele
- DRPLA
- dentatorubropallidoluysian atrophy
- FA
- fractional anisotropy
- Glu
- glutamate
- ICARS
- International Cooperative Ataxia Rating Scale
- MJD
- Machado-Joseph disease
- PolyQ
- polyglutamine repeats
- RD
- radial diffusivity
- SARA
- Scale for the Assessment and Rating of Ataxia
- SCA
- spinocerebellar ataxia
- SRM
- standardized response mean
- VBM
- voxel-based morphometry
Spinocerebellar ataxias (SCAs) are autosomal dominant disorders clinically characterized by symptoms resulting from cerebellum and cerebellar interconnection neurodegeneration. SCA due to expansions of coding cytosine-adenine-guanine (CAG) repeats (PolyQ) such as SCA1, SCA2, SCA3/Machado-Joseph disease (MJD), SCA6, SCA7, SCA17, and dentatorubropallidoluysian atrophy (DRPLA) are the most frequent forms.1,2 Similar to other PolyQ diseases, these disorders manifest above a threshold of CAG repeats that varies depending on the gene.1
Ataxia is often accompanied by extracerebellar findings, such as pyramidal and extrapyramidal signs, oculomotor abnormalities, and peripheral neuropathy.1,3 Sleep, cognitive, and psychiatric symptoms are also frequent in PolyQ-SCA, possibly due to a more widespread CNS degeneration.4,5
Natural history studies with well-validated SCA scales, such as the Scale for the Assessment and Rating of Ataxia (SARA)6 and the Neurologic Examination Score for Spinocerebellar Ataxia7 were concordant with both the very slow disease progression8⇓–10 and the necessity for large sample sizes to test disease-modifying therapies in future randomized clinical trials.8⇓⇓⇓⇓–13 Surrogate biomarkers could hasten randomized clinical trials and drug discoveries for SCA. The number of biomarkers evaluated so far is small, and neuroimaging, particularly MR imaging, is the best-evaluated candidate.14
Many studies evaluated brain MR imaging in SCA, some with conflicting results. Most evaluated a small number of patients with a high risk of bias. Although different methodologies were applied with multiple qualitative and quantitative approaches, it is still unknown which technique and which region is best-suited for a reliable biomarker for future randomized clinical trials in a given PolyQ-SCA. So far, no systematic review has been published on the subject, to our knowledge.
We aimed to perform a systematic review of the studies that evaluated central nervous system quantitative MR imaging techniques in patients with PolyQ-SCA, to assess the correlations of reported findings with well-established clinical and molecular disease markers and to evaluate the reported sensitivity to change of the findings, when available.
Materials and Methods
Search Criteria and Strategy
The objective and search strategy were established by using the Population, Intervention, Comparator, Outcome format. We searched MEDLINE, LILACS, and Cochrane data bases of clinical trials between January 1995 and January 10, 2016. We restricted the results to humans; no language restrictions were adopted. Population, Intervention, Comparator, Outcome–specific search terms regarding the population (“spinocerebellar ataxia,” “autosomal dominant cerebellar ataxia”) were combined with intervention-of-interest keywords (“MR imaging,” “NMR,” “spectroscopy,” “volumetry,” “morphometry,” “gray matter atrophy,” “regional atrophy,” “white matter atrophy,” “DTI,” “tractography,” “diffusion tensor”). After performing the search, we also performed manual citation review to ensure that all relevant studies were found. The review process followed the Preferred Reporting Items for Systematic Reviews and Meta-Analyses guidelines.15 For the complete search strategy, see the On-line Appendix.
Study Selection
To be included, a given study should meet at least 1 criterion from each of the following: 1) study design: systematic review, randomized clinical trial, cohort, case-control or case series; 2) population: symptomatic individuals with a molecular diagnosis of a PolyQ-SCA (SCA1, SCA2, SCA3/MJD, SCA6, SCA7, SCA17, and DRPLA) or asymptomatic carriers of PolyQ-SCA mutation; and 3) intervention: CNS MR imaging with ≥1.5T field; image processing by using volumetric analysis, MR spectroscopy, diffusion tensor imaging, tractography, or other MR imaging quantitative techniques. In addition, at least 1 of the following data points regarding the subjects, age, age at disease onset, CAG repeat length on the expanded allele (CAGexp), or scores obtained from a validated ataxia scale should be reported. We excluded studies with the following characteristics: 1) study design: case reports or reviews, other than systematic; 2) population: absence of a healthy control group or <20 individuals per group or representing <5 different families (when informed); and 3) intervention: qualitative CNS MR imaging analysis or neuroimaging studies other than MR imaging. Prospective studies with ≥15 individuals and studies on presymptomatic individuals with ≥10 subjects were accepted, though the conclusions of studies with <20 individuals per group were considered of limited value.
Data Extraction
Two independent reviewers performed the search (A.K., E.R.). Before performing data extraction, we established a consensus of eligible articles between reviewers and a separate assessor (J.A.M.S.). For data extraction, we considered author, year, country, study design and medical scenario, population, sample size, outcomes, MR imaging acquisition and postprocessing, MR imaging main findings, clinical molecular correlations, and study limitations. Comparisons of MR imaging findings among different SCAs, qualitative findings, and diagnostic properties of MR imaging for SCAs were not analyzed.
Results
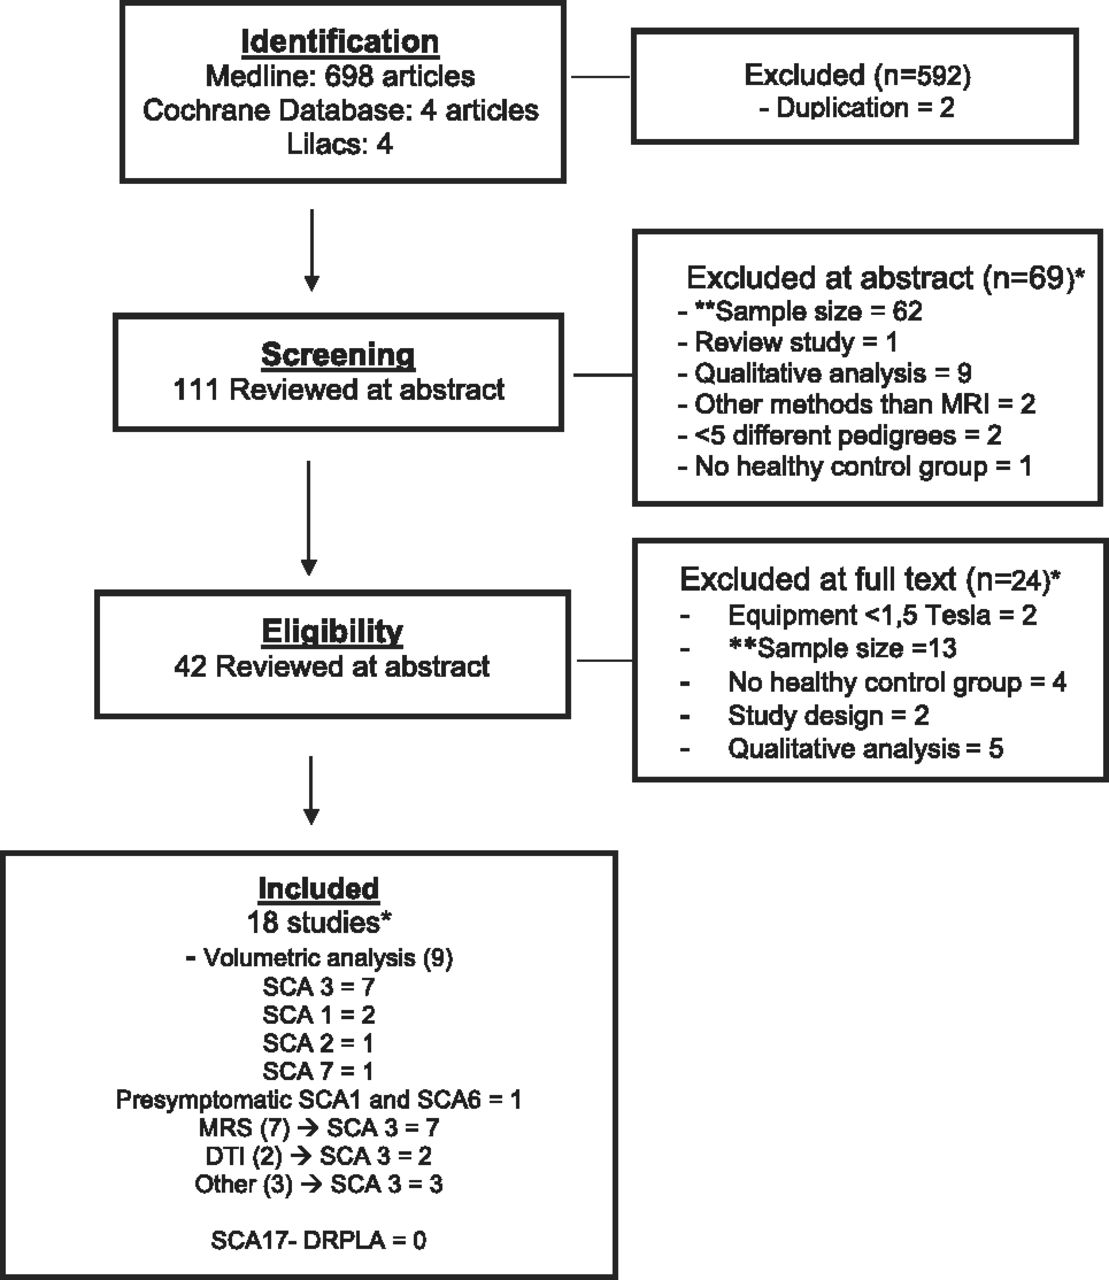
Seven hundred six articles were retrieved on the basis of the title/abstract data base search; 698 on MEDLINE, 4 on LILACS, and 4 at the Cochrane Library. Eighteen studies (case-control and prospective cohorts) were included for critical evidence evaluation based on our eligibility criteria. See Fig 1 for the study-selection procedures and the On-line Appendix for the complete search strategy.

Flow diagram outlining the selection procedure. The asterisk indicates that the total number of studies is lower than the sum of individual studies because some studies were excluded for ≥2 reasons and some studies evaluated >1 SCA subtype. Double asterisks indicate sample size exclusion criteria: <20 individuals per group for cross-sectional studies, <15 individuals for prospective studies, and <10 individuals per group for studies in presymptomatic individuals.
Study Characteristics and Risk of Bias within Studies
For main descriptive data of included studies, see On-line Tables 1–4.
Results of Individual Studies
Eighteen studies were selected for this review: 2 including SCA1, 1 including SCA2, 15 including SCA3/MJD, 1 including patients with SCA7, and 1 study including presymptomatic carriers of SCA1 and SCA6 mutations. No eligible studies were found for SCA17 and DRPLA. On-line Table 1 summarizes the results of volumetric analysis, spectroscopy, DTI, and other methods for infratentorial regions, and On-line Table 2 gives the results for supratentorial regions. Although we found significant bias in most studies (selection and measurement bias being the most frequent), in general these findings did not limit the overall results, considering the relative consistency of findings across studies (On-line Tables 3–6).
Only 2 studies evaluated prospectively MR imaging changes in patients with SCA.16,17 Both studies assessed volumetric analysis, and 1 of them assessed MR spectroscopy changes with time.16
Volumetric studies used voxel-based morphometry (VBM) and surface-based analysis. VBM analysis, implemented in different versions of the SPM software (SPM2, SPM5, and SPM8; tools; http://www.fil.ion.ucl.ac.uk/spm/software/spm8), varied among selected studies, which used ROIs or VOI analysis and/or whole-brain volume analysis with standardization maps. Seven studies used ROI or VOI16,18⇓⇓⇓⇓–23 analysis (2 with manual outlining), and 8 studies performed whole brain analysis (5 automated24⇓⇓⇓–28 and 3 semiautomated17,29,30 processing). One study performed both manual and automated morphometric measurement of the thalamus.31 Surface-based analysis with the FSL Toolbox (http://fsl.fmrib.ox.ac.uk/fsl/fslwiki/Randomise) and FreeSurfer (http://surfer.nmr.mgh.harvard.edu) were used in 2 articles. All spectroscopic studies were performed by using single-voxel protocols.
SCA1
MR Imaging Volumetric Studies.
A single study evaluated quantitative volumetric changes in SCA1, comprising 48 patients with SCA1, 24 patients with SCA3/MJD, and 32 controls in a multicenter study.29
Infratentorial Regions.
The authors reported gray matter volume loss in the cerebellar hemispheres, vermis, and whole brain stem and white matter loss in the whole brain stem, midbrain, pons, middle cerebellar peduncles, and cerebellar hemispheres on VBM analysis. Semiautomated volume analysis showed similar results with whole brain stem, pons, and medulla oblongata atrophy. Results of the SARA and Unified Huntington's Disease Rating Scale, which both increase with disease severity, correlated inversely with whole brain stem (R = −0.447, P < .001; R = −0.376, P < .01, respectively) and pons volumes (R = −0.531, P < .001; R = −0.438, P < .001; respectively).29
Supratentorial Structures.
Gray matter volume losses were found in the caudate nucleus and temporal lobes on VBM and in the putamen on semiautomated analysis. No significant correlations of supratentorial volumes with clinical or molecular data were reported.29
Prospective Studies.
Reetz et al17 prospectively evaluated 37 patients with SCA1 and 19 with SCA3/MJD during approximately 2 years. On VBM analysis, patients with SCA1 showed significant decline in gray matter in the whole brain stem, left anterior and posterior cerebellum, and the right putamen and pallidum. The length of the expanded CAG repeat allele correlated with cerebellum (R = −0.48, P < .005) and pons (R = −0.47, P < .005) volume loss in SCA1.17 On semiautomated analysis, significant atrophy progression was found in the whole brain stem, pons, putamen, left caudate, and left cerebellar hemisphere. The length of the expanded CAG repeat allele correlated with left (R = −0.370, P < .05) and right (R = 0.380, P < .05) cerebellum volume loss. When we compared patients with SCA1 and SCA3/MJD regarding CNS atrophy progression, SCA1 showed an increased rate of volume loss in the whole brain stem, left cerebellar hemisphere, and putamen.17
Presymptomatic Individuals.
A single study evaluated MR imaging volumetric analysis in presymptomatic individuals, the Ataxia Study Group study of individuals at Risk for SCA1, SCA2, SCA3, SCA6, SCA7 (RISCA).30 This was a multicenter observational European study, in which 50 presymptomatic individual carriers of a PolyQ-SCA mutation and 33 noncarrier controls underwent MR imaging in 8 centers. Carriers and noncarriers were grouped for evaluation in 26 carriers and 13 noncarriers for SCA1 mutations, 4 carriers and 8 noncarriers for SCA2 mutations, 9 carriers and 6 noncarriers for SCA3/MJD mutations, and 11 carriers and 6 noncarriers for SCA6 mutations. According to our criteria, only SCA1 and SCA6 data (pooled controls) were reviewed.
The mean estimated time from onset for SCA1 carriers was −11 years (−14 to −8), the mean age was 26 years, and 23 (88%) were women. The VBM results showed gray matter loss in the medulla oblongata extending to the pons and in lobule IX of the cerebellum in SCA1 carriers. On semiautomated analysis, no differences were seen between carriers and noncarriers, even when pooling the noncarrier individuals in a common control group (n = 33). The MR imaging volumes did not correlate with time from onset in any genotype.30
SCA2
MR Imaging Volumetric Studies.
A single study evaluated quantitative volumetric changes in 20 patients with SCA2 and 20 healthy matched controls.18
Infratentorial and Supratentorial Regions.
The authors reported symmetric gray matter volume loss in the cerebellar vermis and hemispheres, with sparing of vermian lobules I, II, and X and of hemispheric lobules I, II, and crus II, on VBM analysis. White matter volume loss was depicted in the peridentate regions, middle cerebellar peduncles, dorsal portion of the pons, and the superficial portion of the cerebral peduncles.18 International Cooperative Ataxia Rating Scale (ICARS) correlated inversely with average cerebellar gray matter volume (R = −0.53) and average white matter volume of the peridentate regions, middle cerebellar peduncles, dorsal pons, and cerebral peduncles (R = −0.54), and it correlated directly with CSF volume in the posterior cranial fossa (R = 0.45). The P values for correlation analysis were not given. No gray or white matter volume losses were observed in the cerebral hemispheres of patients with SCA2.
SCA3/MJD
MR Imaging Volumetric Studies.
Six studies evaluated volumetric changes in patients with SCA3/MJD and control individuals, 4 with VBM, 1 with FreeSurfer analysis,16,29,30,32,33 and 3 with semiautomated analysis,29,31,34 comprising a total of 246 patients with SCA3/MJD evaluated. Five of the 6 cross-sectional studies were performed by the same group in a single center in Brazil.16,31⇓⇓–34
Infratentorial Structures.
All 4 studies that analyzed cerebellar volume with VBM and FreeSurfer found significant atrophy for the total cerebellum or cerebellar hemispheres16,29,32,33; 3 studies also reported vermian atrophy.16,29,33 One study reported dentate nucleus atrophy,33 while another study reported no differences in this region.29 Two studies reported cerebellar peduncle atrophy.29,33 Four studies reported whole brain stem atrophy,16,29,32,33and 3 studies, pontine atrophy.16,32,33 Two studies reported midbrain16,29 and medulla oblongata atrophy,16,33 while 1 study found no differences for midbrain33 and 1, for medulla oblongata volumes.29
Semiautomated volume analysis from a single study29 showed results similar to those of the overall VBM analysis with atrophy in the total cerebellum, cerebellar hemispheres and vermis, whole brain stem, midbrain, pons, and medulla oblongata.
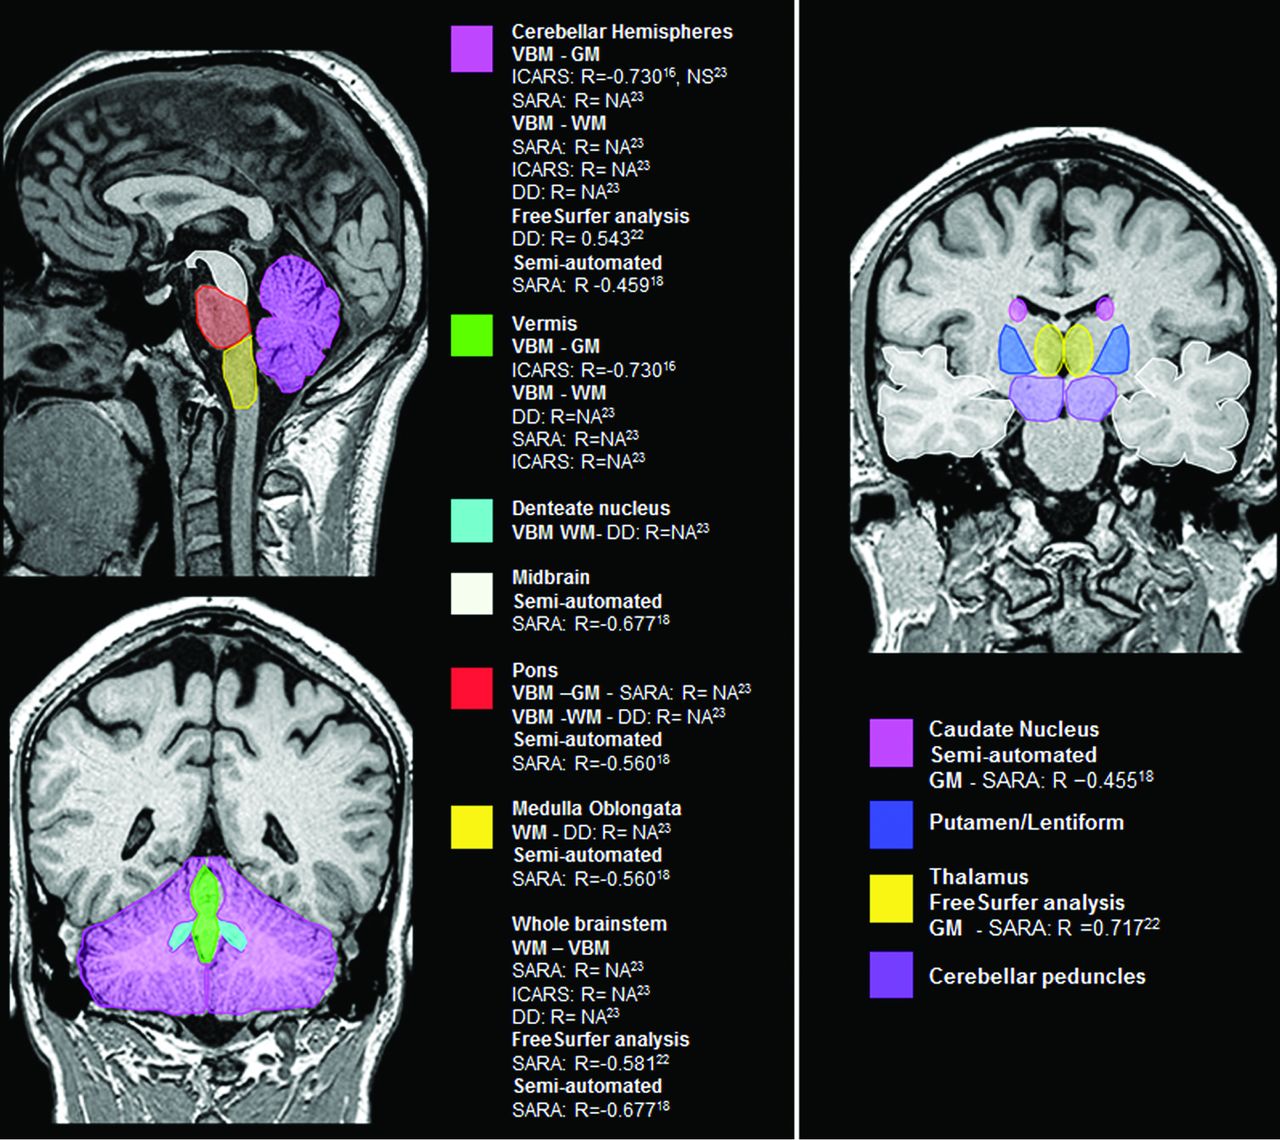
Both cerebellar and brain stem structures presented significant correlation with SARA,29,32,33 ICARS,16,33 disease duration,32,33 and CAG repeat expansions length (On-line Table 1 and Fig 2).16

Main encephalic regions with volume loss and its clinical and molecular correlations in SCA3/MJD. DD indicates disease duration; NA, not available; NS, not significant.
A single study evaluated semiautomated cervical spine volumetric analysis and found significant atrophy in SCA3/MJD, which correlated with longer disease duration.34
Supratentorial Regions: Subcortical Nuclei.
Regarding automated gray matter analysis, 2 studies found caudate nucleus and putamen, internal globus pallidum, or lentiform atrophy in SCA3/MJD,16,32 while 1 study found no differences.29 Three studies found thalamic atrophy,16,31,32 while a single study did not.29 One of these studies reported a significant inverse correlation of left thalamus volume with SARA,32 while the other 3 studies reported no significant correlations with clinical or molecular data.16,29,31 Regarding semiautomated volumetric analysis, a single study found caudate and putamen atrophy, with an inverse correlation of caudate atrophy with SARA scores,29 and a single study found thalamic atrophy, with no significant correlations with clinical or molecular data (On-line Table 1 and Fig 2).31
Supratentorial Regions: Cerebral Hemispheres.
Three cross-sectional studies evaluated cerebral hemispheres with VBM and cortical thickness.16,29,32 Two studies found significant atrophy of the temporal, frontal, parietal, occipital, and/or limbic lobes/gyri. Two studies found significant correlation of some of these regions with disease duration,16,32 one with SARA32 and the other with ICARS.16 One study reported significant correlation of these regions with CAG repeat expansions length,16 while the other 2 did not.29,32 Regarding semiautomated volumetric analysis, a single study found temporal lobe atrophy in SCA3/MJD without significant correlations with clinical and molecular features (On-line Table 1).29
Prospective Studies.
In the study by Reetz et al,17 the main effect in gray matter changes on VBM after 2 years of follow-up in the SCA3/MJD group (n = 19) was restricted to the bilateral putamen and pallidum. Thirty patients with SCA3/MJD were also prospectively assessed in a Brazilian study.16 No losses of gray matter and white matter densities on VBM analysis were seen after 12.5 months.16 On semiautomated volumetric analysis, Reetz et al17 found significant atrophy progression in the whole brain stem, pons, putamen, and left caudate in SCA3/MJD, with no correlations with CAGexp.
MR Spectroscopy.
All 6 included MR spectroscopy studies evaluated only patients with SCA3/MJD, comprising 235 individuals.19⇓⇓–22,25,26 Many of the studies evaluated different ROIs, which made it difficult to pool data.
Infratentorial Structures.
Five studies evaluated MR spectroscopy of infratentorial regions in SCA3/MJD10⇓⇓⇓⇓⇓⇓⇓⇓⇓⇓⇓–22; all of them evaluated cerebellar structures, and only 1 evaluated the brain stem (see On-line Table 1 for the main findings).19
The N-acetylaspartate/creatine ratio was evaluated in 4 studies with ROIs in the cerebellar hemispheres/cortex,20⇓–22 all with reduced NAA/Cr ratios; 2 of them had inverse correlations with SARA scores.21,22 NAA/Cr ratio with ROIs in the cerebellar vermis was evaluated in 3 studies, all with reduced ratios,20⇓–22 2 of them with inverse correlations with SARA scores.21,22 NAA/Cr ratio with ROI in dentate nucleus and cerebellar peduncles was evaluated in a single study. Both regions showed reduced NAA/Cr ratio with a direct correlation with SARA scores for both regions, a direct correlation with disease duration in the dentate nucleus, and an inverse correlation with age at onset in the cerebellar peduncles.20 A single study evaluated the NAA + N-acetyl-aspartylglutamate/total Cr ratio in the left cerebellar white matter of patients with SCA3/MJD and found reduced ratios.26 Reduced NAA levels in the cerebellar vermis and pons, with a strong inverse correlation between SARA scores and NAA levels in the pons, were reported in a single study.19 Two studies evaluated the NAA/choline ratio20,21; NAA/Cho ratio was reduced in the cerebellar vermis in both studies, but one reported a direct20 and the other an inverse correlation21 with SARA. One study found reduced NAA/Cho ratio in the cerebellar hemispheres, with an inverse correlation with SARA scores and a direct correlation with disease duration,21 while the other found no differences.20 No differences of NAA/Cho ratio were found in the dentate nucleus.20
Two studies evaluated the Cho/Cr ratio20,22; one study discovered a NAA/Cho ratio reduction in the cerebellar vermis, with no significant clinical or molecular correlations22 and the other found no differences for the cerebellar vermis, cortex, dentate nucleus, or cerebellar peduncles.20 One study evaluated the glutamate (Glu)/total Cr ratio in the left cerebellar white matter and found reductions in SCA3/MJD, but with no correlations with motor clinical or molecular data.26 One study evaluated MR spectroscopy Glu levels and found reductions in the cerebellar vermis and pons, with no significant clinical or molecular correlations.19 MR spectroscopy Cr and myo-inositol levels were both increased in the cerebellar vermis and pons of patients with SCA3/MJD in a single study, with a direct correlation of myo-inositol with SARA in the pons.18 Other metabolites were assessed in the same study, with no differences from controls.19
Supratentorial Structures.
A single study evaluated MR spectroscopy in the corpus callosum and found reduced NAA/Cr ratio and normal Cho/Cr ratios in patients with SCA3/MJD, with no significant clinical or molecular correlations.25
Prospective Studies.
D'Abreu et al16 assessed MR spectroscopy in 19 patients with SCA3/MJD after 12.5 months. No difference in the NAA/Cr ratio in the superior posterior region of the left hemisphere was found.
Diffusion Tensor Imaging.
Only 1 study evaluated DTI in SCA3/MJD, comprising 38 patients.24 We excluded the DTI data in the study by Lopes et al26 after contacting the study authors, because there was an overlap of patients and findings with the study by Guimarães et al.24 This study reported reduced fractional anisotropy (FA) in the bilateral cerebellum, including the dentate and other nuclei and cerebellar peduncles, and in the brain stem, including the midbrain and pons. Increased axial diffusivity (AD) and radial diffusivity (RD) were seen in different cerebellar and brain stem regions, while mean diffusivity did not differ from that in controls. AD also increased in the thalamus, and RD increased in the thalamus, frontal and parietal lobes, and corpus callosum. The only significant correlation of DTI parameters with FA was in the pons, with disease duration a direct correlation.24
Other Quantitative MR Imaging Evaluations.
Three studies evaluated other quantitative MR imaging methods: relaxometry24 (38 patients with SCA/MJD), perfusion23 (22 symptomatic patients and 16 presymptomatic SCA3/MJD mutation carriers), and fractal dimension analysis27 (48 patients with SCA3/MJD). Only MR imaging fractal analysis of the cerebellum and cerebral regions showed significant correlations with disease duration and SARA (See On-line-Table 6 for detailed results for other method studies).27
SCA6
MR Imaging Volumetric Studies: Presymptomatic Individuals.
RISCA was the only study included that evaluated individuals with SCA6.30 Eleven presymptomatic SCA6 carriers (6 women), with a mean estimated time from onset of −20 years (−23 to −16) (mean age, 46 years), were studied. VBM and semiautomated analysis results showed no differences between SCA6 mutation carriers and noncarriers.
SCA7
MR Imaging Volumetric Studies.
A single study evaluated quantitative semiautomated volumetric changes in 24 patients with SCA7 and age-matched controls.28
Infratentorial and Supratentorial Regions.
Hernandez-Castillo28 reported the largest volume losses in the right anterior cerebellum and left posterior cerebellum. Right anterior cerebellum culmen (R = −0.817, P < .05) and posterior tonsil (R = −0.740, P < .05), and left anterior cerebellum culmen (R = −0.759, P < .05) and posterior cerebellum semilunar (R = −0.640, P < .05) showed significant inverse correlations with SARA scores. No brain stem volume loss was reported.13 Gray matter atrophy was also seen in the cuneus, precuneus, pre/post central gyri, inferior frontal gyrus, and temporal lobes. Right (R = −0.742, P < .05) and left (R = −0.799, P < .05) precentral and inferior frontal gyri (R = −0.72, P < .05) volumes inversely correlated with SARA scores. No volume loss was reported for subcortical nuclei.28
Discussion
This is the first systematic review on quantitative MR imaging findings of PolyQ-SCA. Although the number of MR imaging studies published for these disorders in the past 10 years is quite large, the small sample sizes and qualitative analysis of the findings limited the validity of most study results. We adopted a critical evaluation approach,35 which aimed to include studies that met a predetermined threshold of quality, to define our eligibility criteria. Our most restrictive criterion was related to study sample size. A threshold of sample size was selected (exclusion criteria: <20 individuals per group for cross-sectional studies, <15 individuals for prospective studies, and <10 individuals per group for studies in presymptomatic individuals) because no sample size estimation with study power definition was provided in the studies found.
Recent studies in neuroimaging applied different techniques such as manual segmentation, voxel-based morphometry, spectroscopy, and DTI. In fact, most studies described in this review performed volumetric estimations and objective evaluations as in DTI or in spectroscopy. We will now discuss the current knowledge on MR imaging quantitative techniques for PolyQ-SCAs and potential areas for future research, considering these instruments as potential surrogate outcomes for future clinical trials.
MR Volumetric Analysis SCA1
When we consider the available data, whole brain stem, pons, putamen, caudate, and cerebellar hemisphere atrophy seem to be the best target regions as surrogate outcomes in SCA1.17,29 The standardized response mean (SRM = mean score change/SD of the score change; an effect size index used to enable the comparison among different instruments) of region-specific volume loss on MR imaging was similar or even larger than that of clinical scales. The 2-year SRM of volume loss was −1.6 for whole brain stem, −1.5 for the pons, −1.3 for the putamen, −1.2 for the caudate, and −0.7 for the cerebellum in SCA1, which are similar or even higher than the SRM of SARA, which was 1.2. Of note, SRM values of >0.8 are considered large changes with time.8,11,17
MR Volumetric Analysis, MR Spectroscopy, and DTI in SCA3/MJD
SCA3/MJD was by far the most studied PolyQ-SCA with MR imaging. SCA3/MJD studies generally presented larger sample sizes and lower risks of selection bias. Regarding volumetric studies, cerebellar hemispheres and vermis, whole brain stem, midbrain, pons, medulla oblongata, cervical spine, caudate and putamen nuclei, and thalamus seem to be the best target regions as surrogate outcomes in SCA3/MJD according to cross-sectional studies.16,29,24,32,33 In the study by Schulz et al,29 the stepwise inclusion of the pons and medulla oblongata together explained 53% of the variance in SARA in a linear regression model, and in another study, the cross-sectional area of the cervical spine explained 49.1% of SARA scores in a regression model built with disease duration and cerebellar volume.9 Some minor differences in the results across studies might be related to technical differences between semiautomated and automated analyses and differences between VBM and surface analysis (FreeSurfer).35⇓–37 Although several volumetric analyses have been published, the use of at least 3 technical approaches, the heterogeneity of comparisons with independent variables (CAGexp, disease duration, ataxia scales, and so forth), and the way data are presented in VBM studies prevented any data meta-analysis.
On a prospective study, the main gray matter changes in the SCA3/MJD group were in the whole brain stem, pons, putamen, and caudate.17 The 2-year SRMs of region-specific volume loss on MR imaging were −1.1 for the whole brain stem, −0.9 for the pons, −1.5 for the putamen, and −1.6 for the caudate in SCA3/MJD, which is similar or even higher than the 1.4 SRM of SARA.17 Another study did not find gray matter and white matter density losses on VBM analysis in 30 patients with SCA3/MJD after 12.5 months.16 This finding could be explained by both shorter follow-up and statistical differences regarding processing of VBM (an unbiased analysis, corrected for many different comparisons) and semiautomated volumetric analysis (fewer target regions), with semiautomated volumetric analysis apparently presenting greater study power for longitudinal studies.
A single prospective study evaluated MR spectroscopy with the ROI over the superior posterior region of the left hemisphere during 1 year and failed to show differences in metabolite ratios.16 It will be important to report the differences with time of structures and metabolites with relevant alterations on cross-sectional studies as NAA/Cr, NAA/Cho and Glu/Cr ratios, NAA, Glu, Cr, and myo-inositol levels of the cerebellar hemispheres/cortices, vermis, and pons.19⇓⇓–22
Given the available data, DTI may not yet be considered a potential surrogate biomarker for SCA3/MJD. Although differences in FA, AD, and RD were seen for the infratentorial and supratentorial regions, the significance in relation to well-known clinical and molecular parameters is not defined, with a possible relevance related to nonmotor findings of the disorder.24
Multimodal Approach in SCA3/MJD
None of the eligible studies directly compared the findings of different quantitative MR imaging modalities or tried to put together their information (structural and functional). The results of studies with volumetric analysis, MR spectroscopy, and DTI in SCA3/MJD found abnormalities in similar infratentorial regions (the cerebellum and brain stem). Comparison of data across MR imaging modalities was not possible for supratentorial regions because of the following: 1) the results of studies on volumetric analysis were heterogeneous, 2) only metabolites in the corpus callosum were evaluated with MR spectroscopy, and 3) DTI results were based on a single study.
Other PolyQ-SCAs
We reviewed single studies that performed MR imaging volumetric analysis in SCA2 and SCA7.18,24 Although infratentorial gray and white matter volume loss that correlated with ICARS scores were found for SCA218 and different cerebellar region and supratentorial structure (frontal, parietal, temporal, and occipital lobes) atrophies that correlated with SARA scores were found for SCA7,28 these results must be replicated by confirmatory cross-sectional studies, and the role of the discovered patterns of atrophy as disease surrogate biomarkers should be tested in prospective studies. Only a single study performed MR volumetric analysis in a small sample of presymptomatic individuals with SCA6 and showed no brain atrophy.30 Neither studies on symptomatic patients with SCA6, SCA17, and DRPLA nor studies with quantitative methods other than volumetric analysis, except for SCA3/MJD, were eligible.
Conclusions
There is a need for further cross-sectional MR imaging volumetric analysis, MR spectroscopy, and DTI studies for SCA1, SCA2, SCA6, SCA7, SCA17, and DRPLA to better define which techniques and regions are the best candidates for surrogate end points to be further tested in prospective studies. MR imaging fractal27 and multimodal approach analysis also deserves further study in PolyQ-SCA. These studies will probably need to be collaborative initiatives to obtain larger sample sizes that may allow an adequate interpretation and validity of findings.
Further prospective studies will be necessary for defining the best surrogate biomarker outcomes for all PolyQ-SCA. The only publication with promising results collected prospectively and published so far17 must be seen as a discovery study. The results need to be replicated by independent cohorts of patients with SCA1 and SCA3/MJD. Moreover, the scarcity of cross-sectional and prospective studies in presymptomatic individuals might explain the present lack of preclinical disease markers for PolyQ-SCA. For instance, in a recent clinical trial, creatine was given to presymptomatic at-risk individuals for Huntington disease,38 and the main trial efficacy outcomes were MR imaging cortical and striatum atrophy at 6 and 18 months after therapy. The authors found significant differences between groups, favoring creatine. Although the clinical relevance of the findings is still unknown, this study raises the possibility of including individuals presymptomatic for PolyQ disorders in clinical trials, irrespective of their carrier status, and of using MR imaging volumetric analysis as a surrogate end point of the disease process before the commencement of clinical manifestations. Such study design should be pursued for PolyQ-SCA in the future.
The study of supratentorial structures other than subcortical nuclei may have a more relevant and yet-not-well-explored relation with nonmotor and nonataxic motor manifestations of PolyQ-SCA and deserves further exploration. Other MR imaging methods, such as surface analysis techniques (such as FreeSurfer), have been shown to be more sensitive for evaluating supratentorial gray matter, especially for their ability to analyze the folds and surface compared with VBM.39,40
Footnotes
Disclosures: Laura Bannach Jardim—UNRELATED: Grants/Grants Pending: Pfizer Brazil, CNPq 478057/2012, FAPERGS 1209–2551/13–4, CNPq 402968/2012–3, CAPES 061–15, Comments: donation (Pfizer) to help maintain www.redeneurogenetica.ufrgs.br; Travel/Accommodations/Meeting Expenses Unrelated to Activities Listed: Machado-Joseph Disease Foundation, Australia, Comments: travel expenses to attend the International Machado-Joseph Disease Meeting, 2015.
A.K., E.R., L.M.V., L.B.J., and J.A.M.S. participated in the conception and design of the study. A.K., E.R., M.CF., T.J.R.R., and J.A.M.S. participated in research project execution. A.K., E.R., and J.A.M.S. contributed to the interpretation of data, and wrote the first draft. All authors reviewed the manuscript.
Full articles were obtained by CAPES and the Brazilian Ministry of Education publications portal (www.periodicos.capes.gov.br). E.R. was supported by CNPq. We received financial support from Fundo de Incentivo à Pesquisa e Eventos, Hospital de Clinicas de Porto Alegre.
References
- Received November 25, 2015.
- Accepted after revision January 22, 2016.
- © 2016 by American Journal of Neuroradiology


Jump to section
Related Articles
Cited By...
- Transcriptomic changes across subregions of the primate cerebellum support the evolution of uniquely human behaviors
- Antagonistic roles of canonical and alternative RPA in tandem CAG repeat diseases
- Association of serum neurofilament light and disease severity in patients with spinocerebellar ataxia type 3
- A novel Ataxin-3 knock-in mouse model mimics the human SCA3 disease phenotype including neuropathological, behavioral, and transcriptional abnormalities