
Abstract
BACKGROUND AND PURPOSE: Late infantile neuronal ceroid lipofuscinosis (CLN2 disease) is a uniformly fatal lysosomal storage disease resulting from mutations in the CLN2 gene. Our hypothesis was that regional analysis of cortical brain degeneration may identify brain regions that are affected earliest and most severely by the disease.
MATERIALS AND METHODS: Fifty-two high-resolution 3T MR imaging datasets were prospectively acquired on 38 subjects with CLN2. A retrospective cohort of 52 disease-free children served as a control population. The FreeSurfer software suite was used for calculation of cortical thickness.
RESULTS: An increased rate of global cortical thinning in CLN2 versus control subjects was the primary finding in this study. Three distinct patterns were observed across brain regions. In the first, subjects with CLN2 exhibited differing rates of cortical thinning versus age. This was true in 22 and 26 of 34 regions in the left and right hemispheres, respectively, and was also clearly discernable when considering brain lobes as a whole and Brodmann regions. The second pattern exhibited a difference in thickness from healthy controls but with no discernable change with age (9 left hemispheres, 5 right hemispheres). In the third pattern, there was no difference in either the rate of cortical thinning or the mean cortical thickness between groups (3 left hemispheres, 3 right hemispheres).
CONCLUSIONS: This study demonstrates that CLN2 causes differential rates of degeneration across the brain. Anatomic and functional regions that degenerate sooner and more severely than others compared with those in healthy controls may offer targets for directed therapies. The information gained may also provide neurobiologic insights regarding the mechanisms underlying disease progression.
ABBREVIATION:
- NCLs
- neuronal ceroid lipofuscinoses
The neuronal ceroid lipofuscinoses (NCLs) are the most common neurodegenerative diseases of childhood, affecting between 2 and 4 in 100,000 live births each year.1⇓⇓–4 NCLs are inherited, and to date, more than a dozen genes with >430 causative mutations have been identified. While defects in lysosomal storage are a central feature of NCLs, recently the pathobiology has been determined to be more complex.5,6 The present study focuses on the late infantile form of CLN2 disease (classic CLN2 disease), which is an autosomal recessive disorder caused by mutations in the CLN2 gene.7 CLN2 is a 6.65-kb 13 exon gene mapped to chromosomal locus 11p15, and mutations result in a lack of production of tripeptidyl peptidase-1, a 46-kDa enzyme required by lysosomes for cleavage of N-terminal tripeptides from substrates.8⇓–10 A deficiency of tripeptidyl peptidase-1 results in an accumulation of autofluorescent lipopigments in lysosomes known as lipofuscin.11 Retinal endothelial cells and CNS neurons are particularly sensitive to this buildup of undegraded proteins, resulting in cell death.1,12,13 Disease onset begins at ages 2–4, and widespread neurodegeneration results in seizures, cognitive impairment, blindness, and a loss of motor skills.14,15 CLN2 disease is progressive and universally fatal, with death generally occurring by ages 8–12.16
Our previous work characterized whole-brain degeneration in CLN2 disease by using a scoring system derived from 3 MR imaging techniques.17 Specifically, principal component analysis was used to combine the apparent diffusion coefficient, percentage of CSF, and N-acetylaspartate creatine ratio into a single MR imaging disease severity score. While this resulted in a robust and objective measure of disease severity in the whole brain, it did not assess regional variations in the rate of progression of the disease. For the present work, our hypothesis was that CLN2 disease may affect specific cortical regions of the brain earlier and more severely than others.
Brodmann18 used neurohistologic methods to outline regions of the cerebral cortex on the basis of their distinct cytoarchitecture in 1909. However, it is only within the past 10–15 years that high-resolution (1 mm3) isotropic T1-weighted 3T MR images with sharp contrast between gray and white matter have become available to noninvasively measure individual cortical thicknesses. The cerebral cortex that composes the gray matter is a folded sheet of neurons and glia measuring from 2 to 4 mm in thickness with up to 6 functionally distinct layers. The thicknesses of both the entire cortex and individual layers vary nonuniformly throughout the brain.
Previously, outlining cortical gyri and sulci on images derived from MR imaging scans required many hours of labor-intensive manual tracing and experience. The advent of more advanced computer technology combined with MR image analysis tools such as FreeSurfer (http://surfer.nmr.mgh.harvard.edu) now allows nearly automated processing of cortical thickness and volume measures of gray and white matter.19,20 These techniques have been used to study neurodegeneration in other disease states.21⇓⇓–24 Our hypothesis was that these morphometric techniques would yield information on the regional progression of CLN2 disease. While it is well-known that CLN2 induces global cortical atrophy, we focused on identifying regional changes in cortical thickness that exhibited differential rates of degeneration as a function of age and associated disease severity. To distinguish pathologic processes from normal brain maturation, we compared changes in subjects with CLN2 with a normative control population.
Materials and Methods
Study Population
This study was conducted under research protocols approved by the institutional review board at Weill Cornell Medical College. For subjects with CLN2 disease, both parents/guardians signed an informed consent for each subject. All were diagnosed both by disease phenotype and genetic analysis. Fifty-two MR imaging datasets were acquired from 38 subjects (2.5–8.4 years of age; median, 5.0 years; 13 males/25 females). Fourteen of these subjects were scanned at 2 time points as part of a separate therapeutic trial for CLN2, but all subjects were untreated at the time of the scans used for this study. All subjects were evaluated by 4 observers by using the Weill Cornell CLN2 Disease Severity Scale.15 The subjects' CLN2 scores (0–12 scale; 12 being unaffected) ranged from 1.5 to 11.0. To participate in this study, the subject's genotype included at least 1 of the 3 most common CLN2 mutations: C3670T (nonsense Arg207 to stop), G3556C (intron 7 splice), and G4655A (Cys365Tyr) (On-line Table 1). High-resolution T1-weighted imaging data were obtained retrospectively from a normative pediatric fMRI study provided by one of the authors (B.J.C.). For this healthy control group, 52 MR imaging datasets were acquired without anesthesia (4.8–12.0 years of age; median, 8.9 years; 24 males/28 females). Exclusion criteria stated that healthy subjects could not be born earlier than 36 weeks' gestational age or present with any diagnosis of neurologic or psychiatric disorders such as bipolar disorder, autism spectrum disorder, intellectual disability, or schizophrenia.
MR Imaging Techniques
All CLN2 imaging data were acquired by using a 3T HDx MR imaging system (GE Healthcare, Milwaukee, Wisconsin) with an 8-channel head resonator. A sagittal high-resolution isotropic 3D brain volume imaging gradient-echo pulse sequence was used to obtain optimal gray and white matter contrast. Isotropic 3D volumetric datasets were obtained at a spatial resolution of 1.0 × 1.0 × 1.0 mm with a 256 × 256 matrix, 160 sections, a TR of 12 ms, a TE of 5 ms, a TI of 450 ms, an acceleration factor of 2, a flip angle of 12°, and a bandwidth of 122 Hz/pixel. All imaging of subjects with CLN2 was performed with the patient under general anesthesia as prescribed by standard operating procedures within the Department of Anesthesiology at our institution.
A magnetization-prepared rapid acquisition of gradient echo pulse sequence was used for 16 of the control subjects who were scanned on a 3T HDx MR imaging system (GE Healthcare). A spatial resolution of 0.94 × 0.94 × 1.5 mm was achieved with a 256 × 192 matrix, 120 sections, TR/TE/TI of 8.3/1.7/725 ms, a flip angle of 7°, and a bandwidth of 122 Hz/pixel. An MPRAGE sequence was used for the remaining 36 control subjects by using a 12-channel head coil on a 3T Tim Trio MR imaging system (Siemens, Erlangen, Germany). A spatial resolution of 1.0 × 1.0 × 1.2 mm was used with a 256 × 256 matrix, 160 sections, and TR/TE/TI of 2170/4.3/1100 ms with an acceleration factor of 2, a flip angle of 7°, and a bandwidth of 140 Hz/pixel. Note that the Siemens TR represents the time between slab excitations, while the GE protocol calculates the TR as the time duration between acquisitions of individual lines in k-space. As a result, the effective TR under this protocol was 8.5 ms.
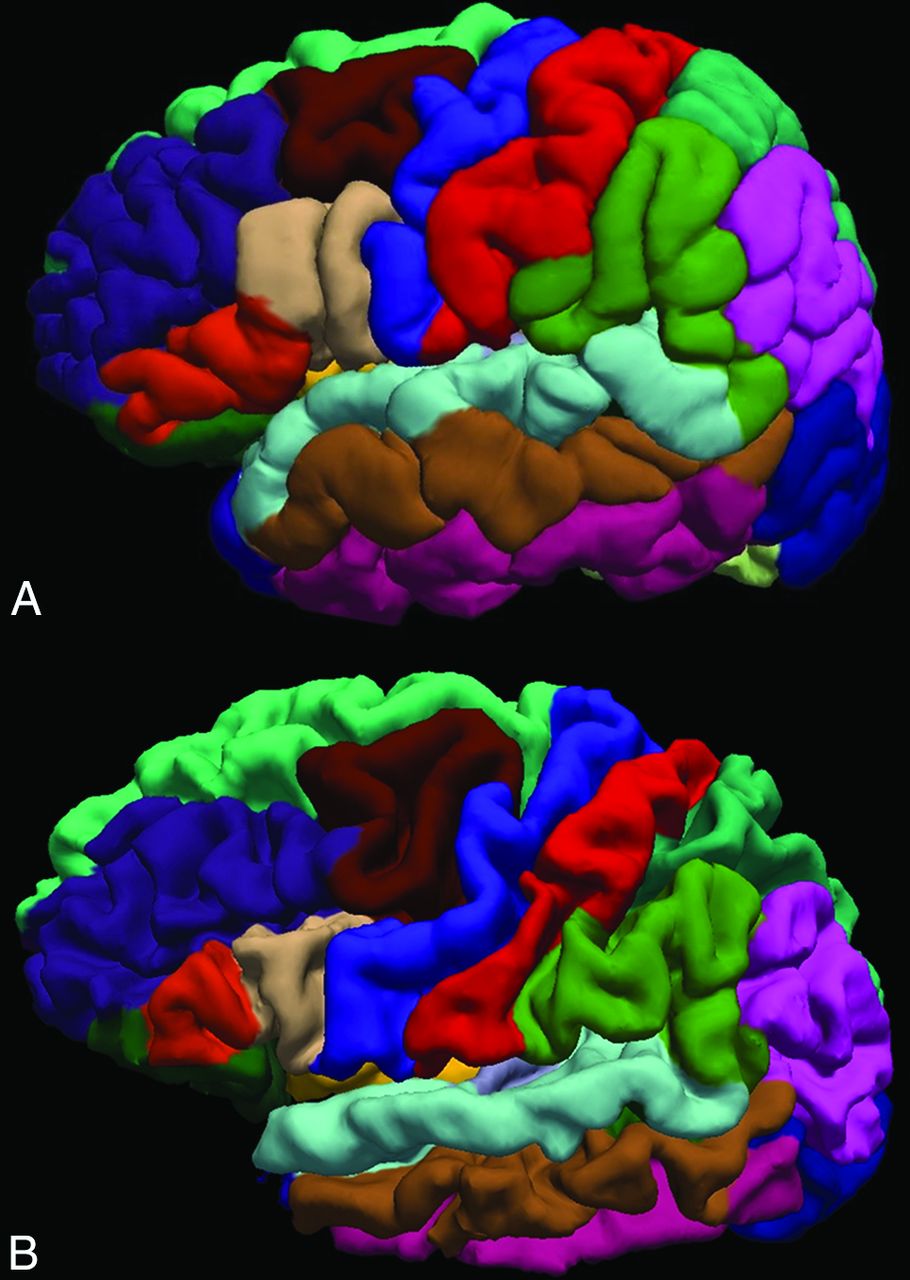
The FreeSurfer software package was used to generate semi-automated parcellation of cortical structures from the high-resolution T1-weighted MR imaging series. FreeSurfer removes nonbrain tissue, normalizes the image intensity, performs an automated Talairach transformation, and segments structures. It corrects topology and surface deformations and identifies the gray/white matter boundary. The location of the greatest shift in intensity defines the transition between distinct tissue classes.25 The skull stripping and cortical mapping were visually inspected for each subject by 2 authors (J.P.D., H.U.V.). Visualization of segmentation and cortical surface results was performed in multiple planes with output from the FreeSurfer QATools package (http://surfer.nmr.mgh.harvard.edu/fswiki/QATools). 3D surface renderings of cortical parcellations were also viewed to confirm correct labeling of the sulci and gyri (Fig 1). White matter control points were added, and the parcellation was rerun if white matter was underestimated in certain areas due to lower image intensity. Four CLN2 MR imaging scans displayed incorrect labeling of several cortical regions and were removed from analysis. FreeSurfer was run under a Linux environment with Version 20110522 (5.1.0) by using 8-CPU-cores. Thirty-three of 34 FreeSurfer-defined cortical regions were grouped into their respective cerebral lobes (frontal, n = 11; occipital, n = 4; parietal, n = 5; temporal, n = 9; cingulate gyrus, n = 4), according to their position in the Desikan-Killiany atlas (Table 1).26 The remaining insula region is part of several lobes.

Surface representation of the FreeSurfer-based cortical parcellation for a control subject (A, 6.1 years of age) compared with that of an age-matched subject with CLN2 (B, 5.9 years of age; clinical CLN2 score = 1.5). Note the atrophy as evidenced by deeper sulci and less prominent gyri in the subject with more advanced disease.
Cortical regions grouped by lobe as defined by the Desikan-Killiany atlas in FreeSurfer
Statistical Methods
Group means of cortical thickness were evaluated by using linear regression with adjustment for age as follows:
 where Y represents the cortical thickness, x1 is the subject age, and x2 is a dichotomous variable representing the subject group (0 = control, n = 52; 1 = CLN2, n = 48). In Equation 1, m2 represents the age-adjusted difference in the mean cortical thickness between the 2 groups. To account for any difference in the rates of decline in cortical thickness between the 2 groups, we added an interaction term:
 where the difference in the rate of decline is represented by m3. Subjects with CLN2 72 months and younger were used in estimating the slope or rate of cortical decline with time (42 MR imaging scans from 32 subjects). This estimation included a linear fit to the cortical thickness versus age before the data became asymptotic in advanced stages of disease. To take into account the correlated nature of 2 measurements on the same subjects, we used generalized estimating equations with robust variance estimation for confidence intervals and interaction P values.27 The time between measurements on the same subject varied across subjects. As such, a working independence correlation structure was used in conjunction with the robust variance estimate. Similarly, slopes across age for each group were estimated and compared by using generalized estimating equations with robust variance estimation. Multiple comparisons were addressed by using the Holm procedure within each of 7 groups of tests: global thickness of whole brain, lobes on the left and right sides each, subcortical substructures on the left and right sides each, and Brodmann areas on the left and right sides each.28 P < .05 of adjusted P values from the Holm procedure was considered statistically significant after adjustment for multiple comparisons. All analyses were conducted by using R statistical and computing software, Version 3.1.1 (http://www.r-project.org/).
Results
A 3D surface representation of the FreeSurfer-based cerebral cortical parcellations of a control subject (A, 6.1 years of age) compared with that of an age-matched subject with CLN2 (B, 5.9 years of age; clinical CLN2 score, 1.5) shows distinct differences in the structure of the gyri and sulci (Fig 1). A greater degree of cortical atrophy is apparent as the disease progresses, visualized by deeper sulci and less prominent gyri (compare A versus B). This impression was quantitatively validated by the significant differences in the decline of cortical thickness with age in CLN2 versus control groups of both the right and left hemispheres.
The change in cortical thickness with subject age for the whole brain showed a divergence between CLN2 (n = 48) and control (n = 52) groups [CLN2 slope = −0.018(5) mm/month; control slope = −0.002(1) mm/month, P < .001] (Fig 2A and Table 2), with the CLN2 group thinning at a much faster rate. These changes were seen in both the left (LH) and right (RH) hemispheres, respectively: LH/RH CLN2 slope = −0.016(5)/−0.020(6) mm/month versus control slope = −0.002(1) mm/month, P < .001. This same trend of rapid degeneration was also seen when plotting cortical thickness versus the clinical CLN2 score (Fig 2B and Table 2). Thus, while there are individual differences in the age of onset of the disease, cortical thinning proceeds relentlessly with disease progression. The mean cortical thickness was also significantly less (P < .001) in the whole brain and left and right hemispheres in the subjects with CLN2 compared with those in the healthy control population (Table 2).

The mean cerebral cortical gray matter thickness as a function of subject age (A) and clinical score (B) for CLN2 (solid diamond) and control (large filled square) groups. Subjects with CLN2 older than 72 months of age (open diamond) are not included in the linear fit.
The rate of decline (millimeters/month) and mean cortical thickness between CLN2 and healthy control populations in whole brain, hemispheres, and cerebral lobes
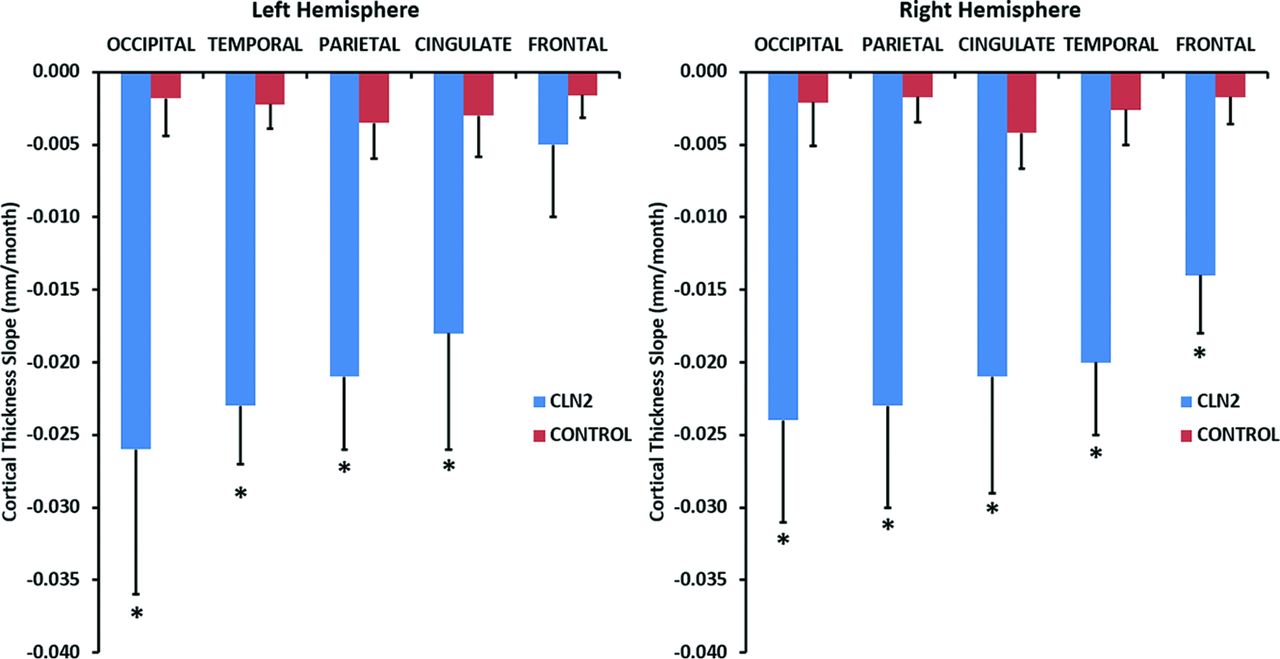
The cortical thickness was calculated for all regions (n = 34) separately and also was combined into specific Brodmann regions (n = 12) and cerebral lobes (n = 5) (Table 2 and On-line Tables 2–4). The mean thickness for each of the cerebral lobes was calculated as the average thickness of the regions composing that lobe. The rate of change of each of the 5 cerebral lobes of the left and right hemispheres was plotted versus age for the CLN2 (age, 72 months and younger) and control groups in Fig 3. Cortical degeneration was significantly faster in 9 of 10 lobes (4 left and 5 right hemispheres) in the CLN2 versus control groups (Fig 3 and Table 2). The occipital, temporal, parietal, and cingulate lobes degenerated faster in both hemispheres of the CLN2 population compared with their respective lobes in the control group. The frontal lobe exhibited the slowest rate of degeneration in CLN2 and did not differ from the control group in the left hemisphere. The mean cortical thickness was significantly decreased (P < .001) in all lobes in subjects with CLN2 in both hemispheres compared with the control population.

The rate of decline of cortical thickness with age for cerebral lobes in CLN2 (n = 42, blue) versus control (n = 52, red) groups. The 95% confidence interval of the slope is plotted as the error bar. Differences between CLN2 and control population of P < .05 are marked with an asterisk.
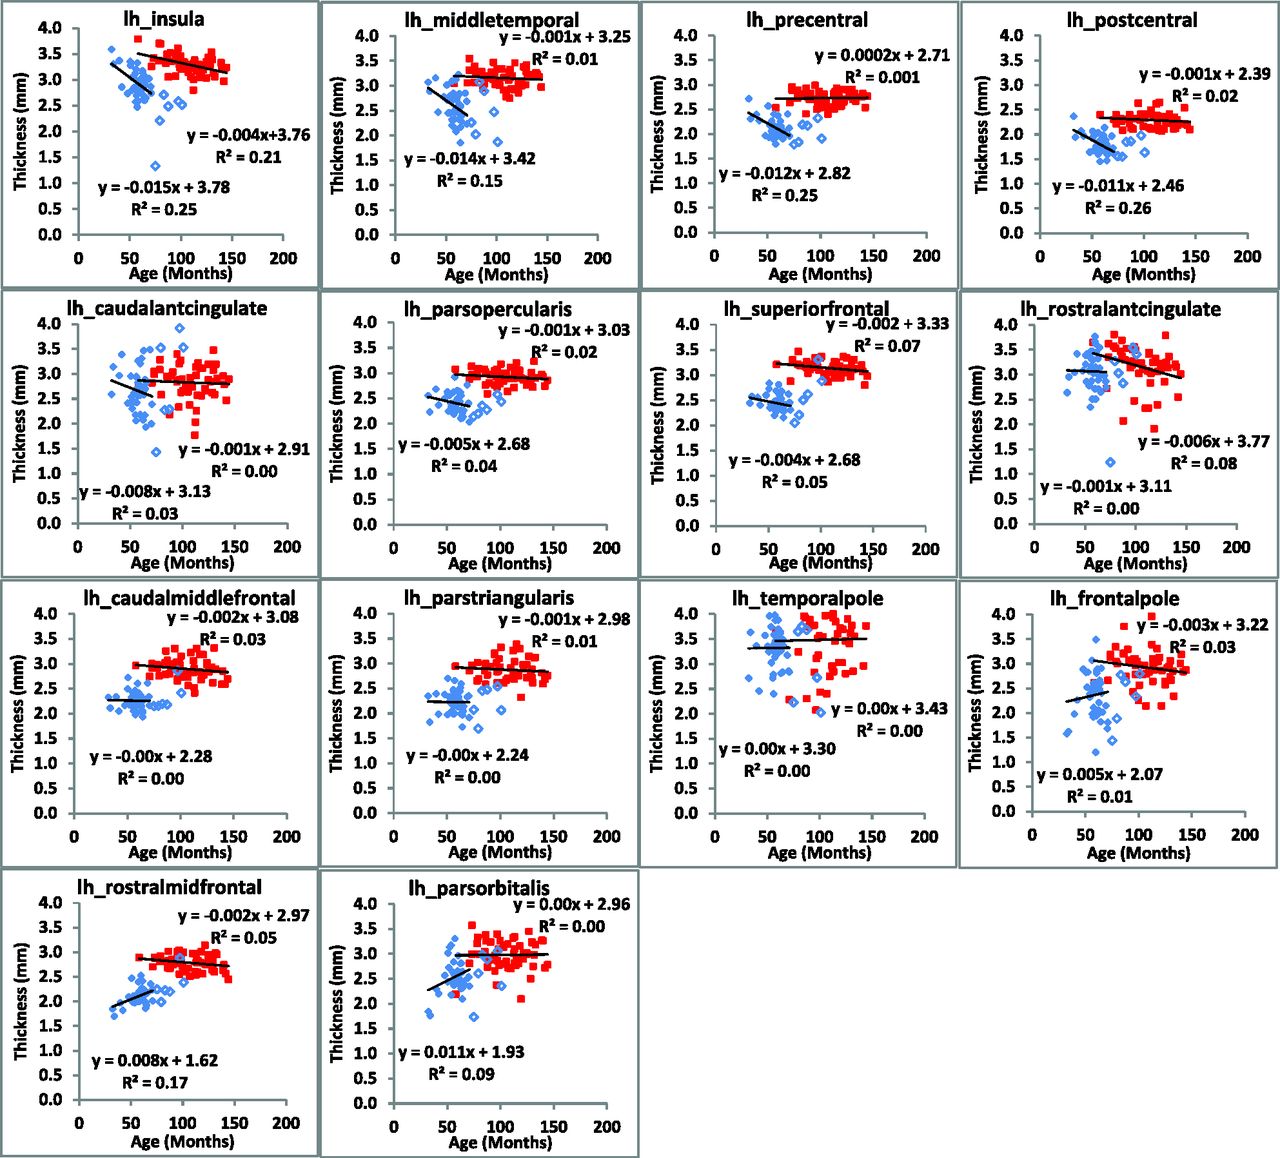
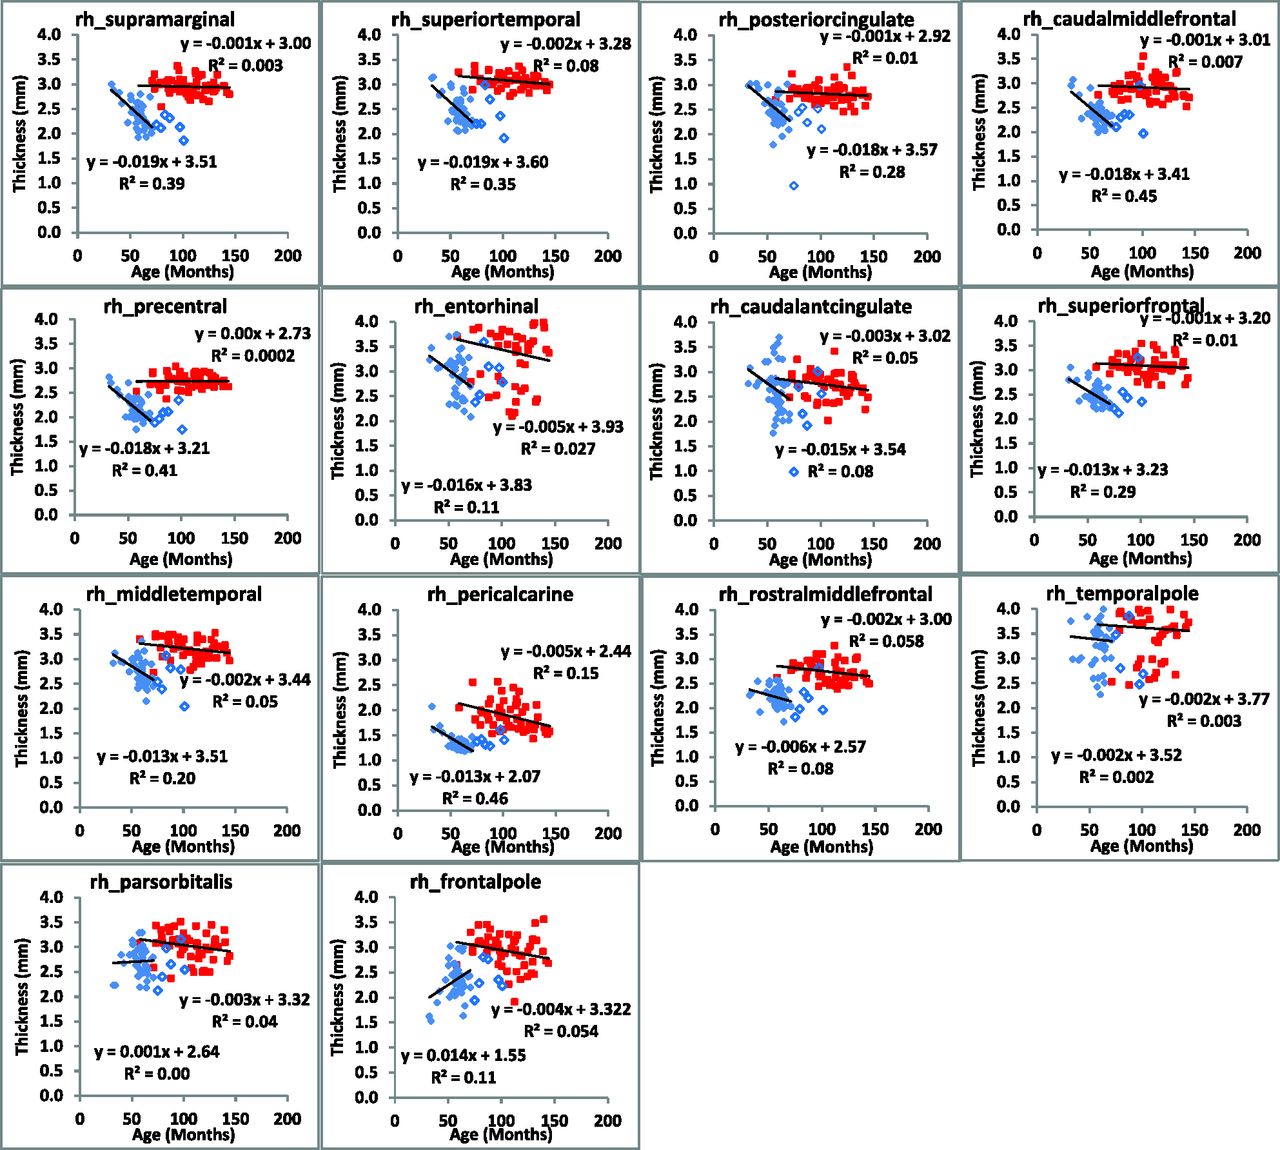
The rate of change of cerebral cortical thickness with age was calculated for all regions (n = 34) of the brain in each hemisphere and exhibited 3 clear patterns (Figs 4 and 5). In the first, both the rate of change and mean thickness were different between subjects with CLN2 and controls (22 regions in the left hemisphere and 26 in the right hemisphere). In the second, there was no difference in the rate of change, but there was a difference in the mean cortical thickness (9 regions in the left hemisphere and 5 in the right hemisphere), and in the third, there was no difference in either the rate of cortical thinning or the mean cortical thickness (3 regions in the left hemisphere and 3 in the right hemisphere, On-line Table 2). Note that in cases in which there was a significant difference between the rate of cortical thinning between subjects with CLN2 and control subjects, a difference in the mean values of cortical thickness was certain. Similarly, there were no regions in which a significant rate of cortical thickness change was not accompanied by a change in mean cortical thickness. Mean cortical thickness values in both hemispheres were different (P < .001) in all regions between subjects with CLN2 and controls except the caudal anterior cingulate, rostral anterior cingulate, and temporal pole. Specific Brodmann areas exhibited significant rates of decline (7 regions in the left hemisphere and 12 regions in the right hemisphere) (P < .001) (On-line Table 3). Mean cortical thickness values in both hemispheres showed significant differences from controls (P < .001) in all Brodmann regions.


Regional changes in cortical thickness of the left hemisphere are plotted as a function of subject age for CLN2 (solid diamond) and control (large filled square) groups. Subjects with CLN2 older than 72 months of age (open diamond) are not included in the linear fit.


Regional changes in cortical thickness of the right hemisphere are plotted as a function of subject age for CLN2 (solid diamond) and control (large filled square) groups. Subjects with CLN2 older than 72 months of age (open diamond) are not included in the linear fit.
Discussion
The increased rate of global cortical thinning in CLN2 versus control subjects is a primary finding in this study. In addition, this quantitative human MR imaging study demonstrates differential rates of degeneration in the cerebral cortical thickness with the progression of CLN2. These rates were based on cross-sectional data from many subjects at different stages of disease and not longitudinal follow-up of individual subjects for a long time. Regions of most rapid degeneration in subjects with CLN2 with age were in the occipital, temporal, parietal, and cingulate lobes. Degeneration of the occipital lobe, which contains the visual processing center, was faster than in any other lobe. The effect of degeneration in this region and in specific Brodmann areas complements our previously published work demonstrating a direct correlation between decreased performance on an Ophthalmic Severity Scale and the Weill Cornell CLN2 Score.29 In this context, impaired visual function in CLN2 may be, in part, the consequence of neuronal loss in the retina and thinning of the visual cortex.13,16 Most interesting, the rate of frontal lobe degeneration was not significantly different between subjects with CLN2 and control populations in the left hemisphere. However, the mean cortical thickness was significantly reduced in all lobes of the subjects with CLN2 compared with controls.
It is essential to interpret degenerative changes in CLN2 in the context of results obtained from normally progressing pediatric control subjects. Although cortical thickness decreased in CLN2 with disease progression, a trend toward mild cortical thinning was also observed in normal pediatric aging. This trend is in concordance with several studies in the literature.30⇓–32 The underlying mechanism for cortical thinning in normal maturation is still being investigated. It is postulated that synaptic pruning allowing changes in plasticity to increase neuronal efficiency may play a role.31 It is also believed that increased myelination into the cortical periphery may account for gray matter thinning in pediatric controls and increased white matter structure in adults. Compared with controls, degenerative changes in cortical thickness in the CLN2 population that we have reported are then specifically attributed to disease progression.
Variation in FreeSurfer cortical thickness measurements can arise from multiple sources when comparing data across platforms and institutions. In this study, the same FreeSurfer, Version 5.1.0, and a Linux operating system were used for processing of both CLN2 and control data. Studies have been performed to determine the reliability of these measures across various scanner platforms, pulse sequences, field strengths, and other differences.33,34 Our normative control population imaging in this study was acquired on both Siemens and GE Healthcare 3T platforms by using slightly different acquisition parameters for the MPRAGE sequence. However, no systematic difference in mean cortical thickness was observed in the healthy control population as a result of the scanner manufacturer.
Conclusions
Cortical degeneration in the brain occurs more rapidly in all lobes of subjects with CLN2 except the frontal lobe in the left hemisphere. The fact that CLN2 disease evidently affects specific cerebral lobes and cortical regions earlier and more rapidly than others may provide valuable information for enhanced diagnostic and future focal therapeutic strategies against this fatal disease. It may also provide neurobiologic insights regarding underlying mechanisms and clinical insights regarding deficits resulting from disease progression that may improve our understanding of CLN2 disease.
Acknowledgments
We gratefully acknowledge aid from the following groups in recruiting subjects with CLN2 for this study: the Partnership for Cures Chicago Illinois, Nathan's Battle Foundation, Batten Disease Support and Research Association, Noah's Hope Foundation, and Hope 4 Bridget Foundation. The authors would also like to thank Dr Gary Glover of Stanford University for providing the research MPRAGE sequence for use on the GE Healthcare MR imaging platform.
Footnotes
Disclosures: Jonathan P. Dyke—RELATED: Grant: National Institutes of Health (U54NS065768).* Dolan Sondhi—RELATED: Grant: National Institutes of Health (R01NS061848, U54NS065768).* Kaleb Yohay—RELATED: Grant: National Institutes of Health (R01NS061848, U54NS065768)*; Support for Travel to Meetings for the Study or Other Purposes: National Institutes of Health (R01NS061848, U54NS065768).* Stephen M. Kaminsky—RELATED: Grant: National Institutes of Health (R01NS061848, U54NS065768)*; OTHER RELATIONSHIPS: I am part of the team for the clinical protocol for a gene therapy to treat the disease addressed in this article. Kyle D. Rudser—RELATED: Grant: National Institutes of Health (supported in part by award UL1TR000114 of the National Center for Advancing Translational Sciences).* Barry Kosofsky—RELATED: Grant: National Institute of Neurological Disorders and Stroke.* B.J. Casey—RELATED: Grant: National Institute on Drug Abuse (RC2 DA029475).* Douglas Ballon—RELATED: Grant: National Institutes of Health/National Institute of Neurological Disorders and Stroke (U54NS065768).* *Money paid to the institution.
This work was supported in part by grants from the National Institutes of Health (R01NS061848, U54NS065768). The Lysosomal Disease Network (U54NS065768) is a part of the National Center for Advancing Translational Sciences Rare Diseases Clinical Research Network, an initiative of the Office of Rare Diseases Research, National Center for Advancing Translational Sciences, funded through a collaboration among the National Center for Advancing Translational Sciences, National Institute of Neurological Disorders and Stroke, and National Institute of Diabetes and Digestive and Kidney Diseases.
Indicates open access to non-subscribers at www.ajnr.org
References
- Received April 8, 2015.
- Accepted after revision November 30, 2015.
- © 2016 by American Journal of Neuroradiology


Jump to section
Related Articles
Cited By...
- Enzyme Replacement Therapy for CLN2 Disease: MRI Volumetry Shows Significantly Slower Volume Loss Compared with a Natural History Cohort
- Slowing late infantile Batten disease by direct brain parenchymal administration of a rh.10 adeno-associated virus expressing CLN2
- Expanding the Neuroimaging Phenotype of Neuronal Ceroid Lipofuscinoses