
Abstract
BACKGROUND AND PURPOSE: Although progress has been made in understanding the optimal anatomic structures as target areas for DBS, little effort has been put into modeling and predicting electromagnetic field properties of activated DBS electrodes and understanding their interactions with the adjacent tissue. Currently, DBS is performed with the patient awake to assess the effectiveness and the side effect spectrum of stimulation. This study was designed to create a robust and rather simple numeric and visual tool that provides sufficient and practical relevant information to visualize the patient's individual VAT.
MATERIALS AND METHODS: Multivariate polynomial fitting of previously obtained data from a finite-element model, based on a similar DBS system, was used. The model estimates VAT as a first-approximation sphere around the active DBS contact, using stimulation voltages and individual tissue-electrode impedances. Validation uses data from 2 patients with PD by MR imaging, DTI, fiber tractography, and postoperative CT data.
RESULTS: Our model can predict VAT for impedances between 500 and 2000 Ω with stimulation voltages up to 10 V. It is based on assumptions for monopolar DBS. Evaluation of 2 DBS cases showed a convincing correspondence between predicted VAT and neurologic (side) effects (internal capsule activation).
CONCLUSIONS: Stimulation effects during DBS can be readily explained with this simple VAT model. Its implementation in daily clinical routine might help in understanding the types of tissues activated during DBS. This technique might have the potential to facilitate DBS implantations with the patient under general anesthesia while yielding acceptable clinical effectiveness.
ABBREVIATIONS:
- DBS
- deep brain stimulation
- DRT
- dentatorubrothalamic tract
- IPG
- internal pulse generator
- ML
- medial lemniscus
- MPRAGE
- magnetization-prepared rapid acquisition of gradient echo
- PD
- Parkinson disease
- PT
- pyramidal tracts
- RN
- red nucleus
- rVAT
- radius of volume of activated tissue
- SENSE
- sensitivity encoding
- SNr
- substantia nigra
- STN
- subthalamic nucleus
- VAT
- volume of activated tissue
The concept of high-frequency electric stimulation in the brain to alleviate a variety of neurologic and psychiatric otherwise therapy-refractory disorders has gained wide acceptance in the field of functional neurosurgery.1 DBS is a technique that delivers electrical pulses, variable in amplitude, pulse width, and frequency, through permanently implanted electrodes, which are connected to an IPG.2
The electrodes are usually placed by using stereotactic procedures based on imaging studies (CT, MR imaging) combined with real-time intraoperative x-ray and electrophysiology. Depending on the diagnosis and patient-specific symptoms, different anatomic targets have been proposed. For PD, the internal globus pallidus, the STN, and the ventral intermediate nucleus are typical target regions.1,3
Although those targets have been empirically well-defined and proved to be beneficial to alleviate the neurologic and/or psychiatric symptoms, the true mechanism of DBS is still poorly understood.4 Recent advances in the development of key technologies like optogenetic neuromodulation5 (an experimental technique used in animals to differentially influence neuronal tissues on the basis of genetic manipulations and light of different wavelengths) and DTI-based fiber tracking6,7 have shifted the focus of attention from a lesion-simulating high-frequency inhibition of brain nuclei to a mere activation of the afferent axonal fiber environment of the nuclei. While mentionable progress has been made in improving the optimal anatomic target areas for DBS, only a few groups have devoted their effort to the specific aim of modeling and predicting the electromagnetic field of an activated DBS electrode and understanding its interaction with the electromagnetic properties of the surrounding tissue by building volume-conductor electric field models.8⇓⇓⇓⇓⇓⇓⇓–16
Because the size and shape of the volume of VAT depend not only on electrode design and generator settings but more precisely on individual spatially varying tissue parameters and electromagnetic interaction at the electrode-tissue interface, it is impossible to derive a universal model based only on electrode design and stimulation voltage.
The aim of this study, therefore, was to create a robust and simple numeric tool that provides sufficient and practically relevant feedback as to the patient's individual VAT depending on specific generator-stimulation settings and patient-dependent electrode-tissue properties. The model primarily relies on a patient's individual impedance measures obtained during postoperative IPG programming with monopolar DBS electrode settings and variable voltages. It generates VAT distance isolines around the DBS contact for specific IPG voltages by means of a spheric model. The model was consistently tested for all 12 patients with STN-DBS on the basis of preoperatively acquired DTI and fiber-tracking of critical fiber tracts with the individual effect/side-effect spectrum, but only 2 cases are exemplary, shown in this article for the sake of simplicity.
Materials and Methods
Simulation and Model
Without hypothesizing about the therapeutic mechanism of DBS, we presume the validity and importance of the VAT to achieve the best therapeutic effects with minimal impairment or side effects for the patient under treatment.17 (In contradiction to various references, we establish “volume of activated tissue” as VAT instead of VTA to differentiate the term from the ventral tegmental area, a very important anatomic region of the brain in neurosurgery and DBS.) From work of various authors, notably the fundamental progress made by Kuncel, Grill, McIntyre, Butson, Yousif, and others,8⇓⇓⇓⇓⇓⇓⇓–16 we adopted a simple model to estimate the VAT, based on a monopolar stimulation design of a DBS electrode commonly used for PD, tremor, and dystonia.
Previous work on axonal modeling18 and experiments on large neurons as models for white matter19 show behavior of the VAT lateral distance over the stimulus voltage that can be accurately fitted with a second-order polynomial of the general form:
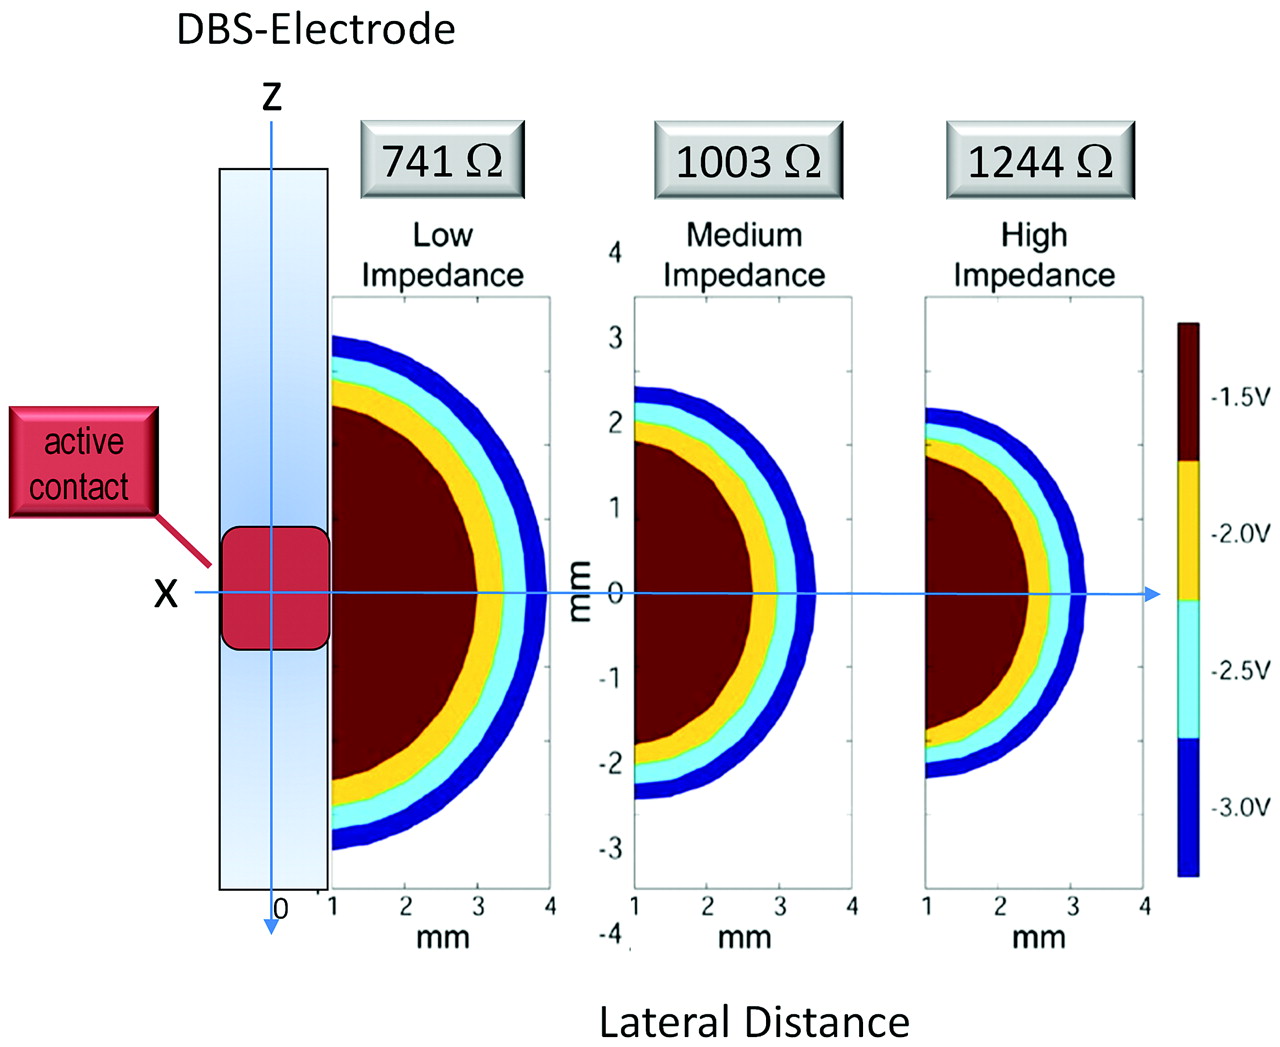
 where r represents the radius of the VAT centered at the electrode contact at a voltage unit (U. k0), a geometry factor reflecting the radial design and finite diameter of the electrode, can be held fixed if certain geometric design parameters of the electrode are accommodated into the model (eg, electrode radius, 0.75 mm). These prior investigations led to the adaptation of our simplified model from previously published data9 depicted in Fig 1. Digitizing this graph creates 3 sets of data (voltage U versus radial distances x, y, and axial z) for the 3 investigated impedance regimen (low = 741 Ω, medium = 1003 Ω, high = 1244 Ω) that are depicted by the corresponding symbols in Fig 2. The term “impedance” as used in this article refers to the electrical impedance or resistance under conditions of electromagnetic wave propagation for alternating current. It is an indicator for electrode-tissue conductivity and also depends on the frequency of the AC or pulsed wave form. The patient's individual impedance was directly measured with the help of the implanted IPG over an N′Vision telemetry system (Medtronic, Minneapolis, Minnesota).

VAT as a spatial plot of axis-symmetry stimulation spread for a common DBS and stimulus settings (−1.5, −2.0, −2.5, 3.0 V pulse amplitude, 130-Hz stimulation frequency with a 90-μs pulse width) by using 3 different impedance models. Reprinted and modified from Butson et al9 with permission from Elsevier.

Radial dimension of VAT dependent on stimulation voltage for 3 different simulated impedances (digitized from Butson et al9). The “experimental” points were fit with a second-degree 2D polynom (independent variables, impedance, distance; dependent variable, stimulation voltage).
Although in theory, the VAT assembles an almost perfect sphere for an isotropic impedance, one can see from Fig 1 that the medial distance along the electrode (z) is slightly smaller than the radial distances x and y and can, therefore, be used for a refined asymmetric model (also compare Fig 2, dashed blue line). The digitized results are depicted in Fig 2 (symbols) together with second-order polynomial fits from equation 1 (lines). For simplicity, we focus on the spherically symmetric model with x = y = z and refer to this distance as the VAT radius r.
Accurate prediction of the VAT at small voltages in close proximity to the electrode surface (r < 0.1 mm) will be highly inaccurate and is, therefore, not in our focus of interest.
The obtained 1D model in Fig 2 was extended into a 2D problem U = f(r,Ω) for the more general approach to also let the impedance Ω be a variable in our fit:

The numeric analysis was performed with IGOR-Pro (Wavemetrics, Lake Oswego, Oregon) on the basis of multivariate second-order polynomial fitting by noniterative singular value decomposition. The quality of fits was evaluated by means of mean-residual, SD, and χ2 misfit according to Numerical Recipes.20
3D visualization was achieved with Amira (Visage Imaging, Berlin, Germany).
All simulations were performed for the quadripolar DBS-electrode model 3389 (Medtronic, Minneapolis, Minnesota) under monopolar stimulation settings. The model is similarly applicable to all DBS electrodes with monopolar stimulation settings (IPG-positive, contact-negative).
In Vivo Study
Patient Selection.
Twelve patients with refractory PD participated in this study with written informed consent. The treatment with STN-DBS followed established guidelines. Retrospective evaluation of the DTI together with clinical effects and the publication of data was approved by the institutional review board of Bonn University (No. 199/09).
MR Imaging.
Two days before surgery, MR imaging was performed without a stereotactic frame and with the patient under mild sedation. MR imaging data were acquired on a 3T intera table-body system (Philips Healthcare, Best, the Netherlands) by using an 8-element phased-array head coil (for full details refer to Coenen et al6). The MR imaging examination comprised an isotropic T2-weighted FSE, a DTI sequence, and 2 MPRAGE scans. The parameters were the following: FSE: TR = 12,650 ms, TE = 100 ms, FOV = 254 mm, matrix = 176 × 176, 120 sections, sections thickness = 1.44 mm, and acquisition time = 3 minutes and 44 seconds. The resulting data were reconstructed to isotropic 1.44-mm3 voxels: DTI: (SENSE, factor 2.9) spin-echo EPI pulse sequence with TR = 13,188 ms, TE = 84 ms, FOV = 256 mm, matrix = 128 × 128, 70 sections, section thickness = 2 mm, number of gradient directions = 32, b-value = 1000 s/mm2, acquisition time = 7 minutes 54 seconds) with isotropic reconstructed 2-mm3 voxels.
A T1-weighted 3D-MPRAGE sequence was acquired before (structural information) and after (vessel visualization) contrast administration (gadolinium-diethylene-triamine pentaacetic acid) with a SENSE factor = 4, TR = 8.5 ms, TE = 3.8 ms, flip angle = 8°, FOV = 256 mm, matrix = 256 × 256, 160 sections, section thickness = 2 mm, acquisition time = 4 minutes 17 seconds. It resulted in reconstructed isotropic 1-mm3 voxels.
All images were obtained in the axial orientation.
CT.
Preoperative stereotactic CT scans were acquired on a 16-row multidetector scanner (Brilliance 8000, Philips Healthcare) with a fixed stereotactic frame. Parameters were as follows: tube voltage = 120 kV, tube current = 350 mA, collimation = 16 × 0.75 mm, tube rotation time = 1 second, pitch = 0.942, matrix = 512 × 512, section thickness = 1.5 mm, increment = 1.5 mm.
Postoperative CT used the following parameters: tube voltage = 120 kV, tube current = 350 mA, collimation = 16 × 0.75 mm, tube rotation time = 0.75 seconds, pitch = 0.688, matrix = 512 × 512, section thickness = 2 mm, increment = 1 mm. The different postoperative CT scanning parameters were chosen for better electrode metal artifacts suppression.
Stereotactic Procedure.
Surgery followed stereotactic guidance with a NexFrame neuronavigated head-mounted frame (Medtronic). Direct targeting was based on the T2-weighted MR imaging anatomy of the STN region with the anterior lateral and superior STN3 (mid-commissural point coordinates: x = 12, y = −2, z = −4, bilaterally). During surgery with the patient awake, the target region was scrutinized with microelectrode recording (Leadpoint, Medtronic) using 3–5 parallel tracts in a multiple-electrode array (so-called “Ben's gun”) setup in a microdrive (FHC, Bowdoin, Maine) attached to the frame. After electrophysiologic location of the STN, test stimulation was performed with the micro-macro electrode (MME, model 7100, FHC, Bowdoin, Maine) to identify an electrode position with the best therapeutic width between beneficial effects (reduction of rigidity, improved bradykinesia) and unwanted side effects (dysarthria, facial contraction). DBS electrodes were placed under fluoroscopic guidance. An Activa PC (Medtronic) was used as a DBS pulse generator and was implanted in the left subclavicular region.
Postoperative Electrophysiologic Testing.
One week after DBS implantation, blinded generator testing was performed. Each electrode contact was tested separately to determine settings that yielded the best therapeutic effects and kept capsular side effects (gaze palsy, dysarthria, or facial contraction) to a minimum (compare On-line Table 1 and Fig 5). The patient's individual impedances, representing the internal system impedance combined with tissue impedance, were measured using the IPG on monopolar settings with 130-Hz and 60-μs continuous pulses and escalating voltages starting at 1 V with 0.5 V increments until persisting side effects were elicited.
Fiber Tracking.
Deterministic fiber tracking used the StealthViz DTI software application (Medtronic). Fiber tracking of the PT and the DRT was performed as described previously.6,7
The ML was tracked with the same VOI in the midbrain used for the DRT. The excluding VOI was set in the corresponding postcentral gyrus.6
Determination of DBS Electrode Position and Respective Distance to Fiber Tracts.
A postoperative helical head CT scan confirmed the targeted individual DBS electrode contact locations. The CT data were automatically fused to all planning data. Fusion quality was evaluated by visual inspection in 3 orthogonal image planes.
The 4 electrode contacts, each 1.5 mm long and 0.5 mm apart, were numbered 0, 1, 2, and 3 from deep to superficial and were identified from the radial center of the CT metal artifacts.
Geometric distances between electrode contact and fiber tracts were measured within the 3D visualization and measurement toolbox of Amira.
Results and Discussion
The simplest VAT approximation from equation 2 assumes a perfectly isotropic electromagnetic field distribution around a monopolar contact and creates a spheric VAT shape (Fig 3, left).

The 3 successive stages of simulating the simple VAT. Left: the spheric model—radial diameter is the same in all directions. Middle: the ellipsoid-model radial—diameter is larger than that along the z-axis (electrode axis). Right: torus model—known real shape from finite-element methods. For most practical applications, the simple spheric model is sufficient.
As one can appreciate from Fig 1, the VAT follows a slightly different relationship along the z-axis of the electrode than in the radial direction. In Fig 2, this is demonstrated exemplarily by the z-profile (blue dashed line) for a low impedance regimen (741 Ω) compared with the solid blue line for the radial profile. Generally speaking, one needs a higher voltage along the electrode axis to achieve the same distance of activation. This general behavior for a monopolar stimulation regimen can be accommodated into the model by modifying the first approximation spheric shape of the VAT into an ellipsoid (Fig 3, middle) or even further, supported by finite-element simulations and Maxwell equations, into the torus shape of the VAT (Fig 3, right). From more advanced and sophisticated modeling techniques that consider spatial tissue conductivity inhomogeneities of the DBS surrounding tissue12 (the impedance becomes a spatially varying parameter), one can appreciate that even those realistic VAT shapes assemble a reasonable sphere in first approximation.
In practice, DBS electrodes are typically implanted in such fashion that beneficial stimulation effects will be commonly achieved in the tissue located perpendicular to the axis of the electrode because the trajectory needs to avoid functional tissue on its way to the target. Therefore, the radial distance of the VAT is notably the most interesting parameter for our simulation. We, therefore, concentrate on the simplest case of a spheric VAT (compare Fig 3, left) with its radius perpendicular to the electrode axis.
Known simulation-input parameters are the electrical impedance Ω, which can be directly measured with the IPG for each patient, electrode location and configuration, and the stimulation voltage U.
Due to low number of “experimental” values (from the digitized graph in Fig 1), the multivariate 2D fit is rather sensitive to variance and uncertainty in the data. We, therefore, estimated the influence of all second-order polynomial coefficients, particularly those whose values resulted in close-to-zero numbers for the completely unconstrained fit and for the robustness and quality of the fit. The aim was to use the simplest model (minimal number of coefficients) that still sufficiently described the experimental data and showed robust fit behavior in the estimated range of practical relevant voltages between 1 and 10 V and 1- and 5-mm VAT, respectively.
Table 1 summarizes the various attempts of fitting a 2D second-order polynomial in equation 2 with different constraints for the 6 fit parameters ki=0-5. 0b denotes a parameter that was purposefully set to zero to eliminate its degree of freedom. χ2 (normalized sum of squares of least-squares fit) represents the goodness of the fit—its accuracy, a larger value symbolizing a stronger deviation or misfit of the data to the model. Because the smallest χ2 value for an all-parameter free fit was 0.865, we characterized a good fit up to twice this value (χ2 ≤ 1.7).
Results of fit parameters for the second-degree 2D polynom from equation 2 and the corresponding χ2 misfit valuesa
With the general implementation of 6 fit parameters, we had to perform 6! = 720 different combinations. In the following, we summarize only the most important findings from the evaluation of model constraints. Forcing k0 (offset) through the origin, we observed an only marginal increase of χ2 from 0.8654 to 0.8680, indicating the role of k0 as a geometry parameter (electrode radius) (compare Table 1, rows 1 and 7). Additionally constraining k2 (linear term of impedance) and k5 (quadratic term of impedance) to zero did not lead to a notable increase in χ2 either (compare Table 1, model 10), whereas other combinations or alterations of constraints resulted commonly in vastly enlarged χ2 above the threshold of 1.7. Therefore this model (model 10 in Table 1) is our model of choice: We can eliminate 3 parameters from equation 3 without compromising on the accuracy of the fit, leading to an only marginal increase in χ2 from 0.86 to 1.21 and gaining access to a more robust (less df) and easier model (fewer parameters).
The attempt to eliminate the “cross-term” (k4·Ω·r) between the impedance and radius of VAT resulted in strongly increased χ2, implicating the importance of the term for proper modeling. This explains the difficulty in re-arranging equation 2 into the more useful form of r = f(Ω,U), which is more suitable for the practical implementation because known parameters are usually Ω and U. Analytic reversal of the equation U = f(r,Ω) into the form r = r(Ω,U) could not achieve robust reproducible fit behavior.
Therefore, model analysis had to be performed iteratively searching for the radius of VAT at any given impedance and voltage. After the coefficients have been finally determined, either for the full set of all 6 or the reduced set of 3 coefficients, equation 2 can be substituted into the general form r = r(Ω,U) for easier calculation. We only provide the version with k0, k2, k5 = 0 for reasons of simplicity:

Equation 3 and coefficients from Table 1 can be adopted into a worksheet and provide a fast approach to estimating the VAT radius for any given voltage between 1 and 10 V and impedance 500-2000 Ω.
Table 2 illustrates the numeric congruence of our model with the data for intermediate impedance (1003 Ω). Columns 2 and 3 list the numeric values obtained by digitizing the graph in Fig 1; column 4 shows the numeric values that rVAT obtained by our model (equation 2). The fourth and fifth columns depict the difference (residual) between the model of Butson et al9 and our model 1 (compare Table 1, row 1) with all fit parameters unconstrained and model 10, respectively. As one can observe, forcing fit parameters k0, k2, and k5 to zero causes only a marginal increase of the radius misfit of the VAT (mean misfit = 0.012 mm, SD = 0.112 mm) compared with the complete unconstrained least-squares fit (mean misfit = 0.003 mm, SD = 0.074 mm). The mean standard error for model 10 is ±0.025 mm and therefore much less than practically relevant.
Digitized data from Fig 1 for an intermediate impedance compared with our model-based calculations
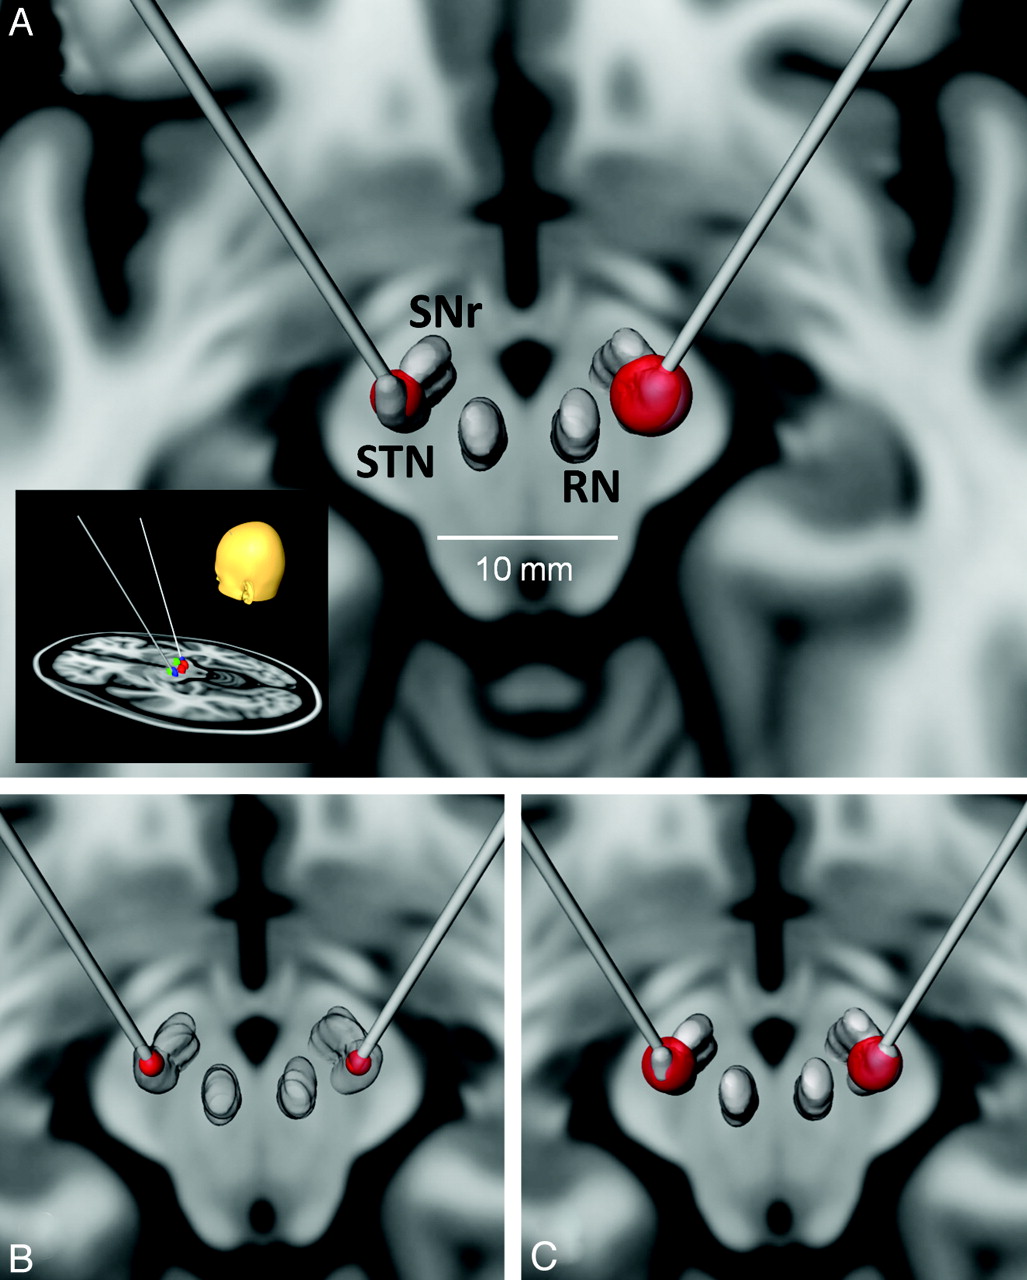
As an example, in Fig 4 we present simulated data of a typical DBS treatment setting for patients with PD in the vicinity of the STN. The inset in Fig 4A outlines the general target area (STN) as well as the angle and location of the DBS electrodes for bilateral stimulation on an MR imaging T1-weighted standard brain template (Montreal Neurologic Institute 152). The inset in section A shows the MR imaging T1-weighted template in axial orientation through the midbrain area with 3D-rendered structures of STN, SNr, and RN, constructed from a corresponding registered T2-weighted MR imaging template. Locations of the 2 monopolar-operated DBS electrode contacts are the bilateral centers of the STN together with the simulated VAT at equal voltages on the left and right sides. The different radii in both targets result from postulated unequal impedances: left side = 1300 Ω resulting in rVAT = 2.61 mm; right side = 600 Ohm with a rVAT = 3.93 mm. Fig 4B shows the VAT for stimulation voltage U = 2.4 V at 1000 Ω on both sides (rVAT = 1.5 mm), and Fig 4C shows the corresponding VAT for U = 3.5 V (rVAT = 3.25 mm). Note that already a relatively small increase of 1 V in stimulation voltage (B versus C) gives rise to a doubling of rVAT, therefore an 8-fold increase in the activated volume for moderate impedances (V ∼ r3).

Example of simulated VATs (red spheres) with the numeric model from equation 2 for various stimulation voltages and postulated impedances displayed on the Montreal Neurological Institute's brain template MNI-152 T1-weighted MR imaging in an axial orientation. The electrode target specifies a typical location for STN-DBS in PD inside the STN close to the SNr and RN. A, The inset depicts the general location of DBS electrodes in the region of the midbrain. VAT with equal stimulation voltage (2.5 V) for tissues with different impedances. Left: 1300 Ω > VAT radius = 2.61 mm. Right: 600 Ω > VAT radius = 3.93 mm. B, VAT for stimulation a voltage of 2.4 V at 1000 Ω (r = 1.5 mm). C, VAT for a stimulation voltage of 3.5 V at 1000 Ω (r = 3.25 mm).
In Vivo Validation
We report 2 exemplarily chosen cases from a larger study (n = 12) that illustrates the accurate correspondence between the estimated VATs from our model and the individual patient findings from image guidance and DBS. Previous reports have already implicitly used this technique and may serve as further validation.6,21,22 We estimated the spatial accuracy of registered preoperative MR imaging and pre- and postoperative CT with the creation of individual fiber tracts to be better than 1.5 mm. All herewith presented results have to be judged and discussed within this precision.
In all patients, the STN, SNr, and RN were segmented from the individual T2-weighted MR images. Generated fiber tracts were the PT, ML, and the DRT, all tracts in the vicinity of the mentioned nuclei and structures very likely involved in possible side effects of STN stimulation. Figure 5 and On-line Table 1 summarize the findings. Outlines of the left DBS electrode tip, fiber tracts, and midbrain nuclei are depicted in Fig 5A with an enlarged view in B. Figure 5C presents a summary for patient 1: the left PT together with the different stimulation voltages of the VAT at all contacts for best therapeutic settings (top row) and stimulation voltages that caused a number of side effects (bottom row). Figure 5D illustrates the same results for patient 2.

In vivo model validation with data from 2 patients with PD. A and B, Overview with a DBS electrode located in the subthalamic nucleus (light blue). The massive fiber bundle just lateral to the STN and SNr (green) is the PT (red). The DRT (orange) is posterior to the fiber bundle. The simulated VAT in B (blue mesh) represents the typical VAT stimulation for a high-frequency stimulation of the anterior lateral and superior STN. C, Patient 1. D, Patient 2, left side of patients shown only. Focus on clinical side effects (capsular, PT activation). Upper row: contacts 0–3 of a model 3389 DBS electrode from Medtronic activated at different voltages. Contacts 2 and 3 show the best clinical effects as expected form their location. Lower row: thresholds for capsular side effects. With the given voltages, the calculated VAT penetrates the PT (arrows) at different contact settings (left to right, contacts 0–3).
Arrows indicate regions of the PT fibers that were penetrated by the electric field of the DBS, visualized by the simulated VAT (blue transparent spheres). By projecting DBS contact, VAT, and PT and measuring their spatial distances from each other, we could predict the maximum distance between the contact and proximal edge of the PT (maximal radius of the VAT) that would not lead to neurologic side effects under STN stimulation, like facial contractions, gaze paresis, and dysarthria.
On-line Table 1 shows how individual contact settings with escalating currents lead to effectiveness (reduced rigidity, tremor, and akinesia); then, as soon as the VAT radius extends into the internal capsule, they lead to contratherapeutic side effects. We found very accurate concordance between predicted voltages of simulated VAT and the onset of actual neurologic side effects (compare On-line Table 1, rVAT versus minimum proximal distance). The best therapeutic settings for patient 1 were achieved on contacts 2 and 3 with voltages between 2 and 3 V, corresponding to rVATs of 3–4 mm. Larger voltages caused various internal capsule side effects. This finding accurately reflects the good correspondence of an estimated minimal proximal distance between a DBS contact and PT of 3.6–3.9 mm.
Optimal DBS settings for patient 2 were achieved on contacts 1, 2, and 3 with voltages between 1 and 3 V (compare On-line Table 1) and corresponding estimated rVATs between 2 and 2.8 mm. Side effects on contact 2 were noticeable at 4 V (rVAT = 3.3 mm) and on contact 3 at 3 V (rVAT = 3.4 mm). These results also impressively confirm the estimated minimal proximal distance of 2.5–2.6 mm between the electrode center and PT.
The last column in On-line Table 1 lists the percentage ratio between the number of VAT-penetrated PT fibers and the total number of cross-sectional PT fibers. We found that already very small percentages of involved fibers in the VAT (1%–5%) can lead to easily recognizable capsular side effects. This might indicate that the unwanted stimulation of only a small portion of fiber tracts and their corresponding neurologic side effects is already sufficient to hamper the therapeutic benefits of DBS.
Comparison between the clinical (side) effects of high-frequency stimulation and imaging results is subject to inaccuracies that need to be discussed. During the testing phase after the implantation of DBS electrodes, individual contacts are tested for their (side) effect spectrum. With escalating voltages (typically 0.5 V steps), therapeutic width is defined as the voltage needed to induce side effects (typically capsular effects like facial contraction, dysarthria in STN-DBS) minus the voltage needed to induce beneficial effects (typically tremor reduction, reduction of rigidity, and bradykinesia). Rating of this spectrum of clinical results is obviously highly subjective; nevertheless, the results indicate whether a therapeutic setting is tolerable. Because this clinical appreciation of the (side) effect spectrum appears to be the hallmark of therapy effectiveness, it is justified to compare these delicate clinical ratings with VAT simulation results. The goal of the study was gearing therapy toward an acceptable clinical effectiveness by using VAT simulations to predict this outcome while the patient is under general anesthesia.
Conclusions
We introduce a simple empiric model for VAT estimation under conditions of monopolar DBS stimulation. In conjunction with high-resolution MR imaging and fiber tracking as well as pre- and postoperative CT, our proposed model for instant calculation and visualization of VAT opens access to better characterization and understanding of physiologic, anatomic, and neurologic phenomena in the treatment of patients with PD and movement disorders with DBS.
Although the validity of the model has been demonstrated on only 2 clinical cases of movement disorders for matters of simplicity in this article, its implementation and consequences for planning, targeting, and understanding the implications of DBS in movement disorders have become a key component in our clinical DBS procedures.
We admit that the model is rather simple and that its accuracy depends primarily on the accuracy of the data that accommodate the model, but the combination of modern imaging techniques and established physiologic impedance measures allows a very high spatial accuracy between 1.0 and 1.5 mm, a necessary precondition to validate and exploit the model-based estimations in a useful manner. Also emphasis should be given to the fact that equation 2 does not constitute a “meaningful” electrophysiologic or electric field model but provides a mathematic lever to describe empiric findings under specific implementations of DBS. An exact classification of VAT does not exist, and the empiric findings might vary subjectively as well as manifest themselves in numerous individual patient variations.
Nevertheless, we believe in the usefulness of the implementation of the model, particularly in the time-restrained setting of an interventional DBS operating room or in its surgical preparation and targeting process. The simulation of estimated VAT can be achieved instantaneously under clinical settings as soon as the patient's individual impedance or permittivity data have been obtained. Hypothetically, one could providently envision a scenario in which these model outcomes might even assist in establishing and steering optimal IPG settings for the best therapeutic benefits synchronous with minimal neurologic side effects.
With the complexity and effective difficulty of modeling a close-to-reality electric field based on all possible input parameters (electrode geometry, tissue impedance, electrode-tissue surface effects, and so forth), we are certain that our contribution could be practically useful for stereotactic neurosurgeons performing DBS. The implementation of this technique into daily clinical routine might help to understand the different types of activated tissues (neurons, nuclei, white matter pathways) during DBS, leading to a better appreciation of what our target structures really are and how we can influence these. It might also help to achieve more accurate electrode positions. However, the major application we clearly foresee is the future perspective to perform DBS completely under general anesthesia if the clinical side effect spectrum can be readily predicted from electrophysiologic measurements during implantation and on the basis of realistic simulations of clinical effects like those presented here. This would be an invaluable improvement in patient comfort over the usually long DBS procedure.
Footnotes
-
Disclosures: Burkhard Mädler—UNRELATED: Travel/Accommodations/Meeting Expenses Unrelated to Activities Listed: International Society for Magnetic Resonance in Medicine, Comments: travel/conference fees. Volker A. Coenen—UNRELATED: Consultancy: Medtronic (Europe and USA), Comments: I have been working as a consultant for Medtronic Neuromodulation, occasionally receiving honoraria for activities and travel grants, Payment for Lectures (including service on speakers bureaus): Medtronic (Europe and United States).
References
- Received July 21, 2011.
- Accepted after revision September 8, 2011.
- © 2012 by American Journal of Neuroradiology
In this issue


Jump to section
Related Articles
Cited By...
- Evaluation of DBS computational modeling methodologies using in-vivo electrophysiology in Parkinsons disease
- Local field potential signal transmission is correlated with the fractional anisotropy measured by diffusion tractography
- Network fingerprint of stimulation-induced speech impairment in essential tremor
- FastField: An Open-Source Toolbox for Efficient Approximation of Deep Brain Stimulation Electric Fields
- Deep Brain Stimulation: Imaging on a group level
- Modulating the human functional connectome using deep brain stimulation
- Lead-DBS v2: Towards a comprehensive pipeline for deep brain stimulation imaging
- Electrophysiologic Validation of Diffusion Tensor Imaging Tractography during Deep Brain Stimulation Surgery