
Article Figures & Data
Figures
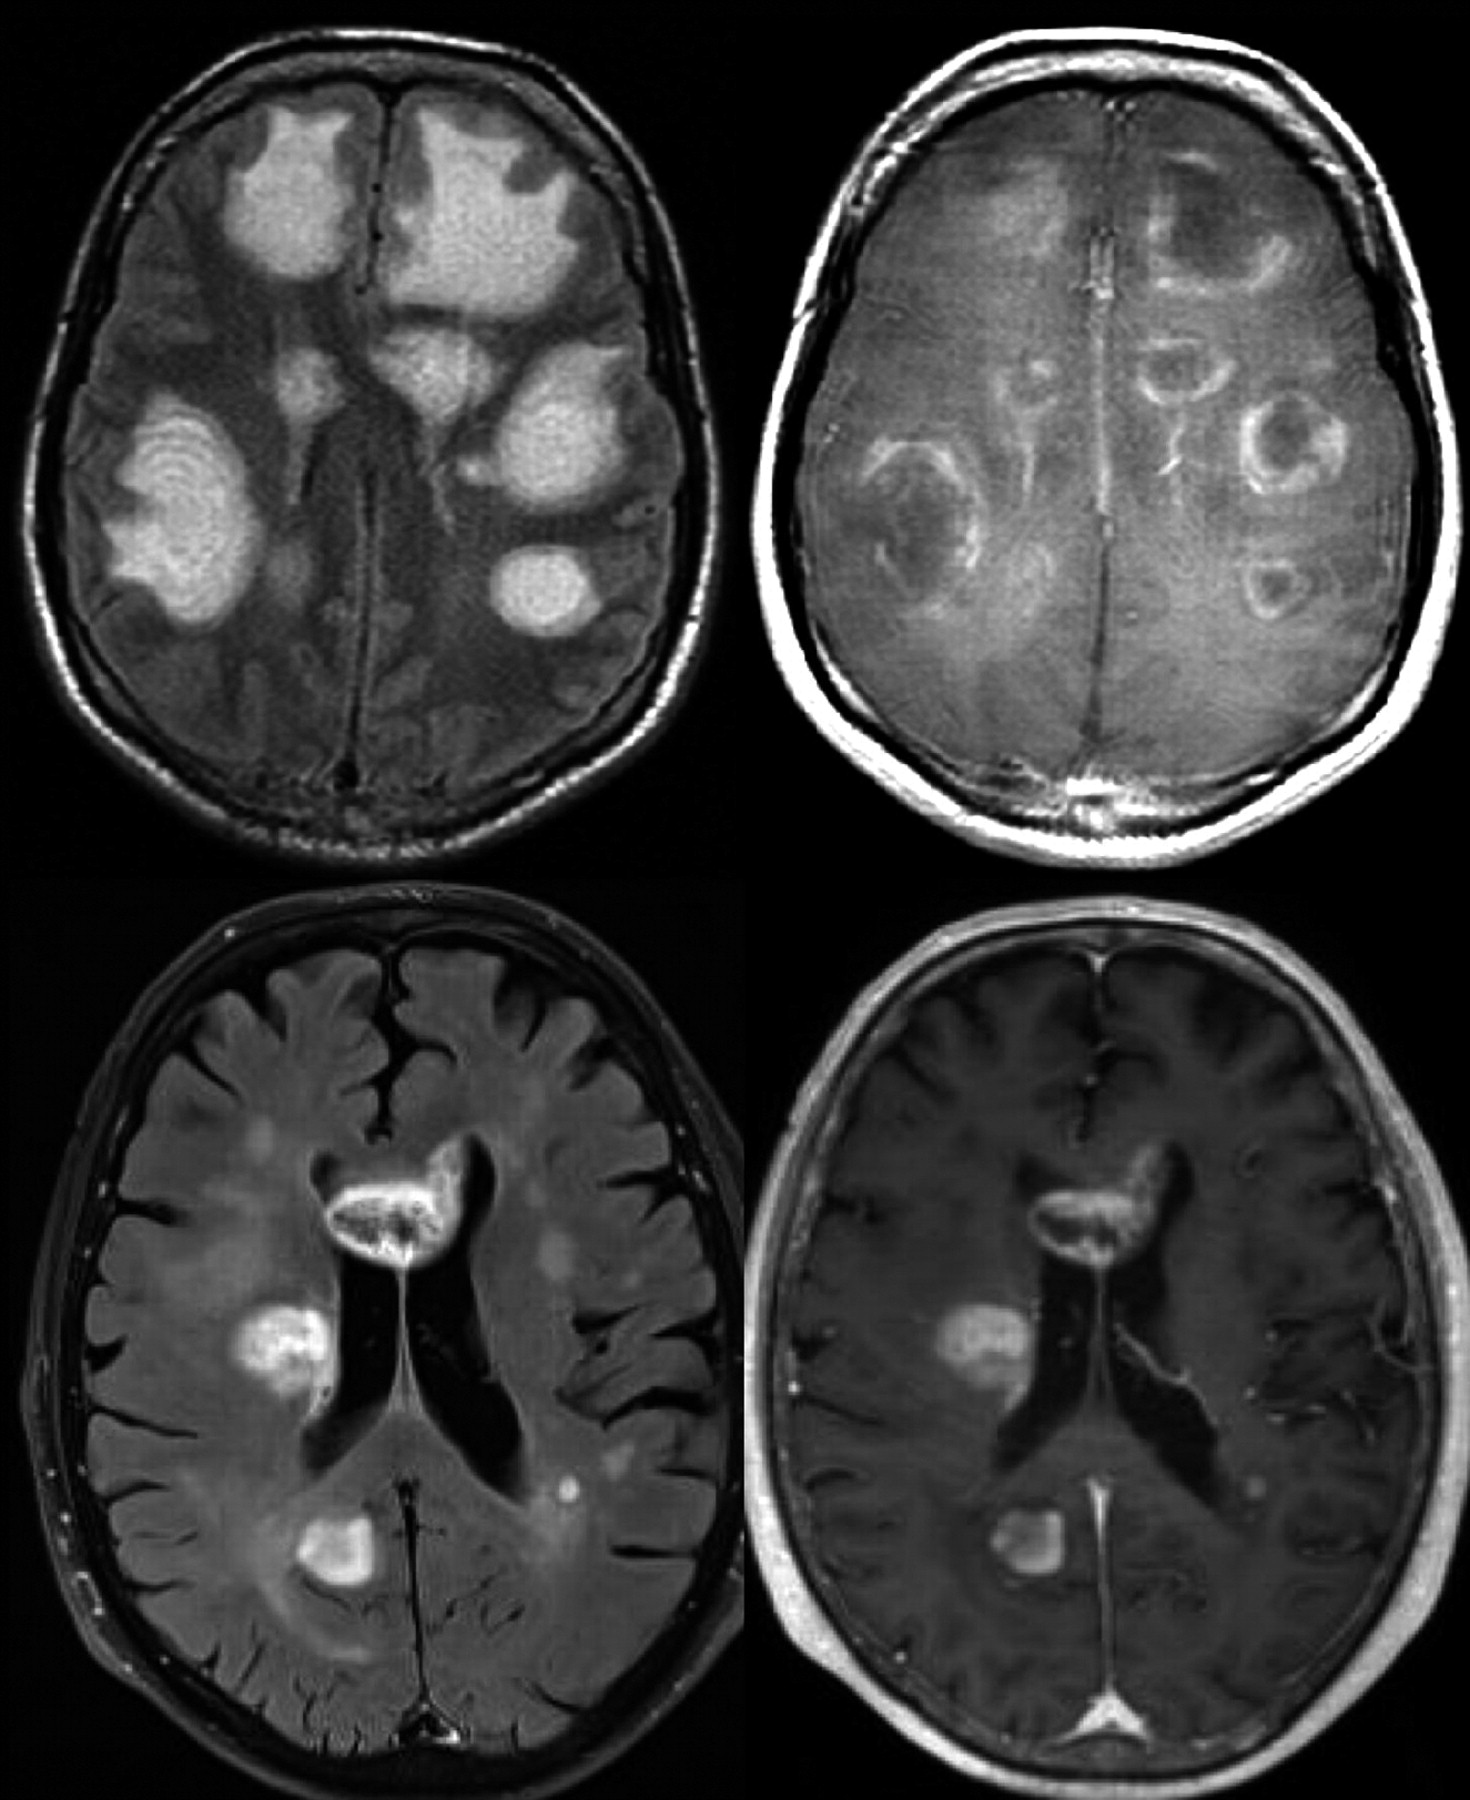
- Fig 1.
Intrinsic lesion architecture. A Baló-like pattern (alternating layers of preserved and destroyed myelin) can be identified in a patient with multiple pseudotumoral inflammatory-demyelinating lesions, which shows peripheral contrast uptake (acute disseminated encephalomyelitis) (upper row). This finding is not typically present in high-grade gliomas, as shown in a patient with multiple hemispheric masses that enhanced after contrast administration, which proved to be a multifocal glioblastoma (lower row).
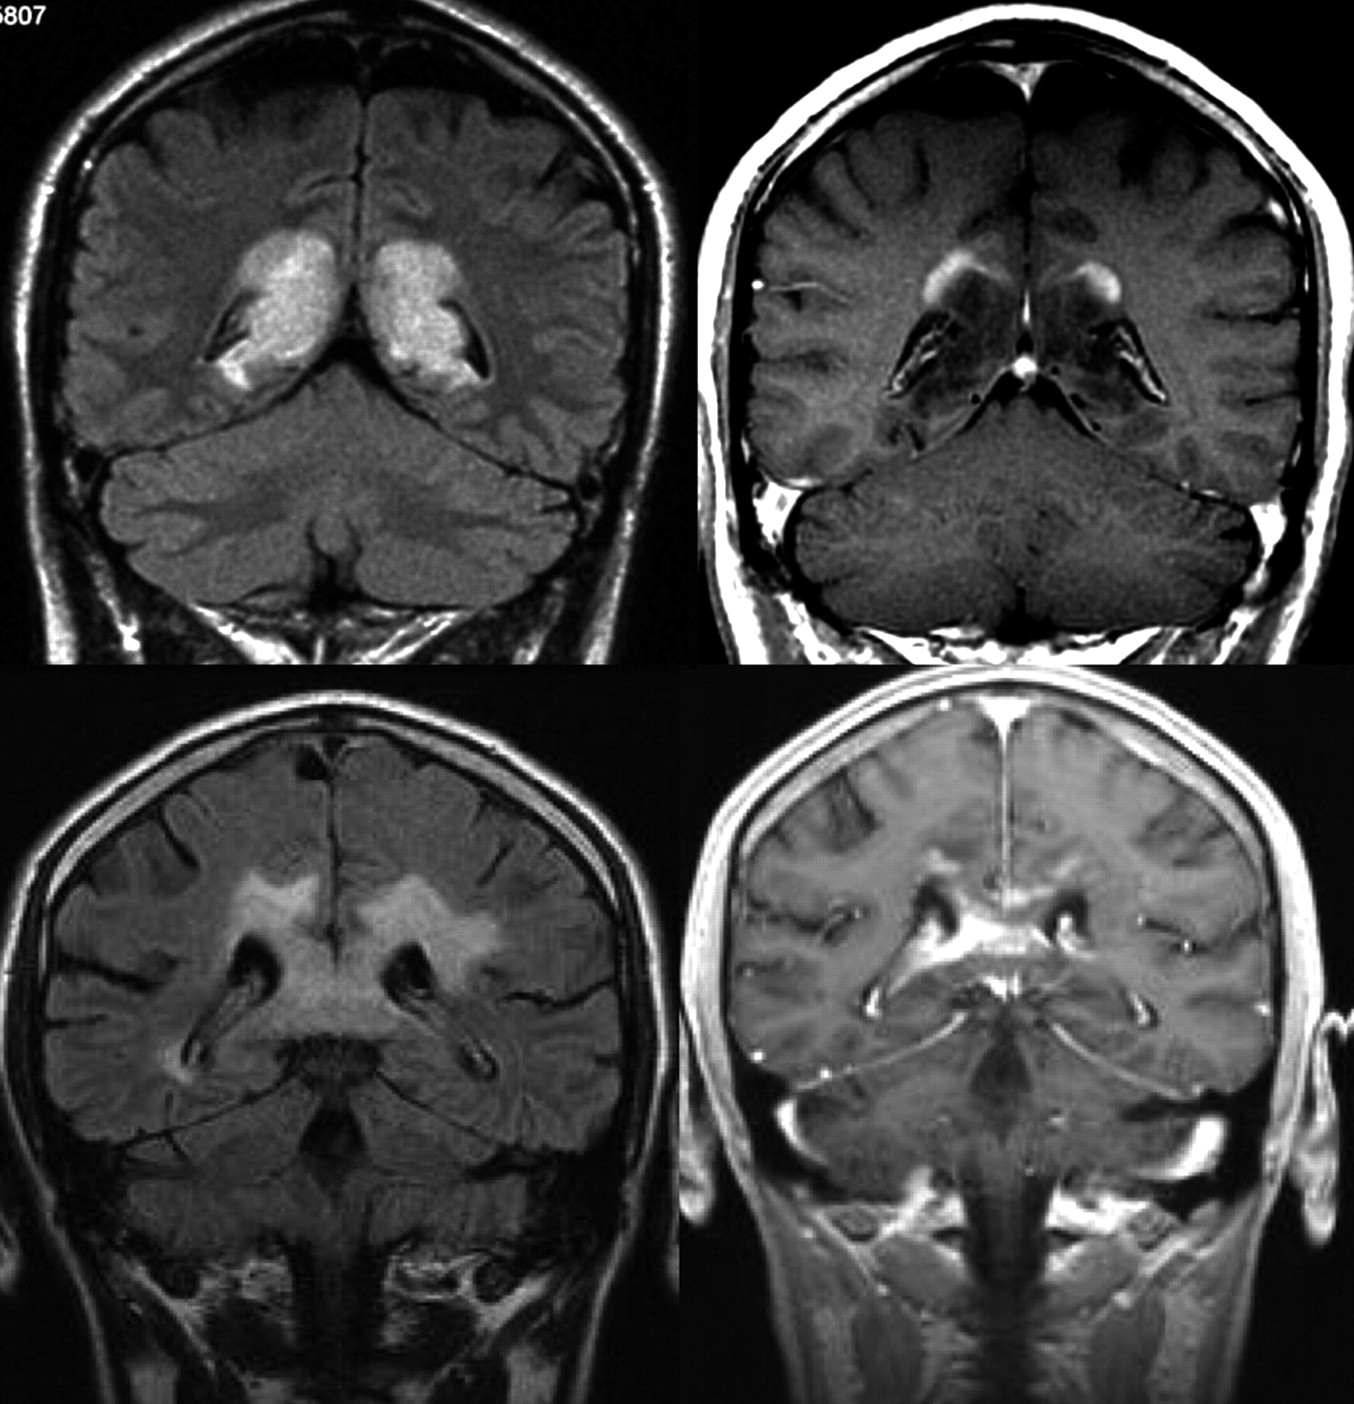
- Fig 2.
Patterns of contrast media uptake. A large tumefactive inflammatory lesion involving the corpus callosum shows an open ring enhancement with the open border facing the cortical gray matter (upper row). This feature is not typically seen in high-grade gliomas, where peripheral enhancement is identified even in the margins of the lesion in contact with the gray matter (lower row).
- Fig 3.
MR imaging (FLAIR, contrast-enhanced T1-weighted, and cerebral blood flow maps acquired with arterial spin-labeling) obtained in patients with a high-grade necrotic glioma (upper row) and an acute inflammatory-demyelinating lesion (lower row). Observe how, despite similar lesion patterns on both T2- and contrast-enhanced T1-weighted sequences, only the high-grade glioma shows a clear increase in cerebral blood flow.
- Fig 4.
Kaplan-Meier survival curves for progression-free survival within a low-grade glioma group with low and high rCBV (<1.75 and >1.75, respectively; solid lines) demonstrating a significant difference in time to progression in low-grade gliomas stratified by rCBV alone (P < .0001). Similarly, when comparing high-grade gliomas (broken lines), one sees a significant difference in progression with high-versus-low rCBV (<1.75 versus >1.75) (P < .0001). Among subjects with low rCBV (<1.75), there is a significant difference between low- and high-grade gliomas with respect to progression-free survival (P = .047). However, among subjects with high rCBV (> 1.75), progression-free survival is not significantly different for low-versus-high-grade gliomas (P = .266). Reprinted with permission from Radiology (2008;247:490–98). Copyright 2008, Radiological Society of North America.
- Fig 5.
Pseudoprogression in left frontal anaplastic astrocytoma. A, Axial T1-weighted image with contrast shows posttherapeutic brain with nodular contrast enhancement. B, Axial FLAIR image demonstrates increased edema surrounding the enhancing lesion. C, Permeability/Ktrans map with the region of interest. D, DCE MR imaging T1 signal intensity curve demonstrates reduced perfusion and permeability, suggesting pseudoprogression rather than recurrent tumor. Therapy was continued because the findings were thought to be due to pseudoprogression from chemoradiation therapy. E, Permeability/Ktrans color overlay, again confirming decreased vascularity and Ktrans. F, Histogram of each pixel within the region of interest in C, confirming that the permeability is in the lower range, demonstrating pseudoprogression rather than true disease progression. Courtesy of M. Law, Los Angeles, California.
- Fig 6.
Time course of pseudoprogression and change in the reference or baseline MR imaging. Criteria for determining progression are dependent on the time from initial chemotherapy and radiation. If one takes the reference MR image immediately postoperative, the first 12-week MR image may represent pseudoprogression and pseudoresponse. If one takes the reference scan after that initial 12-week period, then it essentially excludes pseudoprogression. Note enhancement outside the radiation field, where any enhancement may indicate disease progression. To avoid interpretation of postoperative changes as residual enhancing disease, one should ideally obtain a reference MR image within 24–48 hours after surgery and no later than 72 hours after surgery.
- Fig 7.
Comparison of MR images at 1.5 and 3T in a patient with astrocytoma grade III after administration of gadobutrol, 0.1 mmol/kg.
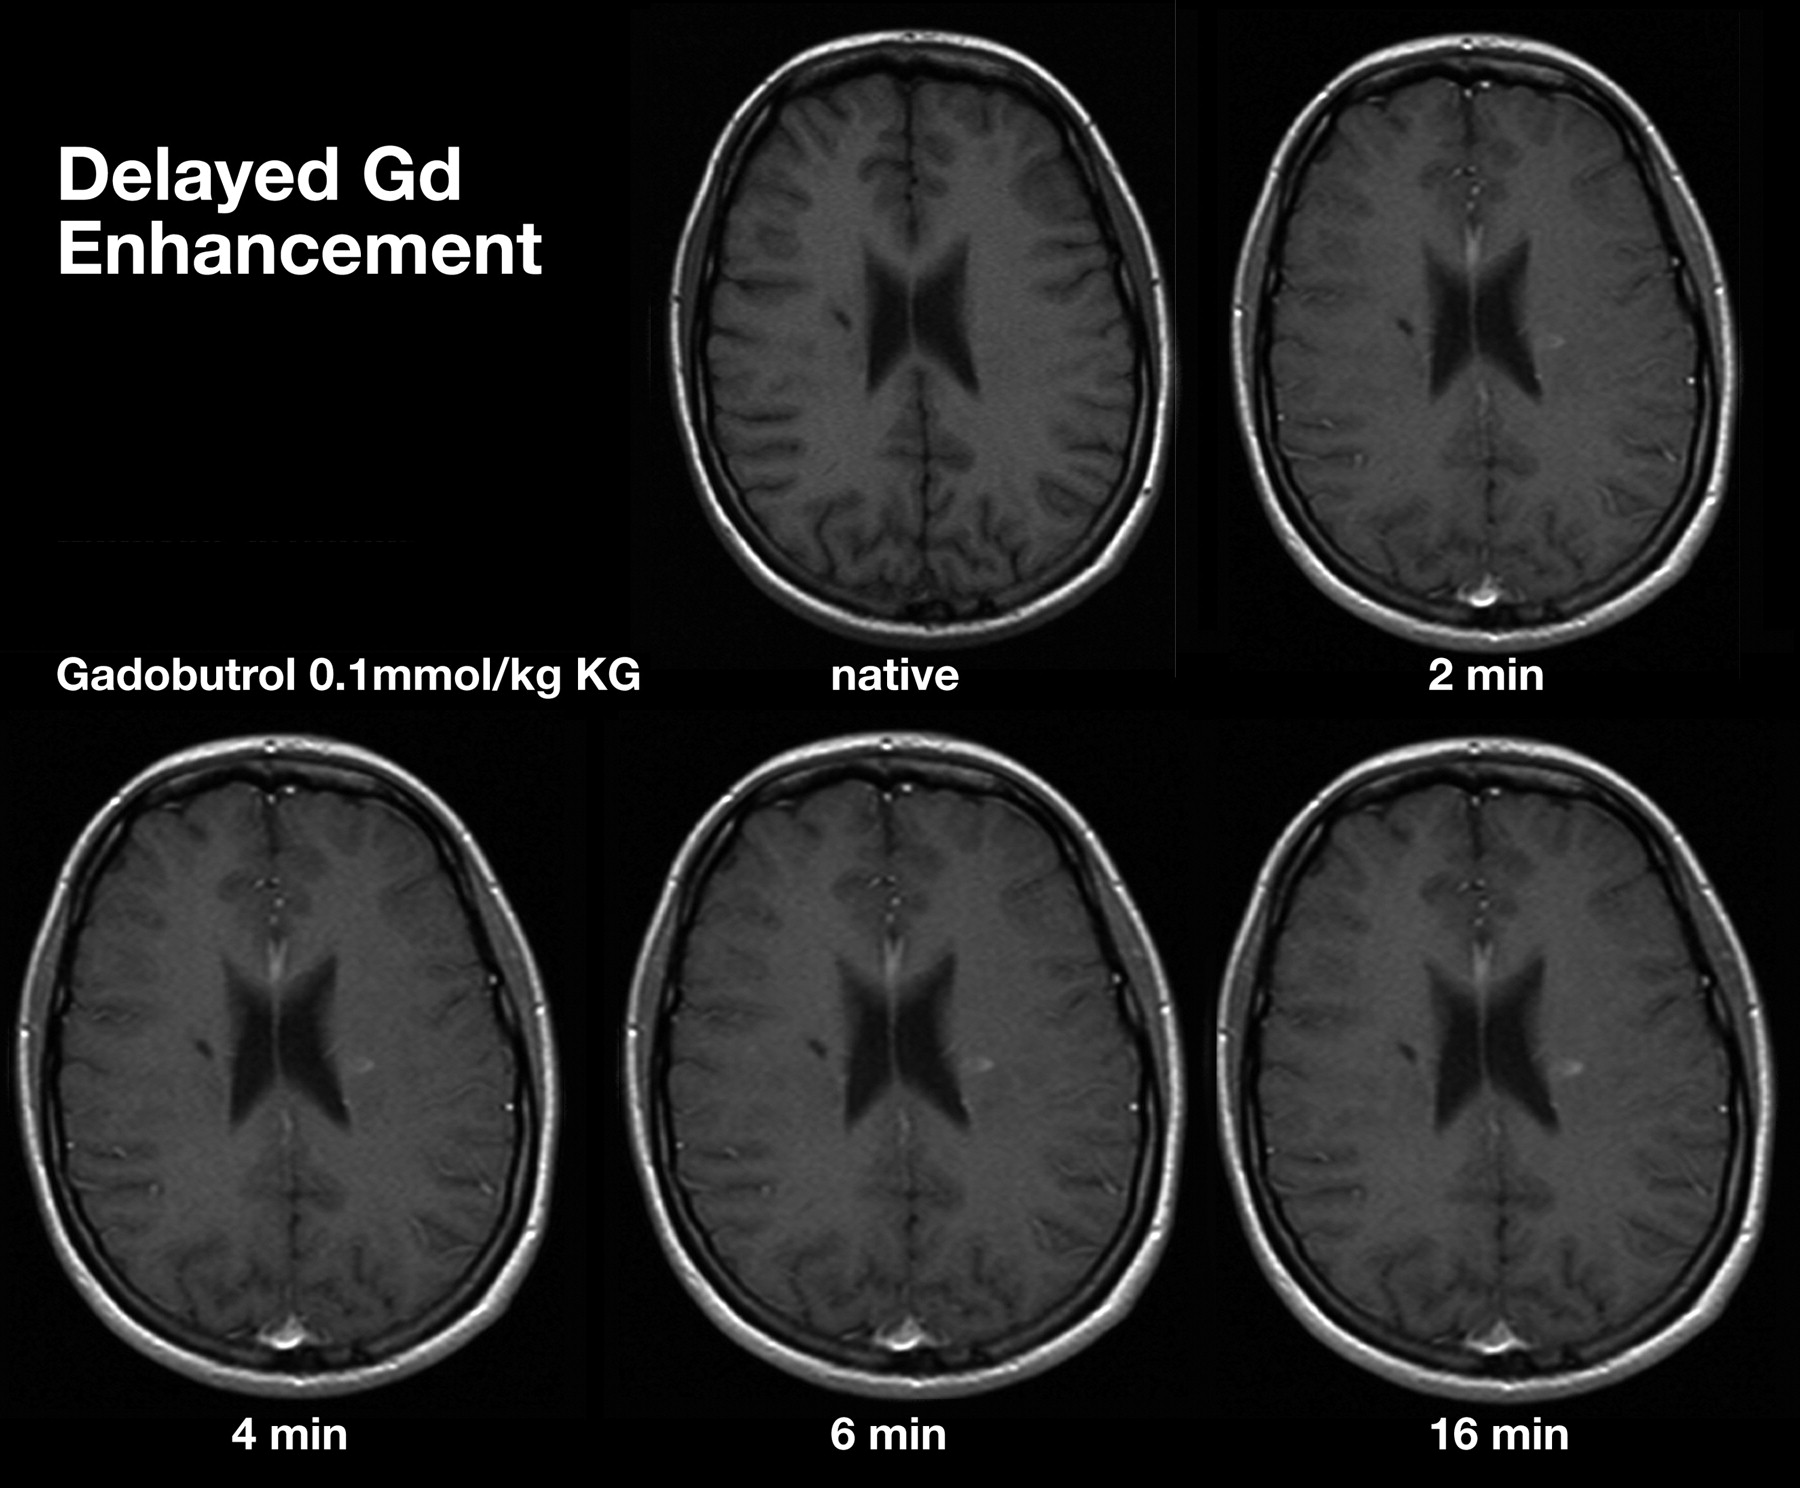
- Fig 8.
Comparison of MR images at increasing time intervals after administration of gadobutrol, 0.1 mmol/kg.
- Fig 9.
Comparison of T1 shortening effect among gadolinium-based contrast media, based on Port et al 200590 and Rohrer et al 2005.92.
- Fig 10.
Recurrent right temporoinsular glioma in a 48-year-old patient. Consecutive axial views of T1-weighted images after a single dose (0.1 mmol/kg body weight) of gadoterate dimeglumine or gadobutrol. On gadobutrol-enhanced images, the tumor presents with significantly stronger contrast enhancement, which allows better delineation of suspected anaplastic tumor from nonenhancing tumor areas and adjacent structures.
- Fig 11.
A, Sagittal scout MR image with the position of the sections in which perfusion information is acquired. B, Signal intensity–time curve from DSC MR imaging after a bolus injection of a single dose of contrast agent, with substantial signal intensity drop due to the susceptibility effect of the contrast medium. C and D, Signal intensity–time curves from different contrast medium concentrations at a triple dose: 28 mL of the 1.0 mol/L gadobutrol formulation (C) and 56 mL of a 0.5 mol/L gadobutrol formulation (D) in the putamen of the same subject. The susceptibility effect is significantly stronger by using a higher concentration of contrast medium. C and D, reprinted with permission from Radiology (2003;226:880–88). Copyright 2003, Radiological Society of North America.
- Fig 12.
A, Postcontrast T1-weighted MR image in a patient with a new appearance of a contrast-enhancing lesion in a formerly radiotherapeutically treated fibrillary astrocytoma. From conventional imaging sequences, one cannot differentiate treatment-related blood-brain barrier breakdown and malignization of the tumor. B, rCBF perfusion parameter image shows a highly perfused lesion, which was suspicious and later histologically confirmed as a high-grade tumor nodule within the low-grade astrocytoma.
- Fig 13.
Comparison of MR images by using gadobutrol at 0.1 and 0.2 mmol/kg. Single-dose (left) and double-dose (right) contrast-enhanced MR images in a patient with cerebral metastases. With the use of double-dose gadobutrol, one can detect substantially more lesions (circles) (see also Kim et al 201098) and lesions already visualized with an improved contrast and a better delineation.


Tables
Technique Application DTI and fiber tractography12,13 Biopsy guidance Determination of functionally eloquent tracts and surgical plan PWI14–24 DSC Differential diagnosis: tumor vs nontumoral lesions, primary vs metastatic lesions, tumor grading, tumor complications, treatment response, pseudoprogression DCE Differential diagnosis: tumor vs nontumoral tissue, tumor grading, treatment response, pseudoprogression DWI25,26 Differential diagnosis: tumor vs nontumoral lesions, tumor grading, treatment response ADC27,28 Glioma grading, differentiation of high cellularity lymphoma MRS29–33 Differential diagnosis: tumor vs nontumoral lesions, primary vs metastatic lesions, treatment response Blood oxygen level–dependent imaging34 Neuronal activity, surgical guidance Nuclear medicine, PET35 Biopsy guidance, treatment response, differential diagnosis: tumor recurrence vs radionecrosis Volumetric imaging36 Not widely available and implementable Standardization of Imaging Definitions Measurable and nonmeasurable disease for contrast-enhancing lesions Measurable disease: 2D contrast-enhancing lesions with clearly defined margins, with 2 perpendicular diameters of at least 10 mm, visible on ≥2 axial sections that are preferably, at most, 5 mm apart Nonmeasurable disease: either unidimensionally measurable lesions, masses with margins not clearly defined, or lesions with maximal perpendicular diameters <10 mm Multiple lesions A minimum of 2 (maximum of 5) largest lesions should be measured on the basis of the sum of products of perpendicular diameters Enhancing lesions are considered target lesions for evaluation of response Definition of progression ≥25% increase in sum of products of perpendicular diameters of enhancing lesions compared with smallest tumor measurement at reference scan (if no decrease) or best response after initiation of therapy Significant increase in T2/FLAIR nonenhancing lesion compared with reference scan or best response Clear progression of nonmeasurable disease Clear clinical deterioration Reference MR imaging Criteria for determining progression are dependent on the time from initial chemotherapy If obtaining the reference MR image immediately postoperative, MR imaging in the first 12 weeks may represent pseudoprogression and pseudoresponse If obtaining the reference scan after that initial 12-week period, then it reduces the likelihood of confusion with pseudoprogression Take note of enhancement outside radiation field; it may indicate progression (Fig 6) A reference MR image should ideally be obtained within 24–48 hours after surgery and no later than 72 hours after surgery, to avoid interpretation of postoperative changes as residual enhancing disease -
↵a Based on Wen et al 2010.67
-
- Table 3:
Standard protocol for brain tumor imaging based on expert panel discussion following the framework of the ACRIN 6686 component of the RTOG 0825 protocol73
Standardized MR imaging protocol 3-Plane localizer/scout (in order of acquisition) T1-weighted precontrast (spin-echo) T2-weighted axial FLAIR (optional to perform after contrast) T1 map (quantitation) for DCE MR imaging—3D gradient-echo T1 or 2D TSE/FSE T1a DWI and/or DTI (can extract DWI data trace/ADC from DTI)a T2* DSC MR imaging (after presaturation DCE MR imaging sequence)a T1-weighted postcontrast (spin-echo) Functional language, auditory, visual, motor testing, and MRSa Can do FLAIR before DSC MR imaging SWI, gradient-echo, additional optional sequencesa General parameter recommendations Section thickness not greater than 5 mm Delay is recommended, which can be built in by performing DWI and/or DTI before acquiring T1 sequences. Another option is to perform FLAIR (or even T2) before T1 sequences, which may give additional sensitivity for leptomeningeal disease74 Target duration ≤30 minutes (maximum, 1.5–2.0 hr) -
Note:—ACRIN indicates American College of Radiology Imaging Network; SWI, susceptibility-weighted imaging; RTOG = Radiation Therapy Oncology Group.
-
↵a Part of the ACRIN 6686 protocol but can be used as an adjunct in the clinical brain tumor protocol.
-
In this issue


Jump to section
Related Articles
Cited By...
- Preradiotherapy MR Imaging: A Prospective Pilot Study of the Usefulness of Performing an MR Examination Shortly before Radiation Therapy in Patients with Glioblastoma
- Exploring the Biomechanical Properties of Brain Malignancies and Their Pathologic Determinants In Vivo with Magnetic Resonance Elastography