
Abstract
BACKGROUND AND PURPOSE: The role of DCE-MR imaging in the study of bone marrow perfusion is only partially developed, though potential applications for routine use in the clinical setting are beginning to be described. We hypothesize that DCE-MR imaging can be used to discriminate between hypervascular and hypovascular metastases based on measured perfusion variables.
MATERIALS AND METHODS: We conducted a retrospective study of 26 patients using conventional MR imaging and DCE-MR imaging. Patients were assigned to a hypervascular or hypovascular group based on tumor pathology. ROIs were drawn around normal-appearing bone marrow (internal controls) and enhancing tumor areas. Average wash-in enhancement slope, average peak enhancement signal percentage change, and average peak enhancement signal percentage change in areas of highest wash-in enhancement slope were calculated. Indices were compared among control, hypervascular, and hypovascular groups. Conventional imaging was assessed by calculating pre- to postgadolinium signal percentage changes in hypervascular and hypovascular lesions.
RESULTS: Hypervascular and hypovascular tumors differed significantly with regard to wash-in enhancement slope (P < .01; hypervascular 95% CI, 22.5–26.5 AU/s; hypovascular 95% CI, 14.1–20.9 AU/s) and peak enhancement signal percentage change in areas of highest wash-in enhancement slope (P < .01; hypervascular 95% CI, 174.1–323.3%; hypovascular 95% CI, 39.5–150.5%). Peak enhancement signal percentage change over all voxels was not significant (P = .62). Areas of normal-appearing marrow showed no appreciable contrast enhancement. Conventional contrast-enhanced MR imaging was unable to differentiate between hypervascular and hypovascular tumors (P = .58).
CONCLUSIONS: Our data demonstrate that, unlike conventional MR imaging sequences, DCE-MR imaging may be a more accurate technique in discriminating hypervascular from hypovascular spinal metastases.
ABBREVIATIONS:
- CI
- confidence interval
- DCE
- dynamic contrast-enhanced
- SE
- standard error
- SI
- signal intensity
- signalbase
- baseline value
- signalmax
- maximum signal intensity
- STIR
- short τ inversion recovery
- timerise
- contrast enhancement rise time
- TIC
- time intensity curve
Conventional imaging of spinal column lesions is currently accomplished with static T1-, T2-, and STIR-weighted MR imaging.1⇓⇓–4 These techniques, though offering valuable insight into gross characteristics, also possess limitations, especially with regard to describing physiologic characteristics of malignant lesions.1,2,4 For example, static imaging is inadequate in assessing diagnostically challenging spinal lesions, such as those surrounded by abundant fatty bone marrow, predominantly red marrow, or marrow affected by cancer-related processes such as fibrosis, infarction, edema, and infection.5 Furthermore, before a malignant bone marrow lesion becomes apparent on conventional imaging, it must replace enough normal marrow cells to cause local alteration of T1, T2, and STIR signal intensities. As such, a static image may convey false-negative results when in fact a small or early lesion is present.5
DCE-MR imaging, on the other hand, depends on contrast medium kinetics and offers the advantage of providing physiologic and hemodynamic information.6 DCE-MR imaging may therefore be able to detect tumor neovasculature before a small lesion becomes apparent on conventional MR imaging.5 Objective evaluation of tumor vascularity can be accomplished by creating TICs and measuring the pharmacokinetics of the contrast agent during and immediately after the first pass.7 Various perfusion indices can be derived from these data, such as time of onset of enhancement, wash-in slope, washout slope, time-to-peak, and peak enhancement signal percentage change. Many have studied the possibility of unique TICs for different pathologies, but conclusions have been equivocal, partly due to assumptions of homogeneity within the lesions.8,9
DCE-MR imaging is currently widely established for the study of brain perfusion, including the classification of tumors such as glioblastoma multiforme.10,11 Numerous studies reveal the potential role for DCE-MR imaging in the diagnosis, treatment, and management of diseases outside the brain as well. For example, DCE-MR imaging is able to differentiate between benign and malignant lesions in both vertebral and nonvertebral bone marrow.5,8,9,12⇓⇓⇓–16 There is also evidence that perfusion studies can differentiate osteoporotic compression fractures from pathologic fractures.8,9 Furthermore, the ability of DCE-MR imaging to monitor tumor response to chemotherapy and radiation, as well as to detect areas of viable tumor before resection, has also been described.17,18
The potential role for DCE-MR imaging to differentiate between various types of metastatic lesions, however, has not yet been studied. An ability to do so would help to noninvasively narrow the differential for potential primary tumor sites, to individualize treatment, and to better predict prognostic outcomes. Given that the primary sources of metastatic lesions confer specific vascular characteristics, we hypothesize that DCE-MR imaging should be able to differentiate between hypervascular and hypovascular metastatic lesions via the study of various perfusion parameters and the creation of TICs that incorporate information about tumor heterogeneity.
Materials and Methods
Patients
This study was approved by our institutional review board for retrospective review and was fully compliant with Health Insurance Portability and Accountability Act regulations. Over the course of 2 years (April 2008 to June 2010), 26 consecutive subjects (13 men, 13 women, age range 38–80 years, mean = 57 years) who were referred for preliminary MR examination and nuclear scintigraphy of the spine for routine clinical care were retrospectively studied. Patients were known to the clinical service. Lesions were all newly diagnosed and never previously followed. The patients were assigned to either a hypervascular tumor group (renal, thyroid) or hypovascular tumor group (breast, prostate, multiple myeloma, gastric, uterine leiomyosarcoma) based on pathology of the primary tumor (Tables 1 and 2). All patients had confirmed pathologic diagnoses of their primary tumors and 88.5% (23/26) had biopsy-proved diagnoses of their spinal metastases at the time of initial diagnosis of spinal disease. The remaining 11.5% (3/26) had nonvertebral bone biopsies and were presumed to have diagnoses consistent with their primary tumor. The hypervascular tumor group included 9 patients (8 men, 1 woman, age range 43–75 years, mean age 57 years). The hypovascular tumor group included 17 patients (5 men, 12 women, age range 38–80 years, mean age 57 years). All measured lesions were greater than 1 cm in diameter to facilitate region-of-interest placement and avoid partial volume averaging artifact. Exclusion criteria included patients with spinal fixation hardware (due to extensive paramagnetic susceptibility artifacts) and prior radiation therapy.
Demographics for patients with hypervascular tumors
Demographics for patients with hypovascular tumors
MR Imaging
MR imaging studies of the spine were acquired with a 1.5T scanner (GE Healthcare, Milwaukee, Wisconsin) using a phased array coil for the entire spine.
DCE-MR imaging of the lumbar spine was acquired as follows: a bolus of gadolinium-diethylenetriamine penta-acetic acid was administered at 0.1 mmol/kg body weight (1 mL of contrast for every 4.5 kg of body weight, with a maximum dose of 20 mL) at a rate of 2–3 mL/s by a power injector. This injection rate was determined by the size of the IV needle (22 g) placed in patients. The nature of patients' medical conditions and treatment regimens precluded the use of larger IV needles needed for faster infusion rates. The contrast bolus was followed by 40 mL of normal saline. The kinetic enhancement of tissue during and after injection of gadolinium-diethylenetriamine penta-acetic acid was obtained by using a T1-weighted fast gradient-echo sequence (30 phases, TR 4–5 ms, TE 1–2 ms, temporal resolution 6.2 seconds, section thickness 4–5 mm, flip angle 30, FOV 34–36 cm) and consisted of 10–15 images in the sagittal plane.
As a standard of care, routine MR imaging sequences were also obtained before and after dynamic images were acquired, including 1) sagittal T1 (FOV 32–36 cm, section thickness 3 mm, TR 400–650 msec, TE minimum full) and T2 (FOV 32–36 cm, section thickness 3 mm, TR 3500–4000 msec, TE 102–115 msec); 2) axial T1 (FOV 18 cm, section thickness 8 mm, TR 500–650 msec, TE minimum full) and T2 (FOV 18 cm, section thickness 8 mm, TR 3000–4000 msec, TE 102 msec); 3) sagittal STIR (FOV 32–36 cm, section thickness 3 mm, TR 3500–6000 msec, TE 40 msec); 4) sagittal T1 postgadolinium (FOV 32–36 cm, section thickness 3 mm, TR 400–650 msec, TE minimum full); 5) axial T1 postgadolinium (FOV 18 cm, section thickness 8 mm, TR 500–650 msec, TE minimum full); and 6) sagittal STIR (FOV 32–36 cm, section thickness 3 mm, TE 40 msec, TR 3500–6000 msec, inversion recovery 150 msec).
Data Analysis: Setup
The acquired data were initially preprocessed with AFNI software (http://afni.nimh.nih.gov/afni/): The data were spatially and temporally smoothed to improve signal to noise ratio and to reduce high frequency noise, respectively.19
ROIs for all scans were drawn by a Certificate of Added Qualification–certified neuroradiologist with 15 years of experience. All sequences (T1, T2, STIR, and postcontrast images) were used for optimal region of interest placements. Meticulous care was taken to make ROIs large enough to encompass most of the lesion, while at the same time excluding lesion margins, normal-appearing marrow, endplates, degenerative changes, and vessels (including the basivertebral venous plexus). All evaluators involved in data processing and placing ROIs were blinded to the patients' clinical diagnoses.
A control group was created within the hypervascular and hypovascular tumor groups by studying 1 region of normal-appearing bone marrow per patient. The control group therefore consisted of 26 samples (9 normal-appearing regions from hypervascular patients, 17 from hypovascular patients). Neither the metastatic lesions nor the normal-appearing regions in these patients were previously irradiated.
Data Analysis: Calculations
Automated processing of the dynamic images was performed using MatLab (MathWorks, Natick, Massachusetts).20 Two perfusion indices were calculated on a voxel-by-voxel basis for each patient: 1) wash-in enhancement slope ([signalmax − signalbase]/timerise); and 2) peak enhancement signal percentage change ([signalmax − signalbase]/signalbase × 100%).
Per patient, the data were averaged over all of the voxels in the region of interest to calculate the “average wash-in enhancement slope” and “average peak enhancement signal percentage change.” In addition, a separate average peak enhancement signal percentage change was calculated for each patient by examining only the voxels that corresponded to a wash-in enhancement slope >40 AU/s (defined as “threshold 4,” as described below in Data Analysis: Creating MR Perfusion Maps and Time Intensity Curves Separated by Slope). This variable was named the “average peak enhancement signal percentage change in threshold 4.” These 3 variables were then averaged within the hypervascular and hypovascular groups for Wilcoxon rank sum testing. Statistical significance was set at P < .05.
In addition, conventional imaging was assessed in the hypervascular and hypovascular groups by calculating the pre- to postgadolinium signal intensity percentage change ([Postcontrast Signal Intensity − Precontrast Signal Intensity]/[Precontrast Signal Intensity] × 100%). Care was taken to place the ROIs on the T1 pre- and postcontrast images to correspond with the region-of-interest measurements of the dynamic images. Statistical analysis comparing hypervascular and hypovascular groups was conducted using a Wilcoxon rank sum test. To check for correlation with dynamic indices, static data were compared with dynamic data using linear regression and Spearman rank sum testing.
Data Analysis: Creating MR Perfusion Maps and Time Intensity Curves Separated by Slope
Standard TICs were created for the control group and were subjectively compared with the TICs for hypervascular and hypovascular groups. TICs broken down by slope were also created for all hypervascular and hypovascular lesions as follows.
Voxels were assigned to a threshold group based on the wash-in enhancement slope value: threshold 1 = blue (5 < slope (m) <10), threshold 2 = green (10 < m <25), threshold 3 = yellow (25 < m <40), and threshold 4 = red (m >40).
The wash-in enhancement slopes for all of the voxels within a given threshold category were averaged to create 1 TIC. In this way, for each tumor, a graph was created with up to 4 TICs representing different slope thresholds. MR perfusion maps were created similarly, with areas color-coded according to wash-in enhancement slope thresholds.
Results
Patients
Demographic and tumor classification information for the hypervascular and hypovascular groups is shown in Tables 1 and 2. Patients in the different groups were similar based on age range (mean age of 57 years in both groups) and spinal levels (T11-S1, with most from the lumbar spine in both groups). Sex distribution, however, was dissimilar, with most of the hypervascular patients being male (8 of 9) and most of the hypovascular patients being female (12 of 17).
Perfusion Data (TICs, MR Perfusion Maps, Perfusion Parameters)
The control group data, consisting of normal-appearing marrow in patients with vertebral body metastases at other spinal levels, showed no appreciable subjective contrast enhancement or STIR abnormality. However, all lesions in the hypovascular and hypervascular groups showed various degrees of contrast enhancement above baseline. Standard TICs comparing normal-appearing bone marrow and infiltrated bone marrow are represented in Fig 1. Normal-appearing marrow and infiltrated marrow could clearly be differentiated based on whether contrast uptake was observed.

Standard time intensity curves without slope separation for a spinal lesion and for an area of normal-appearing marrow in a patient with hypervascular metastases. Normal-appearing marrow demonstrates the typical appearance of a TIC for normal marrow (no discernible change in signal intensity).
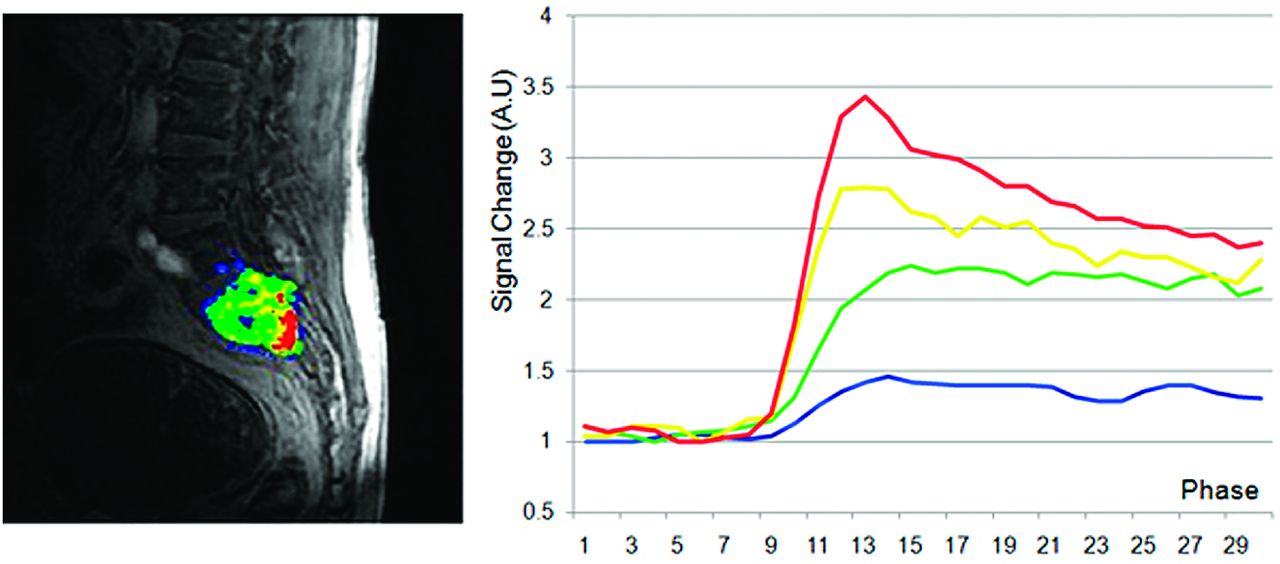
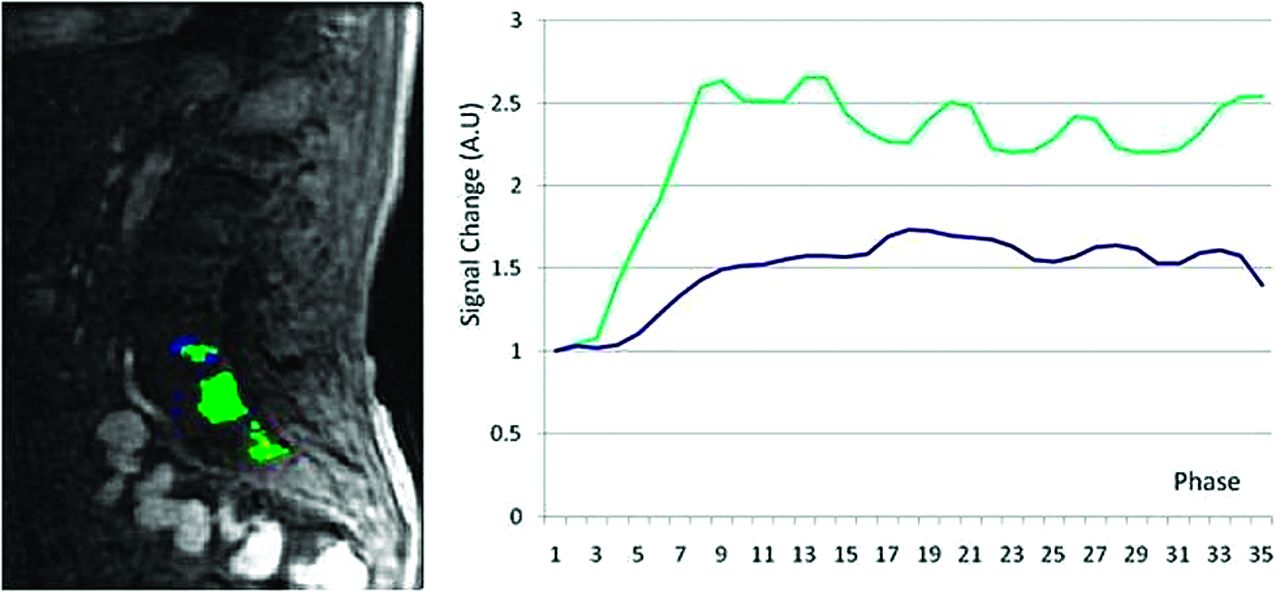
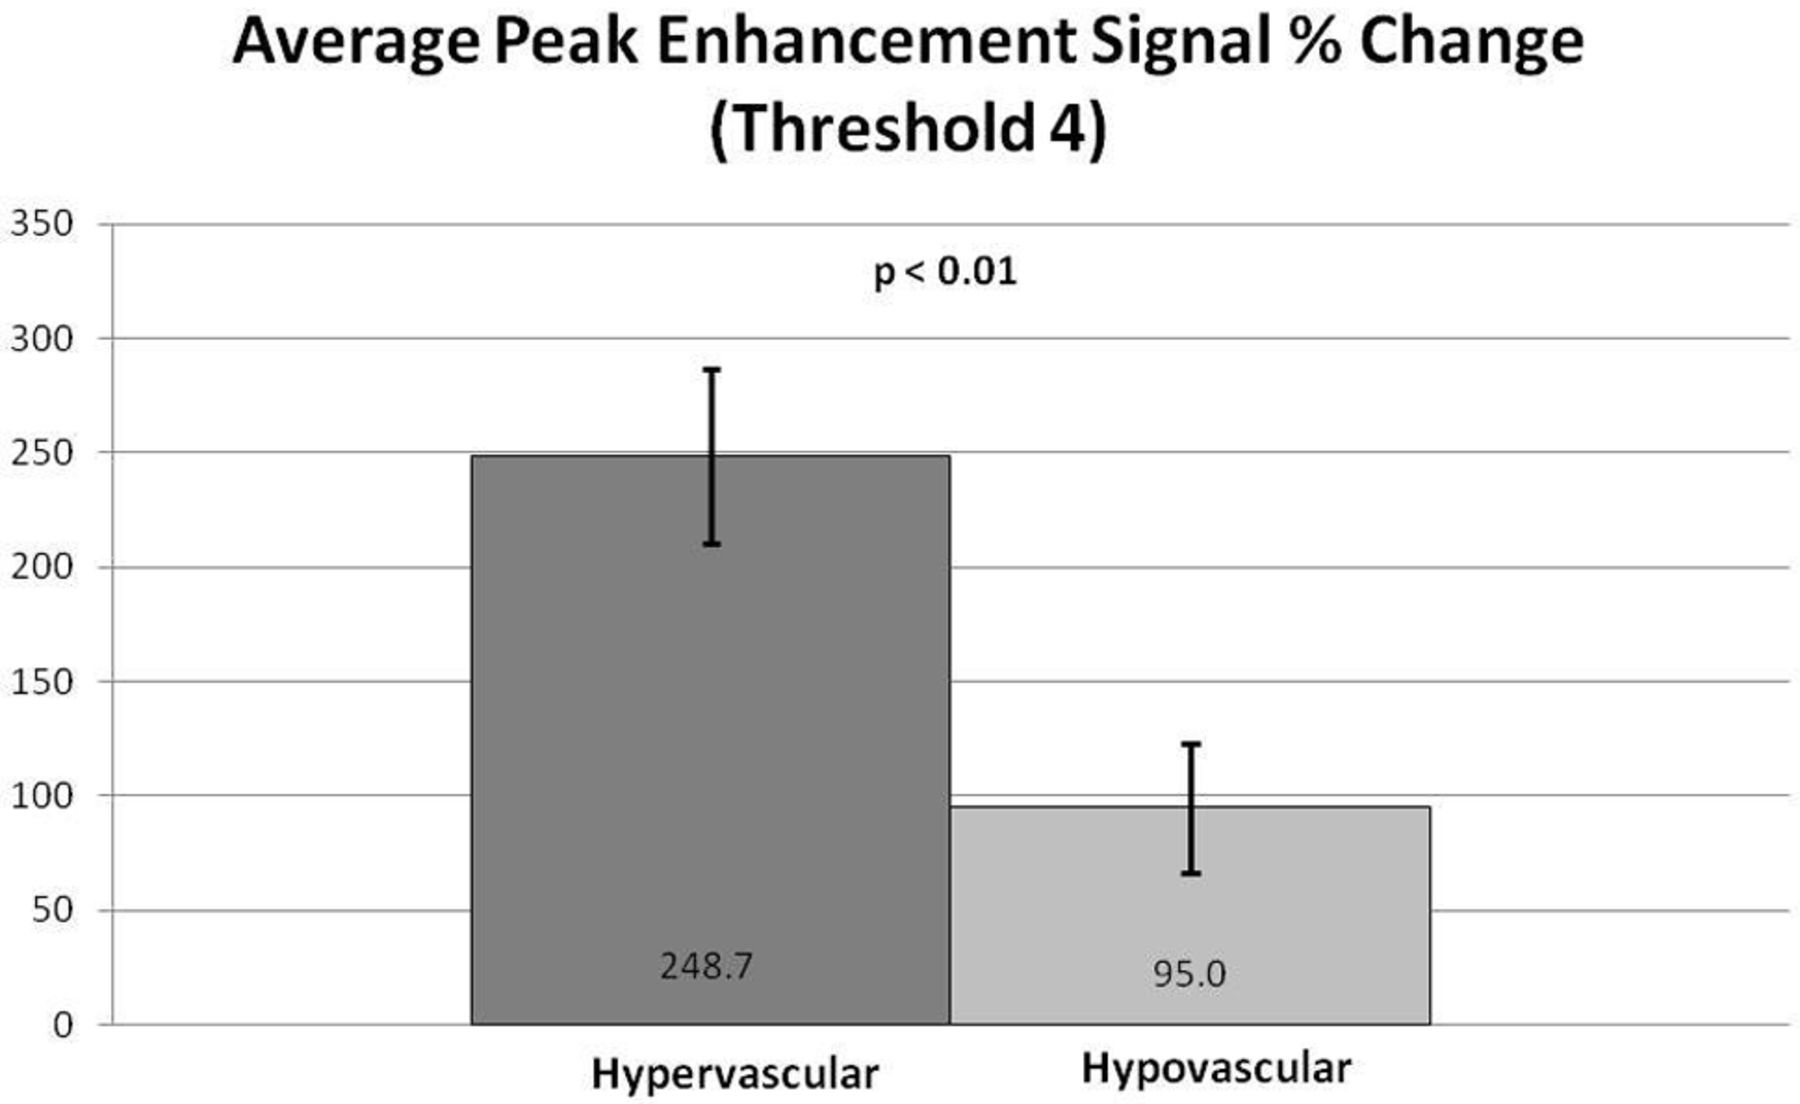
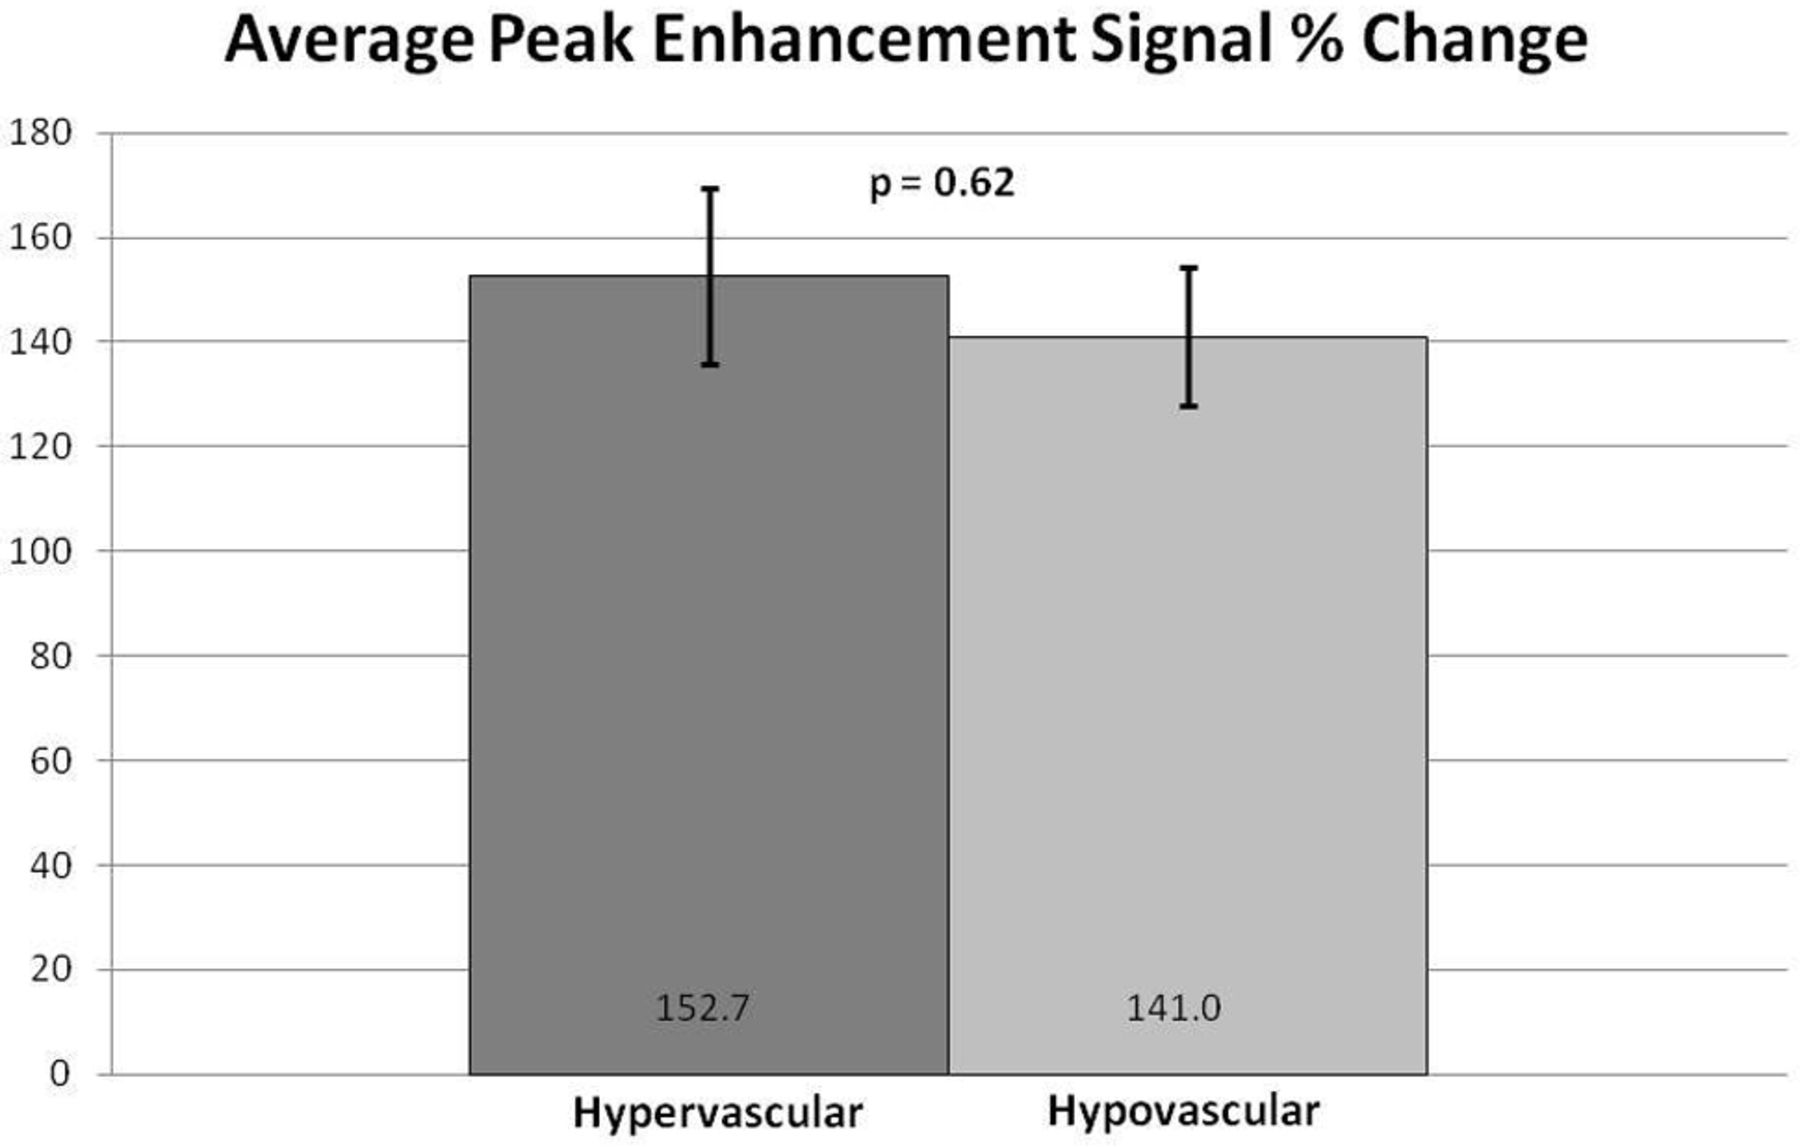
Subjectively, TICs for hypervascular tumors, broken down by slope, showed higher signal intensities for the higher slope threshold curves, and MR perfusion maps were more represented by high threshold regions compared with hypovascular tumors (Figs 2 and 3). This difference was objectively confirmed when calculating perfusion indices. Statistical significance was found for average wash-in enhancement slope (P < .01); mean values for hypervascular and hypovascular tumors were 24.5 AU/s (SD 3.06, SE 1.02, 95% CI 22.5–26.5) and 17.5 AU/s (SD 7.20, SE 1.75, 95% CI 14.1–20.9), respectively. Statistical significance was also found for average peak enhancement signal percentage change in threshold 4 (P < .01); mean values for hypervascular and hypovascular tumors were 248.7% (SD 114.2%, SE 38.1%, 95% CI 174.1–323.3%) and 95.0% (SD 116.8%, SE 28.3%, 95% CI 39.5–150.5%), respectively (Figs 4–5). The average peak enhancement signal percentage change over all voxels was not found to be significant (P = .62); mean values for hypervascular and hypovascular tumors were 152.7% (SD 50.3%, SE 16.8%, 95% CI 119.8–185.6%) and 141.0% (SD 55.0%, SE 13.3%, 95% CI 114.9–167.1%), respectively (Fig 6).

MR perfusion map with corresponding DCE-MR imaging time intensity curves separated by slope thresholds in a hypervascular lesion. Slope thresholds are assigned as follows: blue = 5 < slope ≤10; green = 10 < slope ≤25; yellow = 25 < slope ≤40; red = slope >40.

MR perfusion map with corresponding DCE-MR imaging time intensity curves separated by slope thresholds in a hypovascular lesion. Slope thresholds are assigned as follows: blue = 5 < slope ≤10; green = 10 < slope ≤25; yellow = 25 < slope ≤40; red = slope >40.

Comparison of total average slope between hypervascular and hypovascular lesions. Averages and standard error bars are shown, and statistical significance is set at P < .05. The 95% CI for hypervascular and hypovascular groups: 24.5 ± 2.00 [22.5, 26.5] and 17.5 ± 3.42 [14.1, 20.9] AU/s, respectively.

Comparison of average peak enhancement signal percentage (%) change for threshold 4. Averages and standard error bars are shown, and statistical significance is set at P < .05. The 95% CI for hypervascular and hypovascular groups: 248.7 ± 74.6 [174.1, 323.3] and 95.0 ± 55.5 [39.5, 150.5], respectively.

Comparison of average peak enhancement signal percentage (%) change between hypervascular and hypovascular lesions. Averages and standard error bars are shown, and statistical significance is set at P < .05. The 95% CI for hypervascular and hypovascular groups: 152.7 ± 32.9 [119.8, 185.6] and 141.0 ± 26.1 [114.9, 167.1], respectively.
Static MR Imaging versus Dynamic MR Imaging
Pre- to postgadolinium signal intensity percentage increase on static sagittal T1-weighted images showed no statistically significant difference between hypervascular and hypovascular groups (P = .58; 91.8 and 282.4% for hypervascular and hypovascular tumors, respectively). In addition, comparing dynamic perfusion indices with the static pre- to postgadolinium signal intensity percentage increase, no strong correlation was found for either hypovascular or hypervascular tumors. For hypervascular tumors, R2 values for correlation with average slope, average peak enhancement signal percentage change, and average peak enhancement signal percentage change in threshold 4 were as follows: 0.157, 0.008, and 0.004, respectively (Spearman rank sum test results were as follows: 0.53, 0.46, and 0.62, respectively). For hypovascular tumors, the values were 0.002, 0.016, and 0.015, respectively (Spearman rank sum test results were as follows: 0.67, 0.63, and 0.11, respectively). Even when outliers were removed from the statistical analysis, no statistically significant difference was found between hypervascular and hypovascular groups (P = .48). In addition, there continued to be no correlation between static pre- to postgadolinium signal intensity percentage increase and dynamic perfusion indices. For hypervascular tumors, R2 values for correlation with average slope, average peak enhancement signal percentage change, and average peak enhancement signal percentage change in threshold 4 were as follows: 0.071, 0.271, and 0.266, respectively (Spearman rank sum test results were as follows: 0.94, 0.17, and 0.17, respectively). For hypovascular tumors, the values were as follows: 0.032, 0.288, and 0.473, respectively (Spearman rank sum test results were as follows: 0.50, 0.33, and 0.08, respectively).
Discussion
The results of this study allow several conclusions to be considered. First, it is suggested that DCE-MR imaging may be able to subjectively differentiate between metastatic bone marrow lesions and normal-appearing bone marrow via the creation of standard TICs. Evaluation of the lesions in this study also suggests that DCE-MR imaging may show differences between hypervascular and hypovascular spinal tumors, both subjectively (via TICs broken down by slope and perfusion maps) and objectively (via analysis of certain perfusion parameters). Finally, conventional contrast-enhanced MR imaging, unlike DCE-MR imaging, does not seem to show an objective difference between hypervascular and hypovascular metastases.
Perfusion Data: Benign versus Malignant Bone Marrow
Our data suggest that DCE-MR imaging is able to subjectively differentiate between normal-appearing and infiltrated bone marrow, a finding substantiated by previous studies.5,12⇓⇓⇓–16,21 Normal-appearing marrow in our study demonstrated no meaningful change in signal intensity with respect to the baseline (ie, differentiation of true signal from background noise was not possible); this behavior is typical for normal marrow (Fig 1).13 In addition, no appreciable STIR abnormality was detected. On the contrary, hypervascular and hypovascular lesions showed various degrees of STIR abnormality and enhancement above baseline.
Given the lack of appreciable enhancement in control areas, analysis for statistical significance could not be conducted (any value compared with zero gives an infinitesimally small P value). However, our data indicate that differentiation between controls and malignant lesions can still be made via subjective evaluation of contrast uptake relative to the baseline signal.
Although it was not possible to tell if micrometastases were present in the selected regions of normal-appearing marrow, the authors believe that even if such lesions were present, the hemodynamics would not be altered in any substantial manner to influence MR perfusion. This was ultimately a nonissue in our controls, given the lack of any appreciable contrast enhancement.
Perfusion Data: Hypervascular versus Hypovascular Lesions
Our data showed, for the first time, that DCE-MR imaging may show differences between hypervascular and hypovascular spinal tumors, both subjectively and objectively. Subjectively, we showed that TICs separated by slope threshold are markedly different in hypervascular versus hypovascular tumors (Figs 2 and 3). The TIC for voxels within threshold 4 (red line) shows subjectively higher signal intensity in the hypervascular group compared with the hypovascular group. This novel approach to creating TICs incorporates information regarding inherent tumor heterogeneity. Subjective evaluation of MR perfusion maps also differentiated between hypervascular and hypovascular metastases, showing larger areas of high wash-in enhancement slope in hypervascular lesions (depicted by red areas on the images).
Objective data gathered from calculated perfusion indices appears to confirm the subjective evaluation. Wash-in enhancement slope and peak enhancement signal percentage change in threshold 4 differentiated between hypervascular and hypovascular metastases, both with statistical significance. Although our data showed large standard deviations resulting in overlapping ranges between hypervascular and hypovascular groups (see “Limitations” section), the average wash-in enhancement slope and peak enhancement signal percentage change in threshold 4 had nonoverlapping ranges for standard errors and confidence intervals. Furthermore, cutoff values separating hypervascular and hypovascular lesions may be assigned for wash-in enhancement slope and peak enhancement signal percentage change in threshold 4. For wash-in enhancement slope, a cutoff value of 21 AU/s may be considered, for which anything below is suggestive of a hypovascular lesion and anything above a hypervascular lesion. Similarly, for peak enhancement signal percentage change in threshold 4, a value below 151% is suggestive of a hypovascular lesion, a value above 174% is suggestive of a hypervascular lesion, and anything in between is equivocal.
The lack of statistical significance for peak enhancement signal percentage change over all voxels may be due to a few reasons. First, our sample size was small; with higher power, perhaps statistical significance could have been shown. Second, as shown by our TICs broken down by slope, individual tumors were heterogeneous, and analyzing all voxels at once may have prevented any statistical significance. However, when examining the peak enhancement signal percentage change only in regions of highest uptake (threshold 4), making the samples more homogeneous, we found a statistically significant difference between the hypervascular and hypovascular groups.
Conventional MR Imaging in the Assessment of Tumor Vascularity
As others suggest, conventional MR imaging is inadequate for use in diagnostically challenging cases, especially in patients with cancer in whom bone marrow is often affected by processes such as fibrosis, infarction, edema, pathologic compression fractures, and infection.5 In addition, interpretation of static imaging in the assessment of tumor vascularity is, at best, a subjective technique. Postgadolinium images are obtained at nonstandardized time points, and the represented cross-section of time does not reflect contrast uptake dynamics. A postgadolinium image taken during the wash-in phase may not, for example, reflect the complete uptake potential of a tumor.
Even though we used a more objective model examining signal intensity percentage change from pre- to postgadolinium images, there was still no statistically significant difference between hypervascular and hypovascular groups (P = .58). In addition, no strong correlation was found between the signal intensity percentage change and dynamic perfusion indices, furthering the argument that static imaging is not able to characterize tumor vascularity. These relationships continued to hold true when outliers were removed.
The lack of a relationship between DCE and static MR imaging may be due to timing issues, as DCE-MR imaging and postcontrast static imaging were performed at least 10–12 minutes apart. The effects of washout and recirculation probably contributed to the observed discrepancy.
Implications
Perhaps one of the most important clinical applications of DCE-MR imaging is in individualization of patient care. The ability of DCE-MR imaging to monitor the response to chemotherapy allows for the early detection of treatment failure, rapid institution of a treatment strategy change, and the potential for improved patient outcomes.17,18 This ability is important in light of the approximate 2.5%–11% recurrence rate seen in spinal metastases.22 In addition, as van der Woude et al17 showed, DCE-MR imaging is able to detect viable tumor areas before surgical resection.
In our study, we develop the role of DCE-MR imaging further by suggesting that it may be used to characterize metastatic lesions based on vascularity. With this ability, one can narrow down possible primary tumor sites and potentially eliminate the need for routine invasive biopsies (the current reference standard). Identifying the primary tumor site can be especially important in patients with coexisting malignancies, as has been shown to be a problem both in brain and spinal metastases.23⇓–25 In general, cancer patients are also more prone to developing second malignancies.26,27
Furthermore, when selecting a treatment option, understanding physiologic characteristics of the lesion can be helpful for treatment optimization. Lesion sensitivity to radiation therapy and chemotherapy, for example, is often a consideration in the management of metastatic lesions.24,28,29 In addition, in certain cases, the vascularity of a tumor can determine the type of antineoplastic treatment that is selected.30,31
Limitations
Study limitations included small sample size and the inclusion of only selected regions with the manual placement of ROIs. In addition, most patients in both the hypovascular and hypervascular groups were either previously treated with chemotherapy or receiving treatment at the time of scanning. This could not be avoided due to the nature of the clinical illnesses present in this study.
Further limitations include the wide ranges of standard deviations seen with the calculated perfusion variables. These ranges are most likely attributable to tumor heterogeneity, as well as small sample sizes. However, nonoverlapping standard error ranges and confidence intervals for the statistically significant perfusion variables (average wash-in enhancement slope and average peak enhancement signal percentage change in threshold 4) add credibility to our data.
Bone marrow perfusion is dependent on many variables, and most studies agree that spinal perfusion decreases with age (especially in females), higher fat content in the marrow, and lower spinal levels.6,12,20,32⇓–34 Subjects in our control, hypervascular, and hypovascular groups were similar in age range and spinal level involvement. However, the hypervascular cohort was predominantly male and the hypovascular cohort was predominantly female. Although we feel these sex differences did not confound our data, to completely eliminate this concern, we recommend that follow-up studies include a more diverse cohort.
A full pharmacokinetic model was not used because, at the time of our study, no FDA-approved software was available for use. However, previous literature has shown the successful use of homemade programs.20 We are currently exploring more advanced pharmacokinetic models for future studies.
The typical challenges associated with MR imaging, such as field inhomogeneity, susceptibility artifacts, geometric distortion, fast versus slow compartment exchange, T2* effect in T1-weighted DCE-MR imaging, and respiratory and cardiac pulsation artifacts could not be avoided and potentially limited DCE evaluation of the spine.
Future Directions
Future studies using a larger sample size will need to be carried out to verify our results, perhaps by including more perfusion parameters, such as area under the curve, wash-in rate constant (Ktrans), and plasma volume (Vp). In addition, further characterization may be possible within the hypervascular and hypovascular groups. For example, does a renal metastasis have different perfusion characteristics compared with a thyroid metastasis? DCE-MR imaging may also have applications in predicting which cancer patients will fail chemotherapy or radiation treatment. Finally, DCE-MR imaging may play a role in the study of new antiangiogenic agents for bone marrow disease.
Conclusions
Certain DCE-MR imaging perfusion variables, including wash-in enhancement slope and peak enhancement signal percentage change in regions of highest wash-in slope, may show differences between hypervascular and hypovascular metastatic lesions of the spine. For wash-in enhancement slope, a threshold value of 21 AU/s may be considered, for which anything below is suggestive of a hypovascular lesion, and anything above, a hypervascular lesion. Similarly, for peak enhancement signal percentage change in regions of highest wash-in slope, a value below 151% is suggestive of a hypovascular lesion and a value above 174% is suggestive of a hypervascular lesion. Further studies using larger sample sizes are needed to substantiate these results. Finally, DCE-MR imaging appears to be superior to conventional MR imaging at characterizing lesion vascularity, thereby making it a more accurate technique for the diagnosis, monitoring, and follow-up of patients with metastatic disease.
Acknowledgments
We thank Thomas Mair for his help with the MR imaging protocols.
Footnotes
This research was supported by an internal grant from the Department of Radiology, Memorial Sloan-Kettering Cancer Center.
Disclosures: Yoshiya Yamada—UNRELATED: Board Membership: American Brachytherapy Society, Comments: Reimbursed for costs of travel to attend board meetings, no other compensation; Consultancy: Varian Medical Systems, Comments: Consultant, less than $5000 per year; Payment for Lectures (including service on speakers bureaus): Institute for Medical Education, Comments: Speakers bureau for CME meetings. Mark Bilsky—UNRELATED: Royalties: Depuy Spine, Comments: Less than $2000 per year.
References
- Received December 21, 2011.
- Accepted after revision February 13, 2012.
- © 2012 by American Journal of Neuroradiology
In this issue


Jump to section
Related Articles
Cited By...
- Comprehensive Review of the Utility of Dynamic Contrast-Enhanced MRI for the Diagnosis and Treatment Assessment of Spinal Benign and Malignant Osseous Disease
- Assessing Vascularity of Osseous Spinal Metastases with Dual-Energy CT-DSA: A Pilot Study Compared with Catheter Angiography
- Differentiating Atypical Hemangiomas and Metastatic Vertebral Lesions: The Role of T1-Weighted Dynamic Contrast-Enhanced MRI