
Abstract
BACKGROUND AND PURPOSE: Invasive cerebral DSA has largely been replaced by CTA, which is noninvasive but has a compromised arterial view due to superimposed bone and veins. The purpose of this study was to evaluate whether arterial visualization in CTPa is superior to standard CTA, which would eliminate the need for an additional CTA scan to assess arterial diseases and therefore reduce radiation dose.
MATERIALS AND METHODS: In this study, we included 24 patients with subarachnoid hemorrhage for whom CTA and CTP were available. Arterial quality and presence of superimposed veins and bone in CTPa were compared with CTA and scored by 2 radiologists by using a VAS (0%–100%). Average VAS scores were determined and VAS scores per patient were converted to a 10-point NRS. Arterial visualization was considered to be improved when the highest rate (NRS 10, VAS > 90%) was scored for arterial quality, and the lowest rate (NRS 1, VAS < 10%), for the presence of superimposed veins and bone. A sign test with continuity correction was used to test whether the number of cases with these rates was significant.
RESULTS: Average VAS scores in the proximal area were 94% (arterial quality), 4% (presence of bone), and 7% (presence of veins). In this area, the sign test showed that a significant number of cases scored NRS 10 for arterial quality (P < .02) and NRS 1 for the presence of superimposed veins and bone (P < .01).
CONCLUSIONS: Cerebral CTPa shows improved arterial visualization in the proximal area compared with CTA, with similar arterial quality but no superimposed bone and veins.
ABBREVIATIONS:
- ACA
- anterior cerebral artery
- CTPa
- CTP-derived arteriograms
- HU
- Hounsfield units
- MPR
- multiplanar reformations
- NRS
- numeric rating scale
- PCA
- posterior cerebral artery
- VAS
- visual analog scale
DSA remains the criterion standard for the assessment of arterial disease, such as for the detection of cerebral aneurysms in patients with SAH. DSA presents a clear arterial view (only arteries, no bone and veins) but is time-consuming, and due to its invasive nature, there is a risk of complications.1,2 Therefore, noninvasive CTA has largely replaced DSA for arterial assessment in clinical practice. Multiple studies2⇓⇓⇓⇓–7 have shown good results for the evaluation of intracranial aneurysms on CTA. A recent review and meta-analysis study7 reported a 98% pooled sensitivity and 100% specificity of CTA for the diagnosis of cerebral aneurysms in patients with acute SAH at presentation. However, this study and other studies3,4,6 also reported that the detection of aneurysms adjacent to the skull base remains a challenging issue in CTA, due to the presence of overlying bone structures and complex vascular anatomy, which could result in missing relevant aneurysms.4,6 Thus in contrast to DSA, CTA has a compromised arterial view due to superimposed bone and veins. The use of CTP scans for the diagnosis in patients with SAH has increased rapidly in recent years.8 In our institution, patients with SAH routinely undergo both CTP and CTA as part of their pretherapeutic diagnostic work-up. The purpose of this study was to evaluate whether CTPa could improve arterial visualization compared with CTA, by showing comparable arterial quality with little or no overlying bone and veins. If the arterial quality of CTPa proves similar to that of CTA, CTPa has the potential to extend the diagnostic yield of CTP scans, which might eliminate the need for an additional CTA scan, thereby reducing radiation dose.
Materials and Methods
Patient Selection
This study was conducted in accordance with the guidelines and after approval of our institutional review board. Informed consent was waived in accordance with local legislation regarding retrospective studies. We identified all consecutive patients with subarachnoid hemorrhage from August 2007 to March 2008 at our department who fulfilled the following inclusion criteria: 1) the CTP acquisition included the circle of Willis region, 2) the corresponding CTA was acquired during the arterial phase with contrast timing derived from the CTP scan according to clinical protocol, and 3) there were no clips or coils from prior therapy present in the examination area. Cerebral CTA and CTP scans from 24 patients were included.
Image Acquisition
Contrast material (iopromide, Ultravist, 300 mg iodine/mL; Schering, Berlin, Germany) was injected at 5 mL/s into the cubital vein (CTP, 40 mL; CTA, 50 mL). CTP source data were derived from sequential scans (220-mm FOV, UB filter) acquired on a 64-section CT scanner (Brilliance; Philips Healthcare, Best, the Netherlands) every 2 seconds during 60 seconds, covering a slab of 4-cm thickness at the height of the circle of Willis by using a scan angulation. Thin 0.625-mm sections were reconstructed, resulting in a 4D dataset (512 × 512 × 64 × 30) with near-isotropic voxel sizes (0.429 × 0.429 × 0.625 mm). Both CTP and CTA scans were acquired with 80 kV(peak), rotation time of 0.4 second, and standard resolution. The CTA scan was acquired by using 300 mAs, a pitch of 0.672 mm, and filter B. The CTP scan was acquired by using 150 mAs.
Image Processing
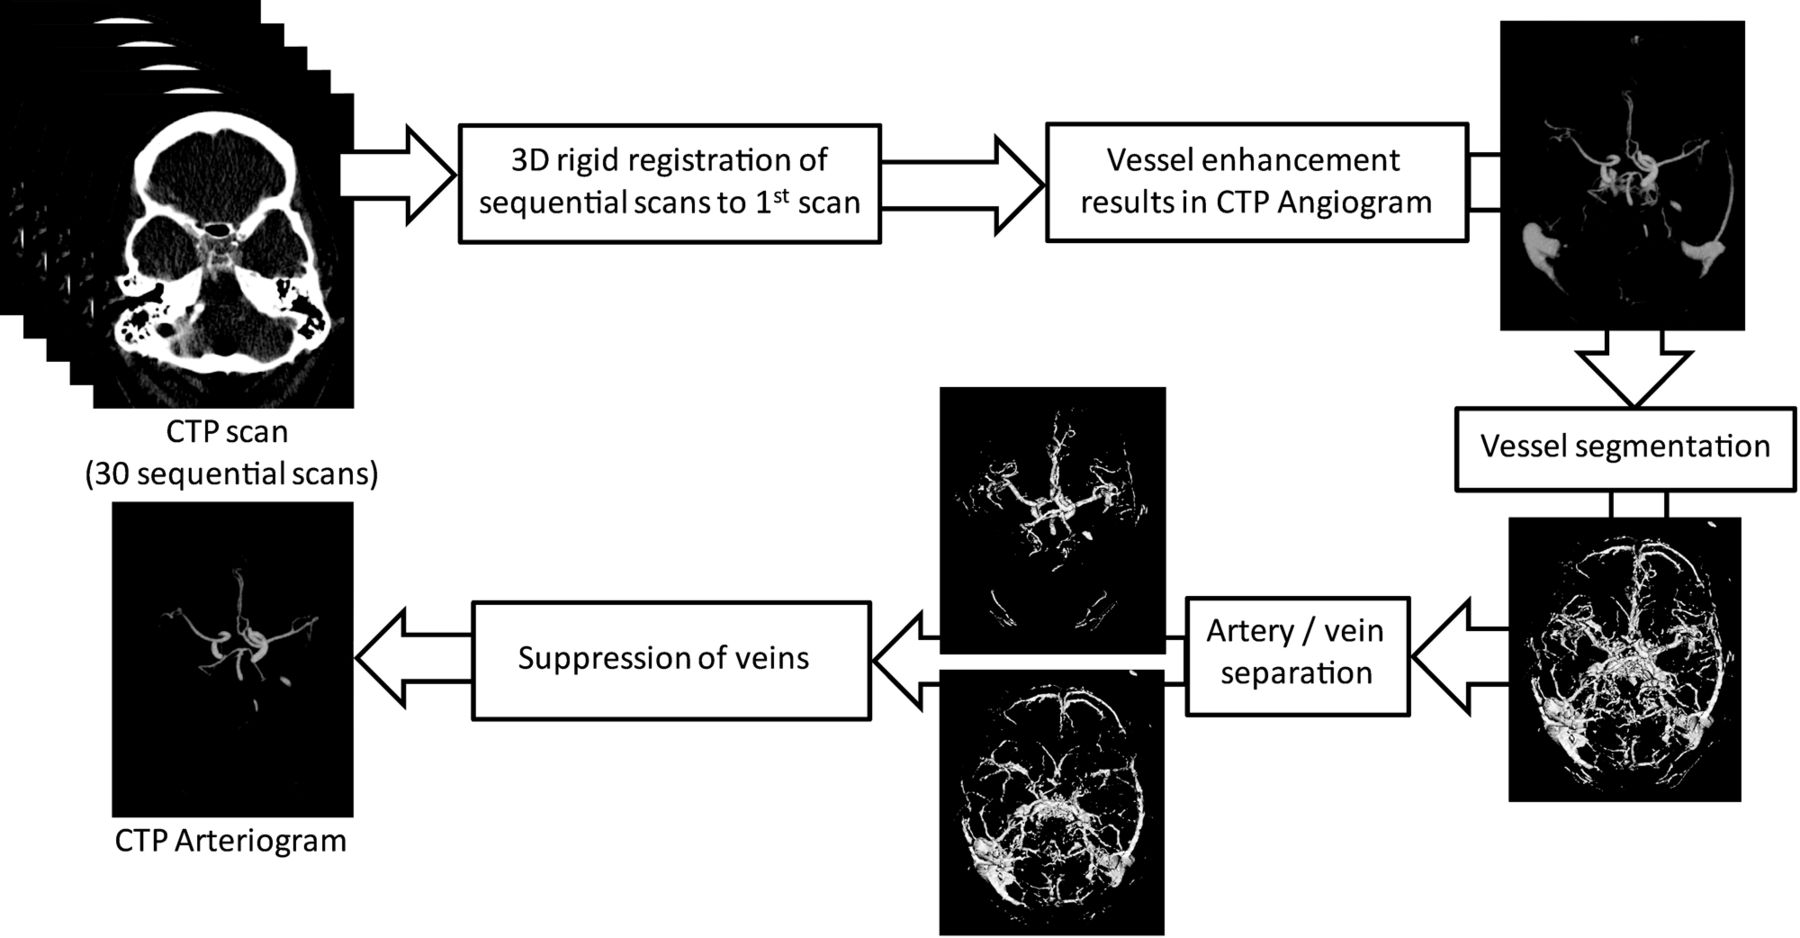
A computer algorithm (Fig 1) described by Mendrik et al9 was implemented to automatically derive arteriograms from the CTP data. First, the sequential CTP time scans were aligned to correct for patient motion. For this purpose, all sequential scans were registered to the first scan with 3D rigid registration by using Elastix (open-source registration software; Image Sciences Institute, Utrecht, the Netherlands).10 Next, an angiogram (Fig 1) showing only vessels was derived from the CTP data by quantifying the total change in Hounsfield units over all temporal scans, by using the absolute area under the first temporal derivative curve.9 Vessels show a large intensity change with time due to inflow and washout of contrast material and therefore show a high-intensity value in the angiogram. Bone intensity, on the other hand, remains static over time and therefore has a low-intensity value in the angiogram. The vessels were then segmented by setting a threshold on the CTP-derived angiogram, followed by a separation of the arteries and veins within the vessel segmentation based on the time of the peak contrast enhancement. Using this information, the veins were suppressed in the CTP-derived angiogram to create the CTPa. To enable comparison between CTPa and standard CTA, we rigidly registered the CTA data to the CTP data by using Elastix.10

Schematic representation of the automatic algorithm to derive arteriograms (CTPa) from CT perfusion data described in Mendrik et al.9
Image Analysis
Two radiologists (E.P.A.V. and G.A.P.d.K.) participated in the evaluation of 24 clinical examinations. CTPa and standard CTA of the same patient were presented side by side, to enable comparison of the scans. Because the CTA scan was used as a reference, the radiologists were not blinded to the type of scan (CTA or CTPa). Radiologists look at scans on a daily basis, and it is therefore of utmost importance to evaluate their opinion on the quality of these scans. Visual quality assessment, similar to pain assessment, for example, is of a subjective nature. For pain assessment, VASs are used extensively to quantify pain intensity.11 Similarly we adopted a VAS in our study to quantify the arterial quality and the presence of superimposed bone and veins in CTPa compared with the criterion standard CTA. Scoring was performed by drawing a vertical line on a VAS, which is a 100-mm horizontal line with 0% on the left and 100% on the right-hand side. Scoring percentages can thus be measured in millimeters. These scores were used for statistical analysis.
Arterial Quality
To assess the quality of CTPa, we scored arterial visual quality in CTPa by using standard CTA as a reference. Observers were asked to specify on the VAS to what extent the arteries seen on CTA were visualized on CTPa, with 0% indicating that the arteries were not visualized on CTPa and 100% indicating that arterial quality was fully equal to CTA. Within the proximal and more peripheral segments of the circle of Willis, we scored the following arterial territories: ACA including A1, the anterior communicating artery, and A2; the left MCA, including M1 and M2; the right MCA, including M1 and M2; and PCA, including P1, the posterior communicating artery, and P2.
Presence of Superimposed Bone and Veins
To determine whether CTPa offers a clear arterial view, we scored the presence of superimposed veins and bone in CTPa by using standard CTA as a reference. The observers were asked to specify, per arterial territory, the presence (yes or no) of superimposed structures and veins that hampered arterial visualization on CTA. If superimposed structures and veins were present in CTA, observers indicated on the VAS to what extent these structures and veins were present in CTPa, with 0% indicating no and 100% full presence. To ensure that radiologists agreed on whether superimposed structures and veins that hampered arterial visualization were present in CTA, a consensus reading was done in this part of the evaluation, though not for the VAS scores.
Statistical Analysis
In summary of the results, the mean VAS scores over all patients were calculated per arterial territory and observer for arterial quality and the presence of superimposed bone and veins. VAS scores per patient were converted to a 10-point NRS. Arterial visualization was considered to be improved when the highest rate (NRS 10, VAS > 90%) was scored for arterial quality, and the lowest rate (NRS 1, VAS < 10%), for presence of superimposed veins and bone, providing a clear view of arteries with quality equal to that of standard CTA. A sign test with continuity correction was used to test whether the number of cases with these rates was significant.
Results
The study sample consisted of 24 patients (3 men and 21 women), 46–78 years of age (mean, 61.2 ± 10.0 years). These patients had acute subarachnoid hemorrhage identified on precontrast CT and underwent CT angiography and CT perfusion as part of their pretherapeutic diagnostic work-up.
Arterial Quality
Mean VAS scores for arterial visual quality in CTPa compared with standard CTA per arterial territory and observer are listed in Table 1. Mean VAS scores over all arterial territories and both observers were 94% in the proximal area and 87% in the more peripheral area. The proximal arterial visual quality in CTPa was scored NRS 10 (equivalent to CTA) in 22 of the 24 cases. Two of these 22 cases are shown in Fig 2. Figure 3 shows a case with low VAS scores for arterial visual quality in CTPa. The sign test showed that the number of cases that were scored NRS 10 (VAS > 90%) was significant (P < .019) in all territories of the proximal area but not in the peripheral area. Interobserver agreement in the proximal area was good (κ = 0.73).
Mean VAS scores of both observers, per arterial territory over 24 patients, for arterial visual quality in CTPa using standard CTA as a referencea

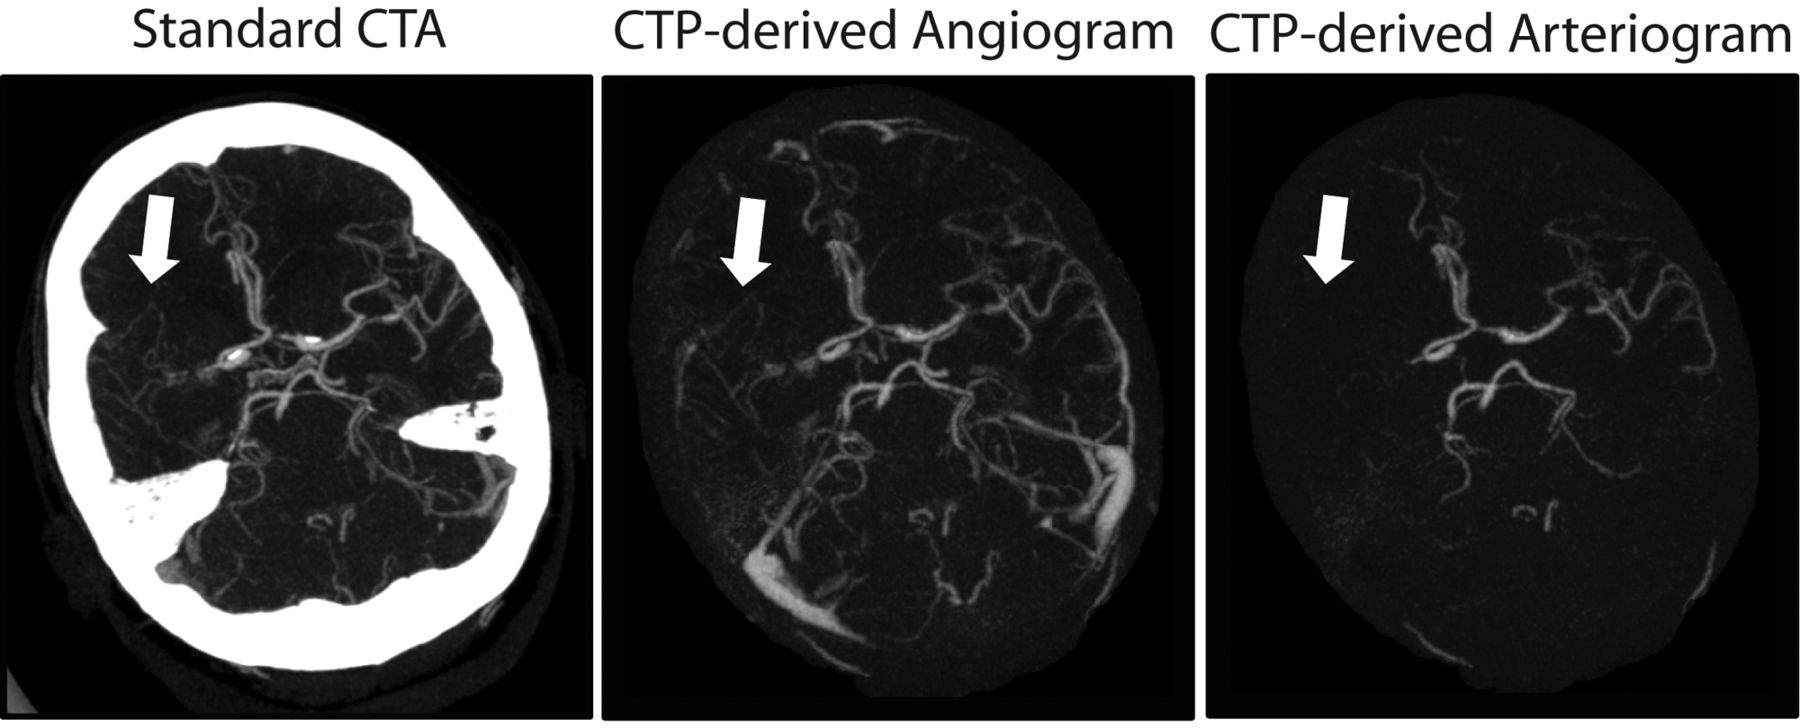
Maximum intensity projections (20 mm) of 2 cases from the evaluation dataset in which the proximal arterial quality in the CTPa was considered equivalent to standard CTA by both observers. Left: Standard CT angiogram. Middle: CTP-derived angiogram showing both arteries and veins. Right: CTPa showing the arteries. Case 7: window = 870 HU, level = 340 HU. Case 21: window = 540 HU, level = 270 HU. Arrows indicate superimposed veins in CTA that are absent in CTPa.

Maximum intensity projections (30 mm; window, 780 HU; level, 400 HU) of case 2, which received low VAS scores for arterial quality in CTPa from both observers. The right medial cerebral artery is occluded; the small collateral arteries have a time-to-peak of the contrast enhancement curve similar to that of the veins and thus are not present in the CTP-derived arteriogram (arrow). On the CTP-derived angiogram, however, the collateral arteries are visible (arrow). The source of subarachnoid hemorrhage in this patient is thought to have been the earlier infarction that was caused by the right media occlusion.
Presence of Superimposed Bone and Veins
Table 2 lists the number of cases in which superimposed bone or veins were present in standard CTA per arterial territory, as well as mean VAS scores for the presence of these superimposed structures in CTPa per observer.
Mean VAS scores of both observers, per arterial territory over 24 patients, for the presence of superimposed bone and veins in CTPa using standard CTA as a referencea
Superimposed bone was mainly present in the ACA and PCA territories of the proximal area in CTA. Mean VAS scores, over all arterial territories and both observers, for presence of superimposed bone in CTPa were 4% in the proximal area and 3% in the more peripheral area.
The sign test showed that the number of cases that were scored NRS 1 (VAS < 10%) was significant (P < .0096) in the ACA and PCA territories of the proximal area, but not in the peripheral area. The proximal MCA territories were excluded from the sign test because the sample size was too small; in only 3 cases or fewer was superimposed bone present.
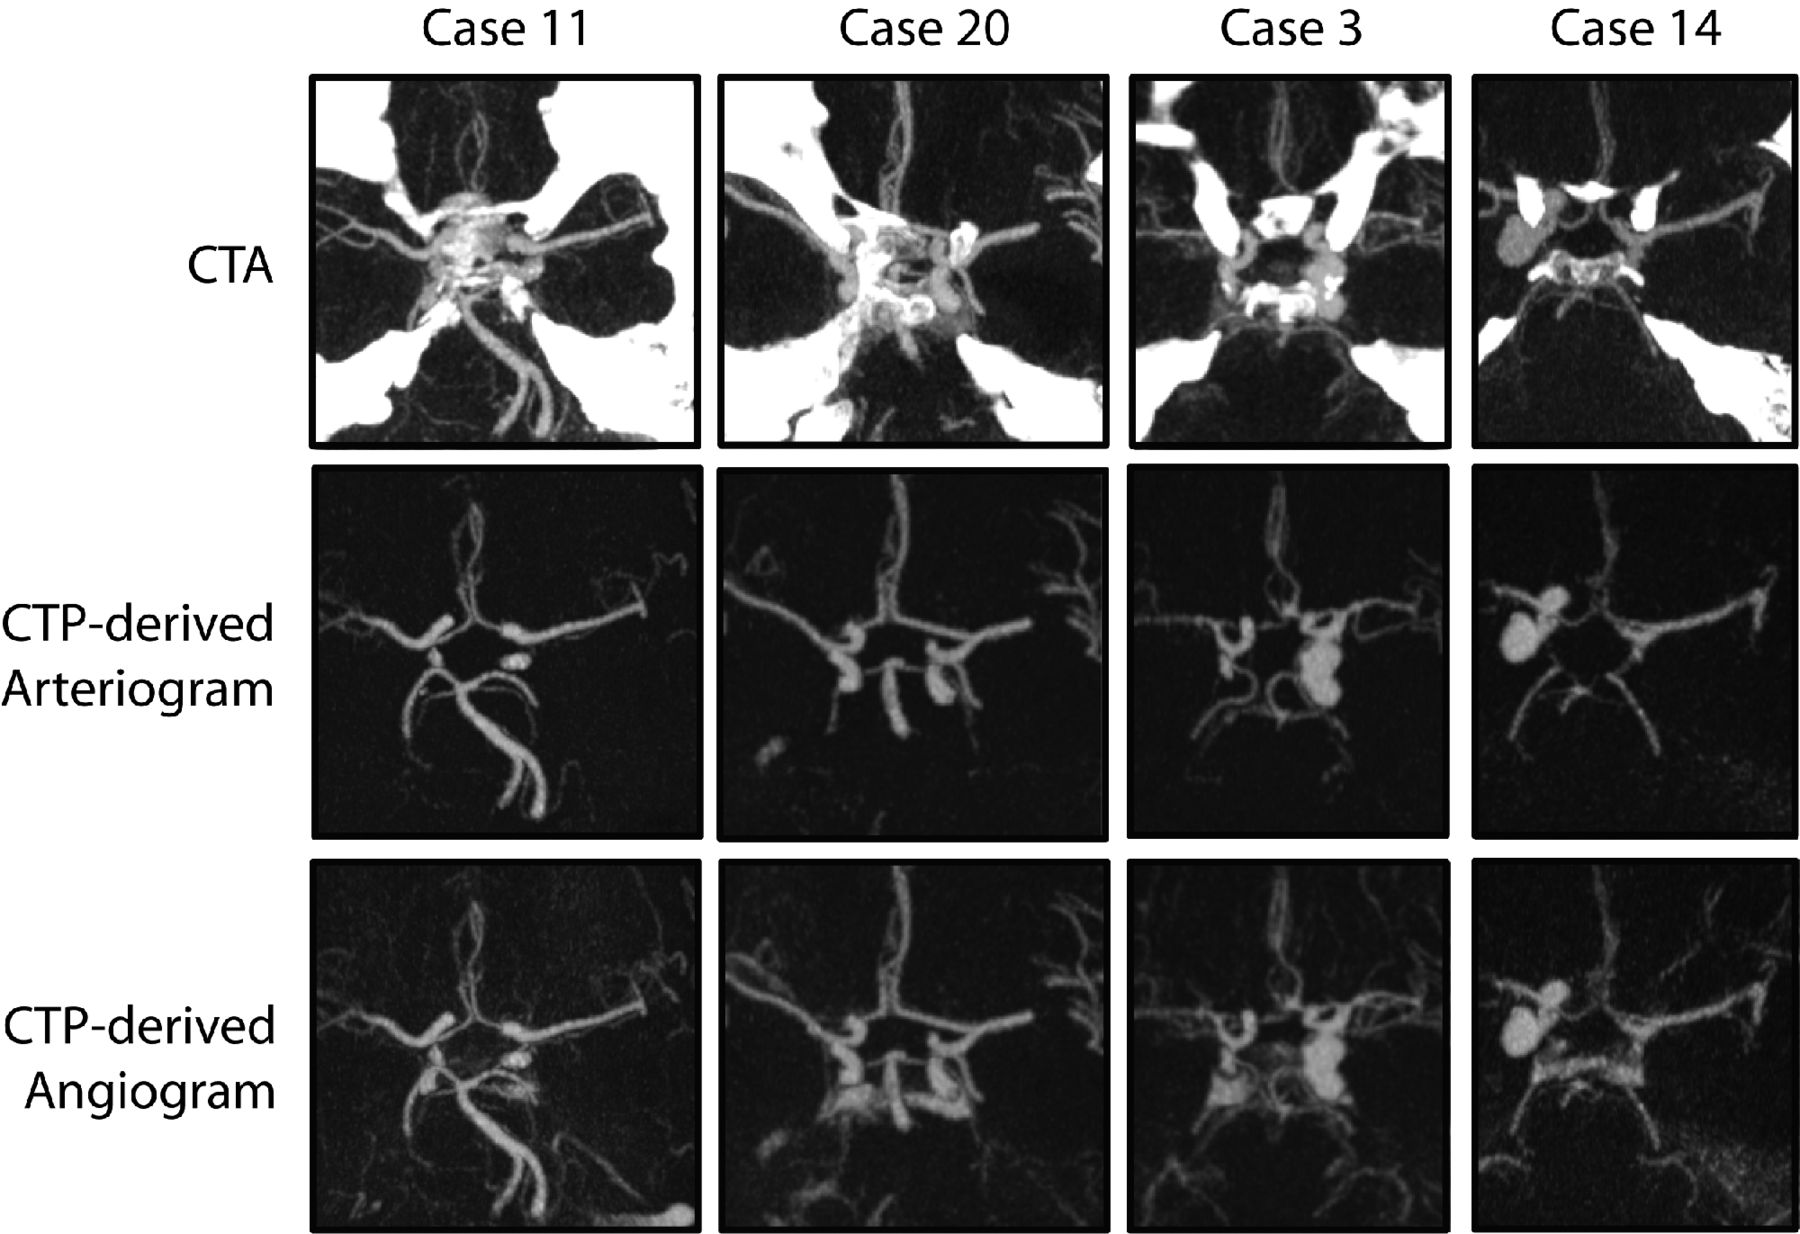
Figure 4 presents 4 examples of superimposed bone at the skull base in CTA and the corresponding CTP-derived angiogram and CTPa. Two of these examples show that besides the absence of superimposed bone in CTPa, subarachnoid blood is absent as well because its intensity value remains static with time, presenting a clear arterial view.

Maximum intensity projection (20 mm) subimages of 4 different patients from the evaluation dataset with a window of 800 HU and a level of 350 HU. Two patients with subarachnoid blood (cases 11 and 20) and 2 with large aneurysms (cases 3 and 14) near the skull base, illustrating a clear arterial view due to the absence of bone, veins, and subarachnoid hemorrhage in CTPa. Top row: Standard CTA scans. Middle row: CTPa. Bottom row: Angiograms (showing both arteries and veins) derived from the CTP scans.
Superimposed veins were present in all standard CTA examinations in either some or all arterial territories (Table 2). Mean VAS scores, over all arterial territories and both observers, for the presence of superimposed veins in CTPa were 7% in the proximal area and 13% in the more peripheral area. The sign test showed that the number of cases that were scored NRS 1 (VAS < 10%) was significant (P < .008) in all territories of the proximal area, but not in the peripheral area. The arrows in Fig 2 indicate superimposed veins in the proximal area, which are absent in the CTPa.
Discussion
Arterial visualization in standard CTA could be improved by using bone-removal techniques. These techniques can be based on subtraction of a nonenhanced scan from the CTA12,13 or on masking highly attenuating bony structures from the data.14,15 Although multiple studies have shown that bone removal in CTA improves vascular analysis,13,16,17 it is not routinely used in clinical practice because either the required techniques are not available (eg, dual-energy) or the removal is too time-consuming when user interaction is required. Furthermore, some methods remove part of the vessel wall,12 which decreases diagnostic confidence. One of the vendors offers bone suppression in a dynamic CTA derived from CTP, by subtracting the first sequential scan from the rest of the sequential scans.18,19 However, superimposed veins are not suppressed, and subtracting this noisy scan increases the amount of noise in the arterial phase. Although CTP scans are routinely acquired in patients with acute stroke and increasingly in those with subarachnoid hemorrhage as well, radiation dose is a general concern. A recent study on radiation dose delivered during comprehensive CT imaging for acute stroke20 reported a mean effective dose of 1.6 mSv for CTA of the head (excl. neck, by using “Auto” mAs) and 4.9 mSv for CTP (4-cm coverage, 48 scans × 190 mAs).
In this study, we compared the quality of CTPa with standard CTA. The technique proposed by Mendrik et al9 that was used to create the CTPa was specifically developed to perform well on low-dose CTP (80 kVp, 150 mAs). Furthermore, our study resulted in half of the exposure described by Mnyusiwalla et al20 for CTP, because we acquired only 30 time points and used a lower tube current of 150 mAs. Replacing CTA with CTPa when CTP is already part of the acquisition protocol would reduce the radiation dose even further and would additionally reduce the amount of administered contrast material. To investigate whether this is feasible, 2 radiologists visually assessed the arterial quality in CTPa and compared it with the arterial quality in CTA. Results showed equivalent arterial quality in CTPa compared with CTA within the proximal area in a significant number of cases. An additional advantage of CTPa is that only arteries are visualized. Results showed that little to none of the overlying veins and bony structures present in CTA were present in the CTPa in a significant number of cases within the proximal area. Because veins and bony structures are no longer disturbing, circle of Willis arteries can be viewed not only by using interactive MPR but also by thick-slab maximum intensity projections, providing improved arterial visualization compared with standard CTA. In the ideal case in which bone is subtracted from standard CTA, without leaving artifacts and with the CTA timed properly, such that there is no significant venous filling, arterial visualization will be similar to that on CTPa. However, the advantage would still be that CTPa has the potential to replace standard CTA when CTP is already part of the acquisition protocol, which would reduce the radiation dose and the amount of administered contrast material.
There are some limitations to the evaluated technique. Deriving CTPa requires thin-section (≤1 mm) CTP scans that have a longer reconstruction time than the standard thick-section (≥5 mm) CTP scans. However, reconstruction algorithms are constantly improving, and newer generation scanners already provide these thin-section CTP scans in standard protocols.18,19
In 2 patients, head motion artifacts in 1 of the CTP images of the arterial phase reduced the visual quality of the affected arteries in CTPa. Head motion that occurs in between 2 sequential scans of the CTP sequence will be corrected for by the registration algorithm; however, such a correction is not possible if motion occurs during data acquisition of a single sequential scan. Therefore, head motion during scanning should be minimized. Another limitation is shown in Fig 3, in which case the right medial cerebral artery was occluded. This led to delayed arterial enhancement of the collateral arteries, which were then classified as veins and suppressed in CTPa. A solution could be to show the CTP-derived angiogram (showing both arteries and veins), which is also produced by the evaluated technique, and the arteriogram side-by-side. Although arterial visualization in CTPa within the proximal area improved compared with CTA, results of the arterial visualization for the smaller arteries in the peripheral area were not as good. However, most aneurysms and stenoses occur in the proximal area.
There are some limitations to the study in general, as well. Although observers scored whether superimposed bone and veins were present in standard CTA, we did not quantify how much the arteries were obscured. Furthermore, the radiologists were not blinded to the type of scan (CTA or CTPa). We could have mixed the studies and let them be evaluated independently. However, radiologists would still have been able to distinguish between CTA and CTPa, and evaluating the studies independently could have led to overoptimistic results for CTPa due to a lack of reference. Another limitation is that the CTP scans used in this study had 4-cm coverage. Therefore, the algorithm proposed in Mendrik et al9 could not be used for CTP scans acquired above the circle of Willis. However, newer scanners provide CTP scans with full head coverage,18,19 solving this limitation. Further research should show whether the algorithm proposed in Mendrik et al9 performs equally well on these scans.
Despite these limitations, this study shows promising results of arterial visualization in CTPa compared with CTA. The improved arterial view in CTPa could be beneficial for the detection and characterization of cerebral aneurysms. Furthermore, replacement of CTA with CTPa would reduce radiation exposure to the patient and the amount of applied contrast material.
Further research, in the form of task-specific evaluation, should determine whether the arterial quality in CTPa is sufficient to detect arterial diseases at least as well as on CTA. It should determine whether, for example, detection and characterization of cerebral aneurysms will improve on CTPa due to the clear arterial view compared with standard CTA and also determine the sensitivity and specificity of aneurysm detection.
In this study, we evaluated CTPa and compared it with standard CTA. However, the technique proposed by Mendrik et al9 also produces a CTP-derived angiogram (showing both arteries and veins) and a venogram (showing only veins). Further studies could assess these, for instance, by comparing the venogram with CT venography for the detection of sinus thrombosis.
Conclusions
We demonstrated that arterial quality in cerebral CTPa is equivalent to arterial quality in CTA in the proximal area, with little or no overlying bone and veins. Therefore, CTPa shows improved arterial visualization compared with standard CTA in this area. This could be beneficial for the detection and characterization of cerebral aneurysms. Furthermore, CTPa extends the diagnostic yield of CTP scans, which could eliminate the need for an additional CTA scan, reducing radiation dose and the amount of applied contrast material.
Footnotes
-
This work was supported by a research grant from Philips Healthcare.
-
Disclosures: Max Viergever—RELATED: Grant: Philips Healthcare,* Comments: Salary of the PhD candidate (Adriënne Mendrik), Support for Travel to Meetings for the Study or Other Purposes: Philips Healthcare,* Comments: The grant mentioned in Item 1 also covered travel expenses of the PhD candidate, UNRELATED: Grants/Grants Pending: Philips Healthcare.* *Money paid to the institution.
References
- Received December 2, 2011.
- Accepted after revision February 9, 2012.
- © 2012 by American Journal of Neuroradiology
In this issue


Jump to section
Related Articles
Cited By...
- No citing articles found.