
Abstract
BACKGROUND AND PURPOSE: Noninvasive evaluation of retinoblastoma treatment response has become more important due to increased use of eye-sparing treatments. We evaluated the relation between DCE-MR imaging and histopathologic parameters to determine the value of DCE-MR imaging in assessing tumor angiogenesis and prognostic features.
MATERIALS AND METHODS: Fifteen consecutive patients with retinoblastoma (mean age, 24 months; range, 2–70 months) undergoing enucleation as the primary treatment (15 eyes) were scanned at 1.5T by using dedicated surface coils. Pretreatment DCE-MR imaging of the most affected eye was evaluated by 2 observers by using curve-pattern analysis, with the first 5 minutes of each curve and the full time-series described as κ5min and κ17min, respectively. Assessed histopathologic and immunologic parameters included optic nerve invasion, choroid invasion, MVD, tumor necrosis, and expression of VEGF and Flt-1.
RESULTS: The median value of κ5min was 1.28 (range, 0.87–2.07) and correlated positively with MVD (P = .008). The median value of κ17min was 1.33 (range, 0.35–3.08) and correlated negatively with tumor necrosis (P = .002). Other histopathologic and immunohistopathologic parameters did not correlate with DCE-MR imaging parameters. Interobserver agreement was 0.53 for κ5min and 0.91 for κ17min.
CONCLUSIONS: In retinoblastoma, the early phase of the DCE time curve positively correlates with MVD, while the presence of late enhancement is correlated with necrosis. Thus, the potential for DCE-MR imaging to noninvasively assess tumor angiogenesis and necrosis in retinoblastoma is promising and warrants further investigation.
ABBREVIATIONS:
- DCE
- dynamic contrast-enhanced
- Flt-1
- VEGF receptor-1
- κ5min
- curve-pattern analysis of the first DCE time-series
- κ17min
- curve-pattern analysis for the full dataset
- kep
- rate-constant
- Ktrans
- transfer constant
- MVD
- microvessel density
- ve
- extravascular extracellular space per unit volume of tissue
- VEGF
- vascular endothelial growth factor
In retinoblastoma, increasing eye preservation without sacrifice of tumor control has been achieved by the introduction of conservative treatment strategies. In particular, the recent introduction of selective intra-arterial chemotherapy infusion via the ophthalmic artery as an effective treatment for intraocular retinoblastoma will dramatically decrease the number of enucleations.1⇓–3 In the future, more and more patients will be treated without histopathologic assessment of their tumor, leading to uncertainty about certain risk factors that can predict disease dissemination and prognosis because histopathology is still the criterion standard for detection of tumor spread and therefore prognosis of retinoblastoma.4 Currently, the risk assessment for disseminated disease and the decision about the use of prophylactic therapy are based on the following characteristics: 1) tumor invasion in the optic nerve posterior to the lamina cribrosa, 2) invasion in the anterior eye segment, and 3) extensive invasion of the ocular coats (massive choroidal or scleral invasion). These characteristics can be well-detected on histopathology, but detection by conventional MR imaging is not optimal so far.5⇓⇓⇓⇓⇓⇓⇓–13 Therefore, it is important to assess the prospects of other MR imaging methods that could further optimize the tumor tissue characterization in vivo.
Tumor angiogenesis is a key element in the pathophysiology of tumor growth and metastasis. It has been shown that tumor MVD as a marker for angiogenesis correlates with both local invasive growth and the presence of metastases in retinoblastoma.4,14 Thus, tumor angiogenesis in retinoblastoma is considered to be a risk factor for disseminated disease. Currently, tumor angiogenesis can only be assessed in vitro on histopathologic specimens by assessment of MVD and angiogenic growth factors such as VEGF and Flt-1. In addition to promoting angiogenesis, these growth factors cause an increased vascular permeability in neovascular capillary beds.
A noninvasive evaluation of tumor angiogenesis might be obtained with DCE-MR imaging, and a noninvasive imaging biomarker for tumor angiogenesis in vivo could have potential value in assessing patients treated with eye-preservation strategies. To our knowledge, the correlation between DCE-MR imaging and retinoblastoma microvasculature has not been described. Hence, the purpose of this study was to evaluate the relation between DCE-MR imaging and histopathologic parameters to determine the value of DCE-MR imaging in assessing tumor angiogenesis and providing a new radiologic prognostic indicator in retinoblastoma.
Materials and Methods
Patient Population
From May 2006 to September 2009, patients with retinoblastoma, diagnosed with extensive funduscopy and sonography under general anesthesia, were included in this prospective study if they met the following criteria: 1) pretreatment DCE-MR imaging, 2) enucleation due to retinoblastoma as primary treatment, and 3) availability of diagnostic-quality pathologic material. Twenty-one patients with retinoblastoma had DCE-MR imaging before enucleation. Five patients were excluded because of insufficient histopathologic material (3 patients) or inadequate DCE-MR images (2 patients), and 1 patient was treated with chemotherapy before enucleation. The final study population consisted of 15 patients (5 girls and 10 boys) with a mean age of 24 months (median, 23 months; range, 2–70 months). Five patients had bilateral disease, for which only the most affected eye was enucleated. Clinical records were reviewed by 1 reviewer (F.R.) to assess age at diagnosis, days between MR imaging and enucleation, laterality, presence of vitreous/subretinal tumor seeding (yes/no), extraocular tumor recurrence, and the time interval between retinoblastoma diagnosis and the last known follow-up date. This study was approved by the local medical ethics review committee, with a waiver of informed consent.
MR Imaging
All MR imaging examinations were performed with the patient under general anesthesia on a 1.5T scanner (Sonata; Siemens, Erlangen, Germany) by using a dedicated surface coil focused on the most affected eye. MR imaging included transverse and sagittal spin-echo T1-weighted images (TR/TE, 420/13 ms; 3 and 2 acquisitions, respectively) and transverse spin-echo T2-weighted images (TR/TE, 2470/120 ms; 1 acquisition). All conventional images had an in-plane resolution of 0.58 × 0.58 mm2 and a section thickness of 2 mm. Transverse DCE-MR images were obtained with 3D fast low-angle shot (TR/TE, 8.6/4.8 ms; flip angle, 25°; in-plane resolution, 0.66 × 0.66 mm2). One 3D volume consisted of 16 partitions of 3-mm thickness (acquisition time per volume, 17 seconds), and a total of 20 consecutive volumes were acquired in 5 minutes 39 seconds. During DCE-MR imaging, an intravenous bolus injection of 0.2-mmol/L gadopentetate dimeglumine (Magnevist; Schering, Berlin, Germany) per kg of body weight was administered after the first volume. To determine late enhancement, we acquired 2 short DCE series consisting of 3 volumes at t = 13 minutes and t = 17 minutes after contrast injection. After each DCE-MR imaging series, fat-suppressed T1-weighted spin-echo images were obtained (TR/TE, 653/11 ms; 3 acquisitions) in transverse, sagittal, and coronal orientations. Thus, the 3 DCE series lasted <8 minutes in total and were acquired interleaved with the conventional sequences.
Image Analysis
Conventional MR Imaging.
Tumor volume measurements were performed by 2 observers in consensus (F.R. and P.d.G.) on postcontrast transverse T1-weighted MR images with use of a computerized image-analysis tool (Centricity Radiology RA 600; GE Healthcare, Milwaukee, Wisconsin). On every section in which tumor was present, tumor was manually outlined as a region of interest, and the region of interest covered the whole tumor on each section. Surfaces of the ROIs were calculated, and tumor volume was obtained from the surfaces on consecutive sections multiplied by the section thickness and intersection gap. In addition, tumor enhancement was scored as either homogeneous or heterogeneous.
Region-of-Interest Placement for Dynamic Analysis.
DCE-MR imaging data were analyzed by using the time-series of a region of interest, which was placed by 2 observers independently (F.R. and P.d.G.). Both observers were blinded to histologic findings. On a workstation (Leonardo; Siemens), ROIs were manually drawn on a volume at the end of the first DCE series. The region of interest was positioned on 1 section within the most enhancing part of the tumor assessed visually. Care was taken to avoid areas with necrosis within the tumor on the basis of focal high signal intensity on T2-weighted images and the absence of enhancement on postcontrast images. Because some ROIs were small, it was verified that the position of the ROIs remained strictly within the tissue during the dynamic series and was not influenced by minor motion (despite anesthesia). For each region of interest, signal intensity as a function of time was extracted.
Dynamic Analysis.
Preferably, quantitative analysis of DCE-MR imaging is performed to obtain values of the volume Ktrans and the volume of ve.15 This, however, requires determination of both an arterial input function and precontrast T1 relaxation times, which were not included in the current protocol. Recently, Guo and Reddick16 proposed a curve-pattern analysis based only on the dynamic measurements, yielding a κ-value, which showed a close correlation with the rate constant kep, which is defined as kep = Ktrans/ve.
This curve-pattern analysis was performed by using Matlab (MathWorks, Natick, Massachusetts) (P.J.W.P. and J.P.A.K.) both for the first DCE time-series (resulting in a κ-value for 5 minutes) and for the full dataset (κ-value for 17 minutes). The κ17min can, therefore, be considered as a parameter for late enhancement. The analysis was performed on smoothed curves through the actual time points. The smoothed signal intensity of the first series (t = 0–5 minutes 39 seconds) was estimated by an exponential fit of the form S(t) = S(0)exp(−k(t − Δt), in which Δt incorporates the time delay of contrast injection. For each of the second and third series (at t = 13 minutes and t = 17 minutes), the signal intensity of the 3 volumes within these series was simply averaged.
Histopathologic Analyses and Immunohistochemical Staining
All included eyes were re-evaluated by 1 pathologist (P.v.d.V.) with 11 years of experience in ophthalmopathology, who was blinded to the patient clinical records and MR imaging findings. Histopathologic evaluation, by using hematoxilin-eosin staining, included the following: tumor necrosis (semiquantitatively estimated according to the percentage of necrotic tumor area), involvement of choroid (inflammation; minimal or massive tumor invasion), optic nerve invasion (prelaminar, laminar, or postlaminar), and tumor differentiation (poor-, moderate- and well-differentiated).
From all affected eyes, deparaffinized 4-μm sections were immunohistochemically stained by using the avidin-biotin-peroxidase complex and direct antibodies against CD-31 (DAKO, Glostrup, Denmark), VEGF (Santa Cruz Biotechnology, Santa Cruz, California), and Flt-1 (Santa Cruz Biotechnology). In representative parts of the tumor, in 5 high-power fields (magnification, ×20), the mean MVD of the tumor was calculated on CD-31-stained specimens. Evaluation of VEGF and Flt-1 staining intensity in the tumor was graded as follows: negative, weak, or strong. These methods have been described previously by De Graaf et al.9
Statistical Analysis
Interobserver variability for κ5min and κ17min was analyzed by calculating the intraclass correlation coefficient. Subsequent analyses were performed by using the average of the 2 observers. All statistical calculations were performed by using the Statistical Package for the Social Sciences, Version 15.0 (SPSS, Chicago, Illinois). Spearman rank correlations were calculated to test the strength of the association between DCE-MR imaging parameters and histopathologic parameters. Only 2-tailed tests were used. A P value <.05 was considered statistically significant.
Results
Clinical Findings
MR imaging was performed at a mean of 6 days (median, 6 days; range, 1–13 days) before enucleation. In 6 of 15 eyes, vitreous and/or subretinal seedings were observed. Mean follow-up time after enucleation was 35 months (range, 10–54 months). No patients developed histologic-proved extraocular recurrences, and all patients were still alive at the time of follow-up.
Conventional and DCE-MR Imaging Parameters
The results of all patients are summarized in the Table. Mean tumor volume was 2513 mm3 (range, 288–4847 mm3). All 15 tumors showed heterogeneous enhancement, as shown in Figs 1–3.
Dynamic MR imaging and histologic findings in patients with retinoblastoma

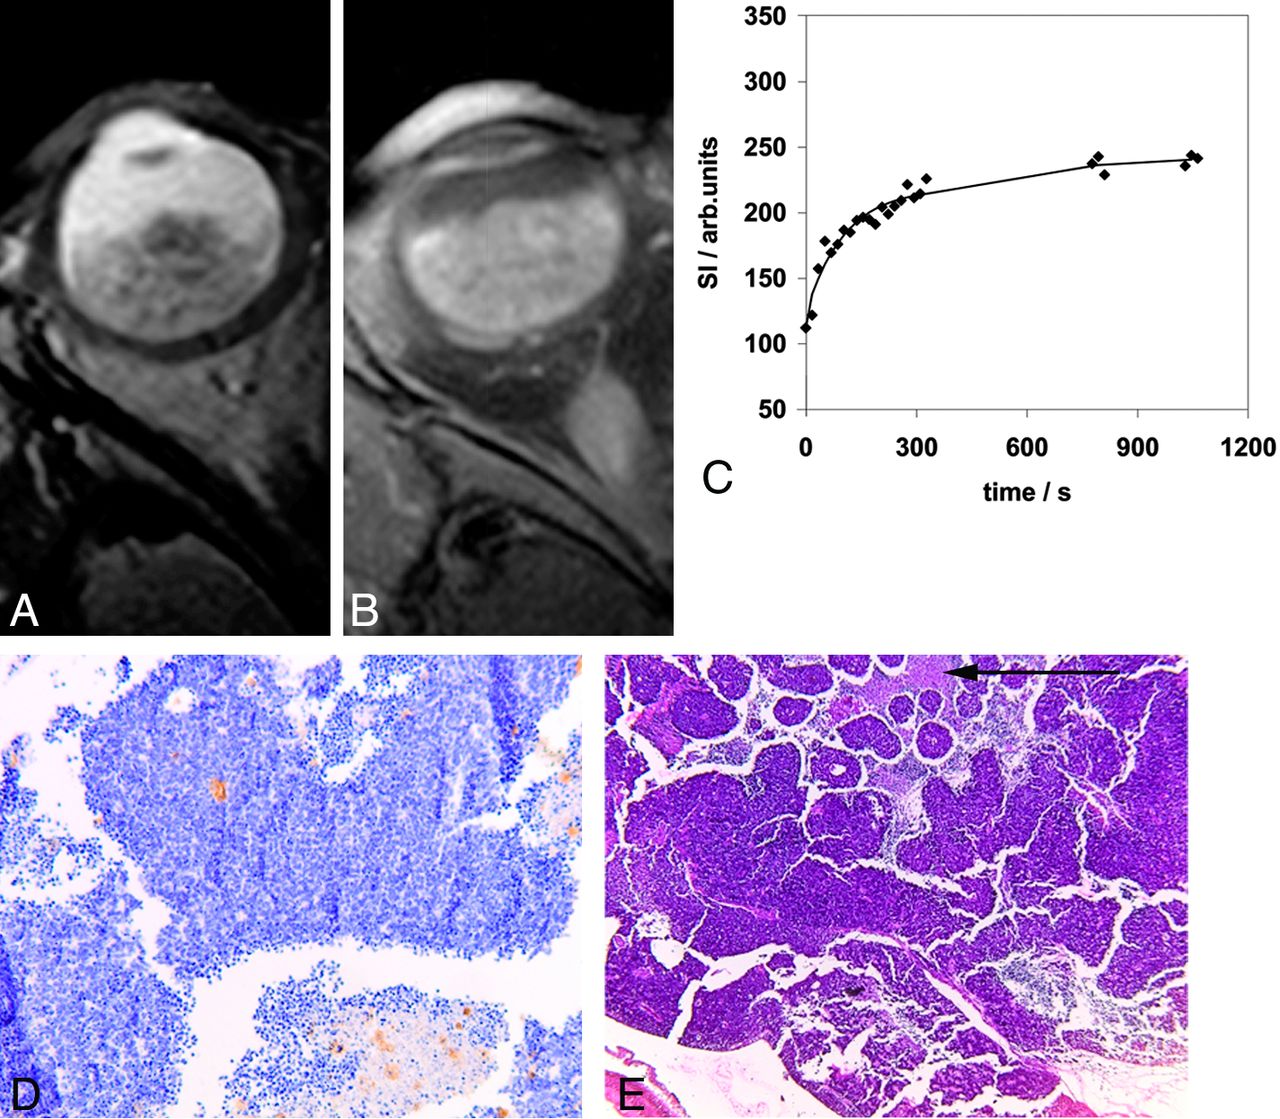
Retinoblastoma tumor in the right eye (patient 9) with transverse T2-weighted spin-echo (A) and transverse contrast-enhanced T1-weighted spin-echo (B) MR images. Curve-pattern analyses of the signal intensity curve of 1 observer (C) shows slow initial uptake of contrast (κ5min = 0.76) and slow further rising of the curve (κ17min = 1.06). Immunohistochemical staining with CD-31 (original magnification ×10) (D) shows brown-stained microvessels on a background of blue tumor cells with a MVD of 11. Hematoxilin-eosin staining (E) illustrates 30% necrotic areas (arrow).
DCE-MR imaging parameters determined in all 15 patients by both observers resulted in an intraclass correlation coefficient of 0.53 for κ5min and 0.91 for κ17min. A comparison between the 2 observers showed that 1 patient (patient 15) with a large and heterogeneous tumor was the main cause of disagreement. When we disregarded this patient and considered 14 of 15 patients, the intraclass correlation coefficient for κ5min increased to 0.92, while the intraclass correlation coefficient for κ17min did not change.
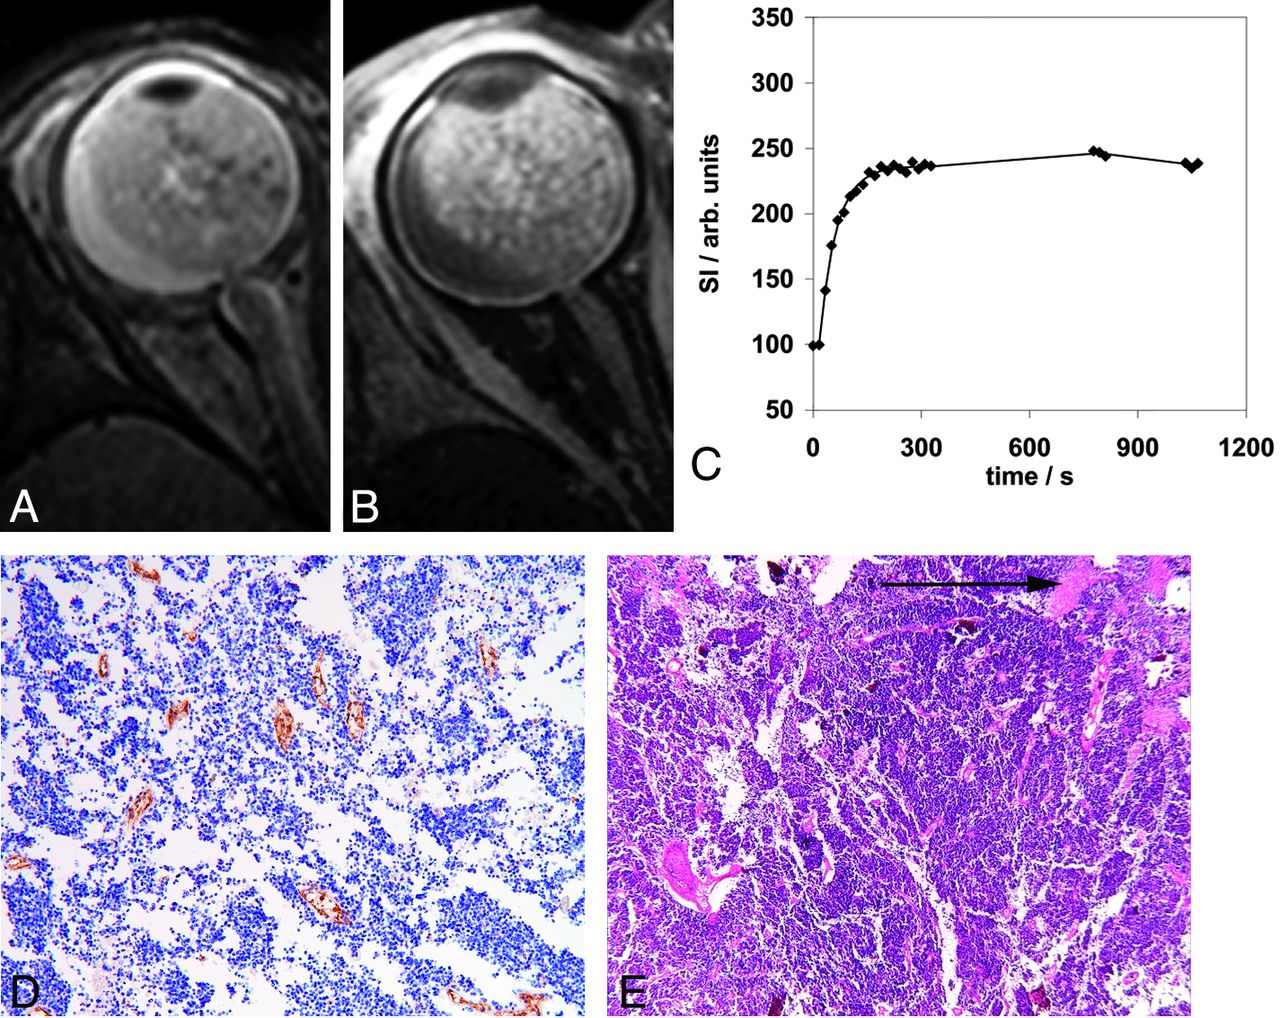
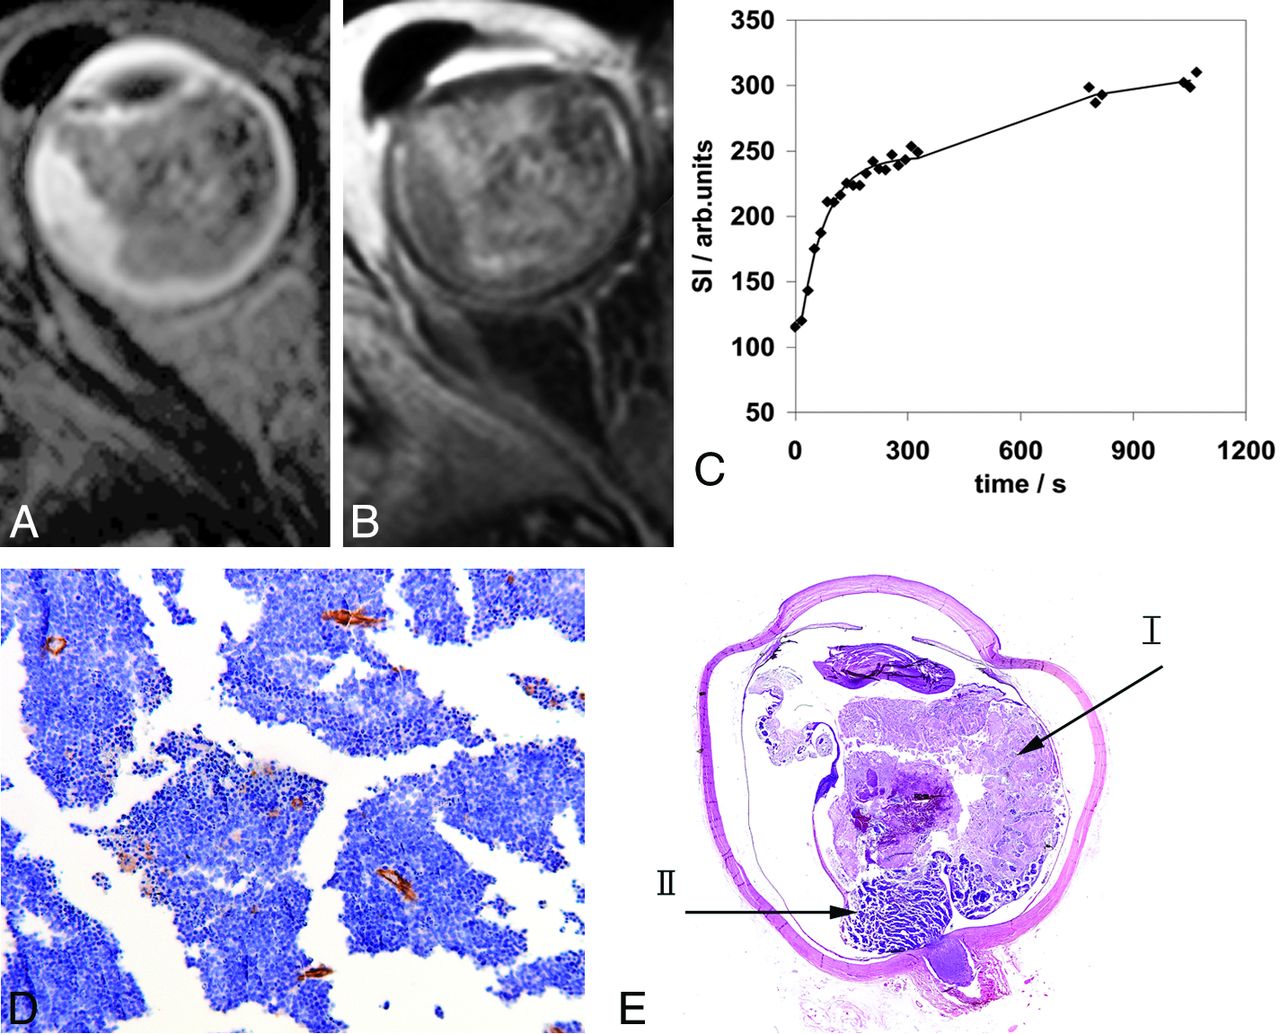
A large range was observed both for κ5min (mean, 1.28 minutes; median, 1.12 minutes; range, 0.87–2.07 minutes) and κ17min (mean, 1.33 minutes; median, 1.06 minutes; range, 0.35–3.08). Examples of the DCE curves of 3 patients as measured by 1 observer are shown in Figs 1–3. Figure 1C (patient 9) shows a slow initial uptake of contrast agent, resulting in a low value for κ5min of 0.76. Seventeen minutes after contrast injection, the signal intensity of the tumor continued to increase slowly, resulting in an intermediate value for κ17min of 1.06. Figure 2C (patient 2) shows another dynamic behavior: a fast uptake of contrast agent with maximum signal intensity already reached 3 minutes after contrast injection, resulting in κ5min = 1.67. At later time points, the signal intensity remained similar, resulting in κ17min = 2.79. Generally, a steep slope and an early arrival at equilibrium lead to a higher κ-value, causing the high value of κ17min in this case. Instead, if the curve continues to increase during the second and third time-series, then κ5min and κ17min have more similar (and lower) values, as illustrated for patient 5 in Fig 3. In our study, none of the tumor ROIs had a clear decrease of signal intensity observed in the assessed timeframe of 17 minutes.

Retinoblastoma tumor in the right eye (patient 2) with transverse T2-weighted spin-echo (A) and transverse contrast-enhanced T1-weighted spin-echo (B) MR images. Curve-pattern analysis of the signal intensity curve of 1 observer (C) shows fast uptake of contrast agent (κ5min = 1.67) and early arrival at equilibrium (κ17min = 2.79). Immunohistochemical staining with CD-31 (original magnification ×10) (D) shows a high MVD of 21, and hematoxilin-eosin staining shows only 10% necrosis (arrow) (E).

Retinoblastoma tumor in the right eye (patient 5) with transverse T2-weighted spin-echo (A) and transverse contrast-enhanced T1-weighted fat-suppressed spin-echo (B) MR images. Curve-pattern analysis of the signal intensity curve of 1 observer (C) shows a moderate uptake of contrast agent (κ5min = 1.22) and a continuing increase leading to κ17min = 0.84. Immunohistochemical staining with CD-31 (original magnification ×10) (D) shows an MVD of 14. Hematoxilin eosin staining (E) shows a large area of necrosis (70%) (arrow I) in vital tumor tissue (arrow II).
Histopathologic and Immunohistochemical Findings
The mean amount of tumor necrosis was 29% (median, 20%; range, 0%–90%). Minimal tumor infiltration of the choroid occurred in 1, and inflammation, in 2 of the 15 eyes. Massive invasion in the choroid is a risk factor for disseminated disease and did not occur in our patients. Postlaminar optic nerve invasion is an important risk factor for extraocular recurrence and occurred in 3 eyes. Prelaminar optic nerve infiltration occurred in 6 of 15 eyes. In 6 eyes, no optic nerve infiltration was scored. In 1 patient, the optic nerve was cut at surgery at the scleral surface without a stump. The tumor, however, reached the cut surface and was considered as positive for postlaminar optic nerve invasion. Ten of 15 tumors were poorly differentiated; 4, moderately differentiated; and 1 well-differentiated.
The mean value of MVD was 18.4 per ×20 field (range, 10–37), as shown in Figs 1–3. VEGF immunoreactivity was positive in 7, weak in 6, and negative in 2 patients. Flt-1 staining was determined as positive in 1 patient, weak in 5, and negative in 9 patients.
Correlation between DCE-MR Parameters and Histopathology/Immunohistochemistry
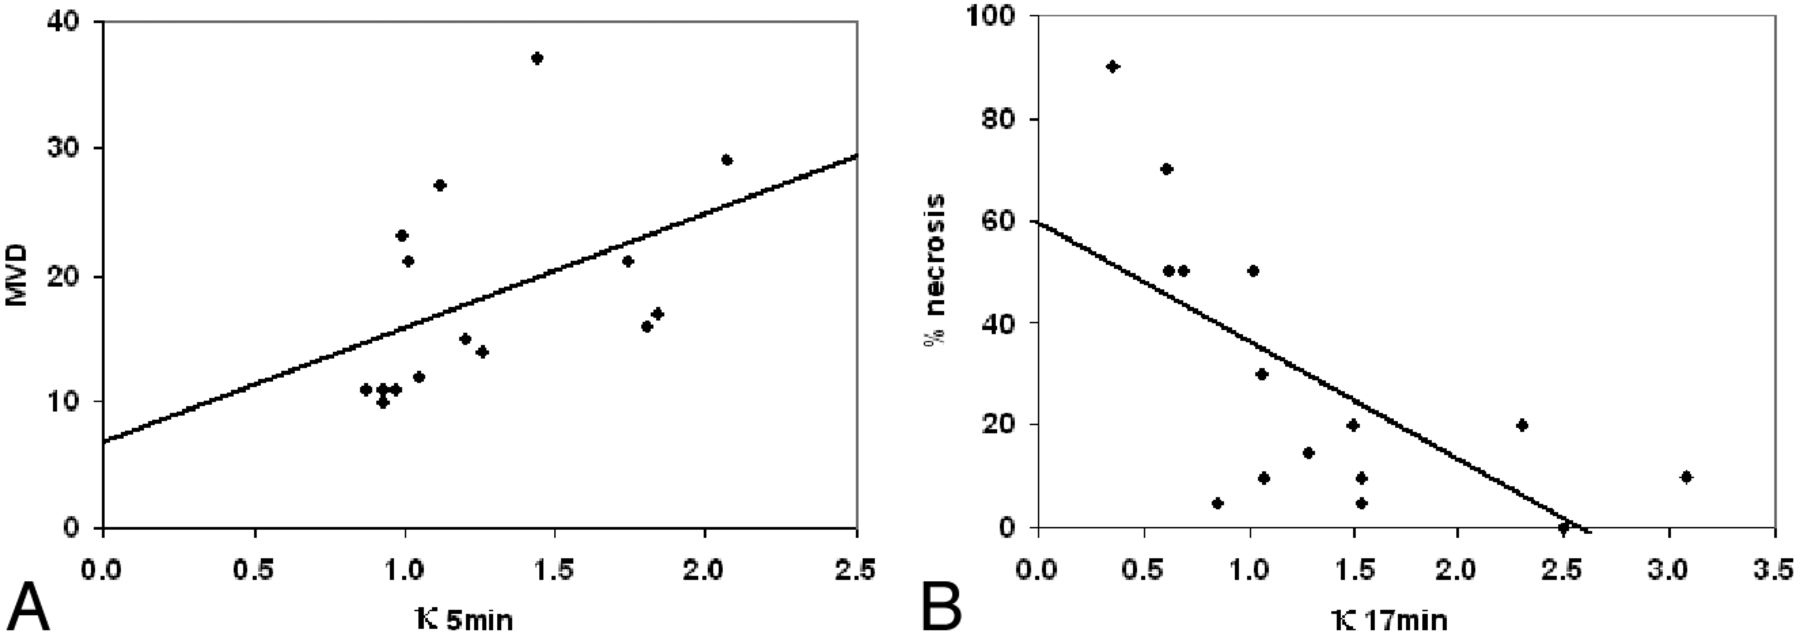
A positive correlation in retinoblastoma was found between κ5min and mean MVD (P = .008) (Fig 4 A), and a negative association, between κ17min and the percentage of necrosis (P = .002) (Fig 4B). No statistically significant correlation between κ5min or κ17min was found with other clinical or histopathologic data (choroid invasion, respectively, P = .66 and P = .17; optic nerve invasion, respectively, P = .27 and P = .90; VEGF, respectively, P = .91 and P = .59; and Flt-1, respectively, P = .14 and P = .13). After we disregarded patient 15 because of interobserver disagreement, results remained similar. In fact, we found an additional positive correlation between κ17min and MVD (P = .03).

Graphs show the positive correlation (A) between κ5min and mean MVD (P = .008) and the negative correlation (B) between κ17min (a measure for late enhancement) and tumor necrosis (P = .002).
Discussion
Our study showed that DCE-MR imaging parameters correlate significantly with MVD and tumor necrosis. We observed a statistically significant correlation between mean MVD and κ5min. MVD is an important parameter to assess tumor angiogenesis in vitro, which has been associated with local invasive growth and hematogenous metastases in retinoblastoma.14 Highly vascularized tissue typically shows rapid enhancement after contrast injection. Indeed, tumors with a high MVD were described by a DCE-MR imaging curve with a steep slope and therefore a high value for κ5min. The parameter κ obtained with curve-pattern analysis has a strong correlation with kep.16 Because kep has been shown to be sensitive to treatment in previous literature,17,18 this finding suggests a similar role for κ.
In addition, we observed a negative correlation between the amount of tumor necrosis and κ17min, a parameter that represents the shape of the curve for a long timeframe of 17 minutes. The occurrence of late enhancement is represented by a DCE-MR imaging curve that gradually but steadily increases, resulting in a low value for κ17min. In the literature, similar curves with late enhancement are associated with tumor necrosis.19,20 With curve-pattern analysis, we can semiquantitatively determine the occurrence of late enhancement, but we cannot differentiate among physiologic factors such as vascularization, transfer rates, volume of the interstitial space, or a combination of these factors. Although clearly necrotic areas were not included in the ROIs, DCE-MR imaging was sensitive enough to be negatively associated with the degree of necrosis, as also observed in some preclinical tumor models.21 In necrotic tumors, the central portions of the tumor become relatively hypovascular and eventually necrotic as the tumor grows.22 This regional hypoxia induces damage to vessels in the border-zones adjacent to central necrosis.23 We assume that at a later stage, contrast may leak from the damaged vessels into the more vital parts of the tumor, causing late enhancement.
Severe hypoxia, present in necrotic tumors, contributes to resistance to radiation therapy and decreases the efficacy of cytotoxic drugs including carboplatin and melphalan.24,25 These are both important chemotherapeutic agents in retinoblastoma treatment for chemoreduction and selective intra-arterial chemotherapy, respectively. Thus, evaluation of κ17min as a noninvasive marker for tumor necrosis could become a useful parameter in the choice of treatment or to monitor treatment response.26,27 Other treatment strategies, such as vascular targeting with antiangiogenic (anti-VEGF drugs) and angiostatic agents, are emerging as possible treatment options for retinoblastoma.28⇓⇓–31 VEGF is correlated with tumor MVD in different tumors.32⇓–34 Although we observed a correlation between κ5min and MVD, we did not find an association between DCE-MR imaging parameters and VEGF, possibly due to our small sample size.
Although not directly related to physiologic parameters, curve-pattern analysis could prove a stable measure for DCE-MR imaging analysis. The method has only recently been suggested and has not yet been generally used. Application in retinoblastoma and the correlation with MVD and necrosis suggest the applicability of this curve-pattern analysis method, which does not require arterial input function or baseline T1 relaxation time measurements.
Some limitations of our study should be addressed. The spatial alignment of MR imaging and histopathology is not perfect. Because of the paucity of clear landmarks, it is difficult to get the same cross-section between MR imaging and histopathologic specimens. However, tumor angiogenesis influences all vital tumor tissue and not only the part in which the region of interest was placed, as can be concluded from the convincing correlation between κ5min and mean MVD. In our study, the intraclass correlation coefficient of 0.53 for κ5min indicated only modest agreement. This low intraclass correlation coefficient was due to only 1 patient with a large and heterogeneous tumor, while for the other 14 patients, the interobserver agreement of both κ-values was excellent. Especially in large heterogeneous tumors, a localized comparison between histopathology and DCE-MR imaging will be useful. For instance, it may be expected that a voxelwise evaluation of DCE-MR imaging data of the whole tumor will separately identify highly vascularized regions and regions near necrotic areas on the basis of high κ5min and low κ17min, respectively. In this respect, a higher field strength of 3T, possibly in combination with a multichannel head coil, would be advantageous for voxelwise evaluations because of the higher signal-to-noise ratio.
Another study limitation is the 17-minute timeframe of DCE-MR imaging after contrast injection. In this timeframe, we did not observe a decrease of signal intensity, which would be interpreted as washout of contrast agent. Although in other tumor types, this curve pattern is common and characteristic for a malignant tumor,35,36 it was not observed in these 15 cases of retinoblastoma. Finally, because of the small size of our patient cohort, our findings have to be considered preliminary; therefore, the discriminatory value of DCE-MR imaging in predicting aggressive behavior of a particular tumor is not possible yet. Our results need validation in a much larger group of patients, preferentially in a multicentric study.
Conclusions
In retinoblastoma, the early phase of the DCE time curve positively correlates with MVD, while the presence of late enhancement is correlated with necrosis. Thus, the potential for DCE-MR imaging to noninvasively assess angiogenesis and necrosis in retinoblastoma tumors is promising and warrants further investigation.
Footnotes
-
Disclosures: Jonas Castelijns—RELATED: Grant: ODAS Foundation, Comments: I am the project leader and received the grant to pay the researchers.
F.R. is financially supported by grants from the ODAS Foundation, Delft, the Netherlands; the National Foundation for the Blind and Visually Impaired, Utrecht, the Netherlands; and the Blindenhulp Foundation, Gravenhage, the Netherlands.
References
- Received November 8, 2011.
- Accepted after revision January 29, 2012.
- © 2012 by American Journal of Neuroradiology


