Advertisement

Main menu

  • Home
  • Content
    • Current Issue
    • Accepted Manuscripts
    • Article Preview
    • Past Issue Archive
    • Video Articles
    • AJNR Case Collection
    • Case of the Week Archive
    • Case of the Month Archive
    • Classic Case Archive
  • Special Collections
    • AJNR Awards
    • Low-Field MRI
    • Alzheimer Disease
    • ASNR Foundation Special Collection
    • Photon-Counting CT
    • View All
  • Multimedia
    • AJNR Podcasts
    • AJNR SCANtastic
    • Trainee Corner
    • MRI Safety Corner
    • Imaging Protocols
  • For Authors
    • Submit a Manuscript
    • Submit a Video Article
    • Submit an eLetter to the Editor/Response
    • Manuscript Submission Guidelines
    • Statistical Tips
    • Fast Publishing of Accepted Manuscripts
    • Graphical Abstract Preparation
    • Imaging Protocol Submission
    • Author Policies
  • About Us
    • About AJNR
    • Editorial Board
    • Editorial Board Alumni
  • More
    • Become a Reviewer/Academy of Reviewers
    • Subscribers
    • Permissions
    • Alerts
    • Feedback
    • Advertisers
    • ASNR Home

User menu

  • Alerts
  • Log in

Search

  • Advanced search
American Journal of Neuroradiology

American Journal of Neuroradiology

ASHNR American Society of Functional Neuroradiology ASHNR American Society of Pediatric Neuroradiology ASSR
  • Alerts
  • Log in

Advanced Search

  • Home
  • Content
    • Current Issue
    • Accepted Manuscripts
    • Article Preview
    • Past Issue Archive
    • Video Articles
    • AJNR Case Collection
    • Case of the Week Archive
    • Case of the Month Archive
    • Classic Case Archive
  • Special Collections
    • AJNR Awards
    • Low-Field MRI
    • Alzheimer Disease
    • ASNR Foundation Special Collection
    • Photon-Counting CT
    • View All
  • Multimedia
    • AJNR Podcasts
    • AJNR SCANtastic
    • Trainee Corner
    • MRI Safety Corner
    • Imaging Protocols
  • For Authors
    • Submit a Manuscript
    • Submit a Video Article
    • Submit an eLetter to the Editor/Response
    • Manuscript Submission Guidelines
    • Statistical Tips
    • Fast Publishing of Accepted Manuscripts
    • Graphical Abstract Preparation
    • Imaging Protocol Submission
    • Author Policies
  • About Us
    • About AJNR
    • Editorial Board
    • Editorial Board Alumni
  • More
    • Become a Reviewer/Academy of Reviewers
    • Subscribers
    • Permissions
    • Alerts
    • Feedback
    • Advertisers
    • ASNR Home
  • Follow AJNR on Twitter
  • Visit AJNR on Facebook
  • Follow AJNR on Instagram
  • Join AJNR on LinkedIn
  • RSS Feeds

AJNR Awards, New Junior Editors, and more. Read the latest AJNR updates

Research ArticleTechnical Note
Open Access

Quantification of Cerebral Artery Motion during the Cardiac Cycle

T. Nishida, M. Kinoshita, H. Tanaka, T. Fujinaka and T. Yoshimine
American Journal of Neuroradiology December 2011, 32 (11) E206-E208; DOI: https://doi.org/10.3174/ajnr.A2354
T. Nishida
aFrom the Departments of Neurosurgery (T.N., M.K., T.F., T.Y.)
  • Find this author on Google Scholar
  • Find this author on PubMed
  • Search for this author on this site
M. Kinoshita
aFrom the Departments of Neurosurgery (T.N., M.K., T.F., T.Y.)
  • Find this author on Google Scholar
  • Find this author on PubMed
  • Search for this author on this site
H. Tanaka
bRadiology (H.T.), Osaka University Graduate School of Medicine, Osaka, Japan.
  • Find this author on Google Scholar
  • Find this author on PubMed
  • Search for this author on this site
T. Fujinaka
aFrom the Departments of Neurosurgery (T.N., M.K., T.F., T.Y.)
  • Find this author on Google Scholar
  • Find this author on PubMed
  • Search for this author on this site
T. Yoshimine
aFrom the Departments of Neurosurgery (T.N., M.K., T.F., T.Y.)
  • Find this author on Google Scholar
  • Find this author on PubMed
  • Search for this author on this site
  • Article
  • Figures & Data
  • Supplemental
  • Info & Metrics
  • Responses
  • References
  • PDF
Loading

Abstract

SUMMARY: This is the first report of success in numerically quantifying and visualizing cardiac cycle−related intracranial vessel motion and pulse waves in human subjects by using 320-detector CTA and a newly developed motion-detection algorithm to better understand the physiologies of intracranial arteries. This new technique promises to provide significant novel information for analyzing the elasticity of cerebral vessels and should be incorporated in the analysis of vessel fluid dynamics.

ABBREVIATIONS

Acom
anterior communicating artery
BA
basilar artery
bpm
beats per minute
CORE
voxels with a value of 10
CTA
CT angiography
FOV
field of view
HALO
surrounding voxels with values ranging from 1 to 9
HR
heart rate
ICA
internal carotid artery
Lt
left
MCA
middle cerebral artery
MRA
MR angiography
PCA
posterior cerebral artery
Rt
right
VOI
voxels of interest

Intracranial vessels can now be noninvasively visualized in 3D by either MRA1,2 or CTA.3 However, these methods were developed with the objects in the FOV remaining static and not subject to external motion. Consequently, investigation of the movement or pulsation of intracranial vessels has not been possible.

From a technical point of view, to visualize and quantify the “motion” or “pulsation” of intracranial vessels, a technique with both sufficient spatial and time resolution is required, because the motion of intracranial vessels is predicted to be extremely small and the whole motion cycle concludes within a single heartbeat, or approximately 1 second.4 Taking advantage of the current most advanced CT modality, which has 320 detectors in a row within a length of 160 mm, we attempted detailed quantification and visualization of intracranial vessel motion and pulsation in conjunction with the development of a novel algorithm for 3D motion quantification.

This is the first report detailing the successful quantification and visualization of intracranial vessel motion and pulsation in a human subject.

Technique

Patients

Ten patients with intracranial aneurysms were included in this retrospective study because healthy volunteers cannot be recruited for ethical reasons and arteries without aneurysms can be approximated as normal vessels. The internal review board of Osaka University Hospital approved research use of the datasets. Detailed patient data are listed in the Table.

View this table:
  • View inline
  • View popup

Patient profiles

Contrast Medium Injection Protocols and CT Acquisition

Contrast medium (ioversol [Optiray], 320 mg I/mL; Covidien Japan, Tokyo, Japan) was injected at a flow rate of 5 mL/s. A test injection of 15 mL of contrast medium was made to determine the circulation time of the MCA for contrast-enhanced imaging. According to the result of the test injection, scanning was started at the appropriate number of seconds after initiation of the contrast injection. In the actual scan, 50 mL of contrast medium was used.

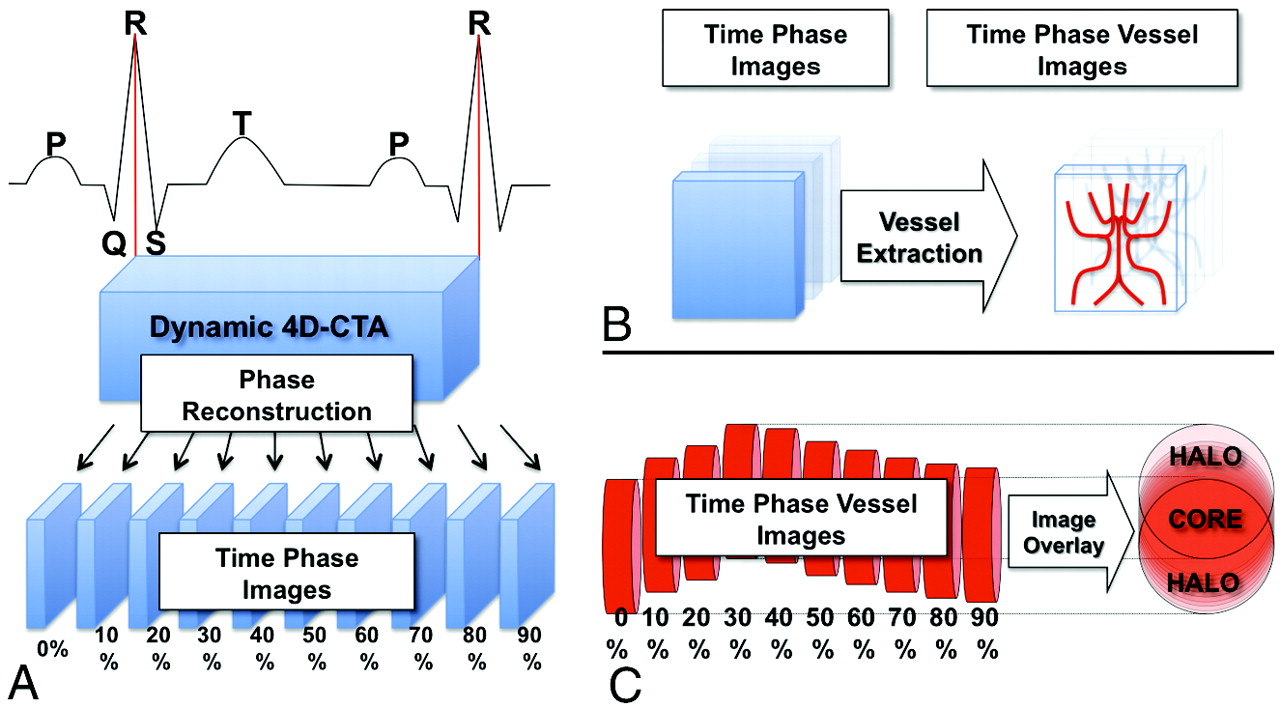
Electrocardiography-triggered CTA was performed on a 320-detector CT system (Aquilion One; Toshiba, Nasu, Japan) by using the following parameters: 120-kV tube voltage, 270-mA tube current, 350-ms gantry rotation time, 160-mm range, and >1 heartbeat. Images for this study were reconstructed by using a kernel optimized for intracranial vessel imaging (window center: each 10% of the R-R interval; image matrix, 512 × 512; section thickness, 0.5 mm; interval, 0.25 mm; section number, 640). Thus, 10 CT volume datasets were created for each patient (Fig 1A). All of the CT datasets were transferred to an off-line workstation and further analyzed by an in-house program developed by using Matlab (MathWorks, Natick, Massachusetts), as detailed below.

Fig 1.
  • Download figure
  • Open in new tab
  • Download powerpoint
Fig 1.

Schematic illustration of the reconstruction of 4D dynamic CTA into time-phase images and the motion-detection algorithm. A, The window center of the time-phase image is set at each 10% of the R-R interval, and the 4D-CTA image of a single heartbeat was reconstructed into 10 phase images. B, Time-phase images were digitalized for vessel extraction. The red columns on the right represent blood vessels at each phase. They are moving and pulsating according to the cardiac cycle. All of the 10 phase images are summed into a single matrix. C, The voxels in which the vessels are always present throughout the 10 phases can be identified as the CORE, and the surrounding voxels, as the HALO.

Analysis Algorithm

First, the intracranial vessels were identified in the raw CT data by adjusting the window and level values with visual confirmation (110–1400), and values <110 or >1400 were substituted for zero, resulting in the deletion of brain tissues and most of the bone structures, leaving signals mostly from the contrast medium. Next, the value 1 was substituted for the voxels with vessels or bones, and zero, for those without. As a result, the original raw CT data of each phase was converted into a 512 × 512 × 640 matrix, consisting of zero or 1 (Fig 1B). Using this dataset, we could now measure the vessel volume within selected 3D VOI, which did not contain bone structures at each phase. Next, the 10 digital data from 1 patient were summed up into a single matrix (Fig 1C). If the intracranial vessel never moved, the summed value of the corresponding voxel was 10. However, if intracranial vessels moved, the summed value of the corresponding voxel ranged from 1 to 9. As a result, the voxels with a value of 10 were termed the “CORE” of each artery, while the surrounding voxels with values ranging from 1 to 9 were termed the “HALO” (Fig 1C).

The Motion Map

Using the above-mentioned algorithm, the original CTA image was converted into a new image, which visualized both the CORE and the HALO of the vessels (Fig 2A). We have named this image the “motion map.”

Fig 2.
  • Download figure
  • Open in new tab
  • Download powerpoint
Fig 2.

The motion map, motion index, and arterial pulse wave of the intracranial arteries. A, A posterior-cranial view of the motion map around the circle of Willis in patient 3 is shown. Red indicates the CORE, and translucent white indicates the HALO. The HALO of the bilateral P1 segment of the PCAs (white arrow) is thicker than that of the bilateral supraclinoid portion of the ICAs (double white arrows), indicating a difference in the magnitude of motion of each vessel. B, The mean ± SD of the motion index in VOI of the major cerebral vessels of the 10 subjects is shown. C, The mean ± SD of a vessel volume change in the left PCA during a single heartbeat for the 10 subjects is shown. This curve resembles a carotid artery pulse wave as well as an aortic pulse wave. D, The mean ± SD of the vessel volume change in the 10 subjects in each region of interest is shown. There is no significant difference in the amplitude among the VOI. The asterisk indicates P < .05; double asterisks, P < .001.

The Motion Index

To numerically quantify the magnitude of vessel motion, we defined the “motion index” as follows. Embedded Image

Theoretically the motion index will positively correspond to the motion of the vessels within the VOI. Eight VOI were manually selected in and around the circle of Willis while avoiding bone structures (On-line Fig 1). These locations were chosen because they can be easily identified anatomically.

Statistical Analysis

Statistical analysis was performed by using JMP software (SAS, Cary, North Carolina). Multiple comparisons were analyzed with analysis of variance, followed by the Tukey-Kramer Honestly Significant Difference test for individual comparisons. P < .05 was considered statistically significant.

Discussion

Our primary objective in this study was to numerically quantify the motion and pulsation of the intracranial arteries during a single heartbeat by using 320-detector CT technology and a newly developed motion-detection algorithm.

First, we were able to visualize the extent of vessel motion in 3D. A representative motion map around the circle of Willis in patient 3 is shown in Fig 2A and On-line Video 1. This image, termed a “motion map,” allows easy visualization of the magnitude of the motion at each arterial location. Numeric comparison of the motion of the cerebral arteries was also possible by using the motion index (Fig 2B). We also found that the motion indexes of the bilateral ICAs were significantly smaller than these of the other vessels (P < .05), while the bilateral PCAs showed significantly larger motion indexes compared with the bilateral ICAs (P < .001). These data indicate that the motion of the P1 segment of the PCA is the largest, while that of the ICA is the smallest, which corresponds very well with the 4D motion movie (On-line Video 2).

Because the motion index could be influenced not only by the movement of the vessel but also by the change in vessel volume during the cardiac cycle, vessel-volume change was also investigated. As evident in Fig 2C, reproduction of the cardiac cycle−related pulse waves of the cerebral arteries was possible. The highest peak was identified at the time phase of 30%–40% of the R-R interval, while the lowest peak was identified at 90%–0%. The volume change between the highest and lowest peak was statistically significant in all examined vessels except the left MCA (On-line Fig 5). Moreover, the observed unique 2-peak pulse wave was similar to the shape of already known cervical arterial and aortic pulse waves (Fig 2C).5 Because there were no significant differences in the amplitude of the change in vessel volume among the VOI and the changes in vessel volume were within only 8.7% on average (Fig 2D), the influence of this factor on the motion index is considered minimal and the significant differences in the motion indexes among the VOI can be considered to derive from the differences in movements themselves.

In conclusion, we developed a novel technique for the visualization and quantification of intracranial vessel motion and pulsation in human subjects. This technique has the potential to provide important novel information for understanding the physiologies of intracranial arteries.

Footnotes

  • T. Nishida and M. Kinoshita contributed equally to this work.

  • This work was supported by the Konika Minolta Imaging Science Foundation, the Association for Nuclear Technology in Medicine, and a Grant-in-Aid for Scientific Research from the Ministry of Education, Science and Culture of Japan.

Indicates open access to non-subscribers at www.ajnr.org

References

  1. 1.↵
    1. Ross JS,
    2. Masaryk TJ,
    3. Modic MT,
    4. et al
    . Magnetic resonance angiography of the extracranial carotid arteries and intracranial vessels: a review. Neurology 1989;39:1369–76
    Abstract/FREE Full Text
  2. 2.↵
    1. Ross JS,
    2. Masaryk TJ,
    3. Modic MT,
    4. et al
    . Intracranial aneurysms: evaluation by MR angiography. AJR Am J Roentgenol 1990;155:159–65
    PubMed
  3. 3.↵
    1. Prokop M
    . Multislice CT angiography. Eur J Radiol 2000;36:86–96
    CrossRefPubMed
  4. 4.↵
    1. Quarteroni A,
    2. Formaggia L
    . Mathematical Modeling and Numerical Simulation of the Cardiovascular System. Amsterdam, the Netherlands: Elsevier; 2004
  5. 5.↵
    1. O'Rourke MF,
    2. Pauca A,
    3. Jiang XJ
    . Pulse wave analysis. Br J Clin Pharmacol 2001;51:507–22
    CrossRefPubMed
  • Received June 30, 2010.
  • Accepted after revision September 5, 2010.
  • © 2011 by American Journal of Neuroradiology
View Abstract
PreviousNext
Back to top

In this issue

American Journal of Neuroradiology: 32 (11)
American Journal of Neuroradiology
Vol. 32, Issue 11
1 Dec 2011
  • Table of Contents
  • Index by author
Advertisement
Print
Download PDF
Email Article

Thank you for your interest in spreading the word on American Journal of Neuroradiology.

NOTE: We only request your email address so that the person you are recommending the page to knows that you wanted them to see it, and that it is not junk mail. We do not capture any email address.

Enter multiple addresses on separate lines or separate them with commas.
Quantification of Cerebral Artery Motion during the Cardiac Cycle
(Your Name) has sent you a message from American Journal of Neuroradiology
(Your Name) thought you would like to see the American Journal of Neuroradiology web site.
CAPTCHA
This question is for testing whether or not you are a human visitor and to prevent automated spam submissions.
Cite this article
T. Nishida, M. Kinoshita, H. Tanaka, T. Fujinaka, T. Yoshimine
Quantification of Cerebral Artery Motion during the Cardiac Cycle
American Journal of Neuroradiology Dec 2011, 32 (11) E206-E208; DOI: 10.3174/ajnr.A2354

Citation Manager Formats

  • BibTeX
  • Bookends
  • EasyBib
  • EndNote (tagged)
  • EndNote 8 (xml)
  • Medlars
  • Mendeley
  • Papers
  • RefWorks Tagged
  • Ref Manager
  • RIS
  • Zotero
0 Responses
Respond to this article
Share
Bookmark this article
Quantification of Cerebral Artery Motion during the Cardiac Cycle
T. Nishida, M. Kinoshita, H. Tanaka, T. Fujinaka, T. Yoshimine
American Journal of Neuroradiology Dec 2011, 32 (11) E206-E208; DOI: 10.3174/ajnr.A2354
del.icio.us logo Twitter logo Facebook logo Mendeley logo
  • Tweet Widget
  • Facebook Like
  • Google Plus One
Purchase

Jump to section

  • Article
    • Abstract
    • ABBREVIATIONS
    • Technique
    • Discussion
    • Footnotes
    • References
  • Figures & Data
  • Supplemental
  • Info & Metrics
  • Responses
  • References
  • PDF

Related Articles

  • PubMed
  • Google Scholar

Cited By...

  • Intracranial Aneurysms: Wall Motion Analysis for Prediction of Rupture
  • Cardiac Cycle-Related Volume Change in Unruptured Cerebral Aneurysms: A Detailed Volume Quantification Study Using 4-Dimensional CT Angiography
  • Crossref (9)
  • Google Scholar

This article has been cited by the following articles in journals that are participating in Crossref Cited-by Linking.

  • Whole‐brain vessel wall MRI: A parameter tune‐up solution to improve the scan efficiency of three‐dimensional variable flip‐angle turbo spin‐echo
    Qi Yang, Zixin Deng, Xiaoming Bi, Shlee S. Song, Konrad H. Schlick, Nestor R. Gonzalez, Debiao Li, Zhaoyang Fan
    Journal of Magnetic Resonance Imaging 2017 46 3
  • Intracranial Aneurysms: Wall Motion Analysis for Prediction of Rupture
    A.E. Vanrossomme, O.F. Eker, J.-P. Thiran, G.P. Courbebaisse, K. Zouaoui Boudjeltia
    American Journal of Neuroradiology 2015 36 10
  • Cardiac Cycle-Related Volume Change in Unruptured Cerebral Aneurysms
    Junko Kuroda, Manabu Kinoshita, Hisashi Tanaka, Takeo Nishida, Hajime Nakamura, Yoshiyuki Watanabe, Noriyuki Tomiyama, Toshiyuki Fujinaka, Toshiki Yoshimine
    Stroke 2012 43 1
  • Quantification of Intracranial Aneurysm Morphodynamics from ECG-gated CT Angiography
    Azadeh Firouzian, Rashindra Manniesing, Coert T. Metz, Roelof Risselada, Stefan Klein, Fop van Kooten, Miriam C.J.M. Sturkenboom, Aad van der Lugt, Wiro J. Niessen
    Academic Radiology 2013 20 1
  • Feasibility of Quantification of Intracranial Aneurysm Pulsation with 4D CTA with Manual and Computer-Aided Post-Processing
    Till Illies, Dennis Saering, Manabu Kinoshita, Toshiyuki Fujinaka, Maxim Bester, Jens Fiehler, Noriyuki Tomiyama, Yoshiyuki Watanabe, Nima Etminan
    PLOS ONE 2016 11 11
  • Fibromuscular dysplasia unraveled: The pulsation-induced microtrauma and reactive hyperplasia theory
    Daniel J. Miller, Horia Marin, Todd Aho, Lonni Schultz, Angelos Katramados, Panayiotis Mitsias
    Medical Hypotheses 2014 83 1
  • Analysis of the influence of imaging-related uncertainties on cerebral aneurysm deformation quantification using a no-deformation physical flow phantom
    Daniel Schetelig, Jan Sedlacik, Jens Fiehler, Andreas Frölich, Tobias Knopp, Thilo Sothmann, Jonathan Waschkewitz, René Werner
    Scientific Reports 2018 8 1
  • Reduction of misregistration on cerebral four-dimensional computed tomography angiography images using advanced patient motion correction reconstruction
    Yuki Kunitomi, Yoshiyuki Watanabe, Atsuko Arisawa, Akio Tsukabe, Hisashi Tanaka, Hiroto Takahashi, Takeo Nishida, Manabu Kinoshita, Hajime Nakamura, Noriyuki Tomiyama
    Japanese Journal of Radiology 2016 34 9
  • Preliminary Findings on the Potential Use of Magnetic Resonance Elastography to Diagnose Lacunar Infarction
    Lingjie Wang, Jun Ke, Xiaoyin Hu, Mo Zhu, Yixing Yu
    Neuropsychiatric Disease and Treatment 2022 Volume 18

More in this TOC Section

  • 3D Fast Spin-Echo T1 Black-Blood Imaging for the Diagnosis of Cervical Artery Dissection
  • The Kety-Schmidt Technique for Quantitative Perfusion and Oxygen Metabolism Measurements in the MR Imaging Environment
  • A Swine Model to Analyze Arterial Structural Changes Induced by Mechanical Thrombectomy
Show more Technical Note

Similar Articles

Advertisement

Indexed Content

  • Current Issue
  • Accepted Manuscripts
  • Article Preview
  • Past Issues
  • Editorials
  • Editor's Choice
  • Fellows' Journal Club
  • Letters to the Editor
  • Video Articles

Cases

  • Case Collection
  • Archive - Case of the Week
  • Archive - Case of the Month
  • Archive - Classic Case

More from AJNR

  • Trainee Corner
  • Imaging Protocols
  • MRI Safety Corner
  • Book Reviews

Multimedia

  • AJNR Podcasts
  • AJNR Scantastics

Resources

  • Turnaround Time
  • Submit a Manuscript
  • Submit a Video Article
  • Submit an eLetter to the Editor/Response
  • Manuscript Submission Guidelines
  • Statistical Tips
  • Fast Publishing of Accepted Manuscripts
  • Graphical Abstract Preparation
  • Imaging Protocol Submission
  • Evidence-Based Medicine Level Guide
  • Publishing Checklists
  • Author Policies
  • Become a Reviewer/Academy of Reviewers
  • News and Updates

About Us

  • About AJNR
  • Editorial Board
  • Editorial Board Alumni
  • Alerts
  • Permissions
  • Not an AJNR Subscriber? Join Now
  • Advertise with Us
  • Librarian Resources
  • Feedback
  • Terms and Conditions
  • AJNR Editorial Board Alumni

American Society of Neuroradiology

  • Not an ASNR Member? Join Now

© 2025 by the American Society of Neuroradiology All rights, including for text and data mining, AI training, and similar technologies, are reserved.
Print ISSN: 0195-6108 Online ISSN: 1936-959X

Powered by HighWire