
Article Figures & Data
Figures
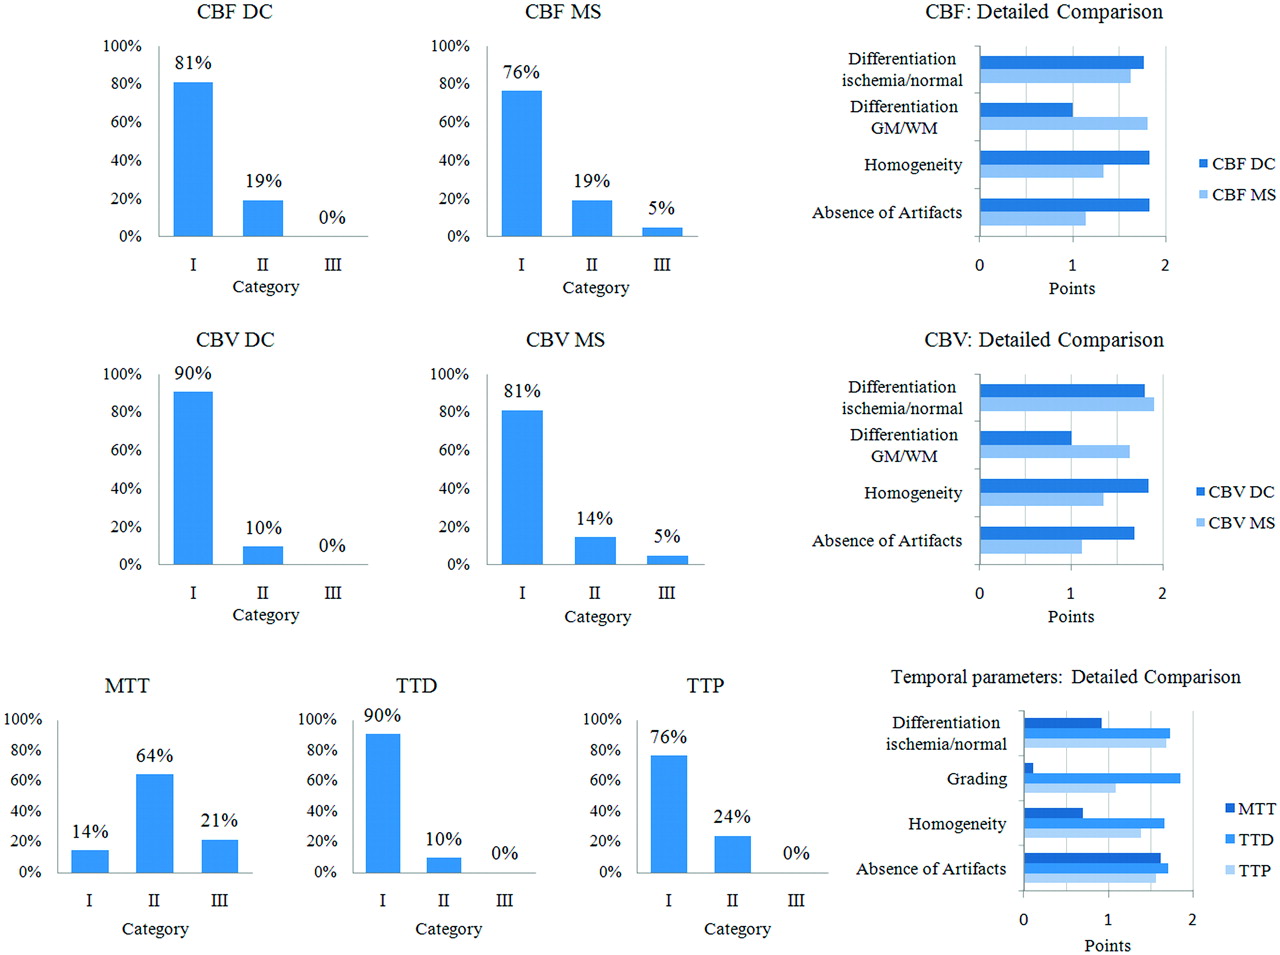
- Fig 1.
Overview of the qualitative results of 42 examinations. Detailed information on the quality aspects is provided by the diagrams on the right.
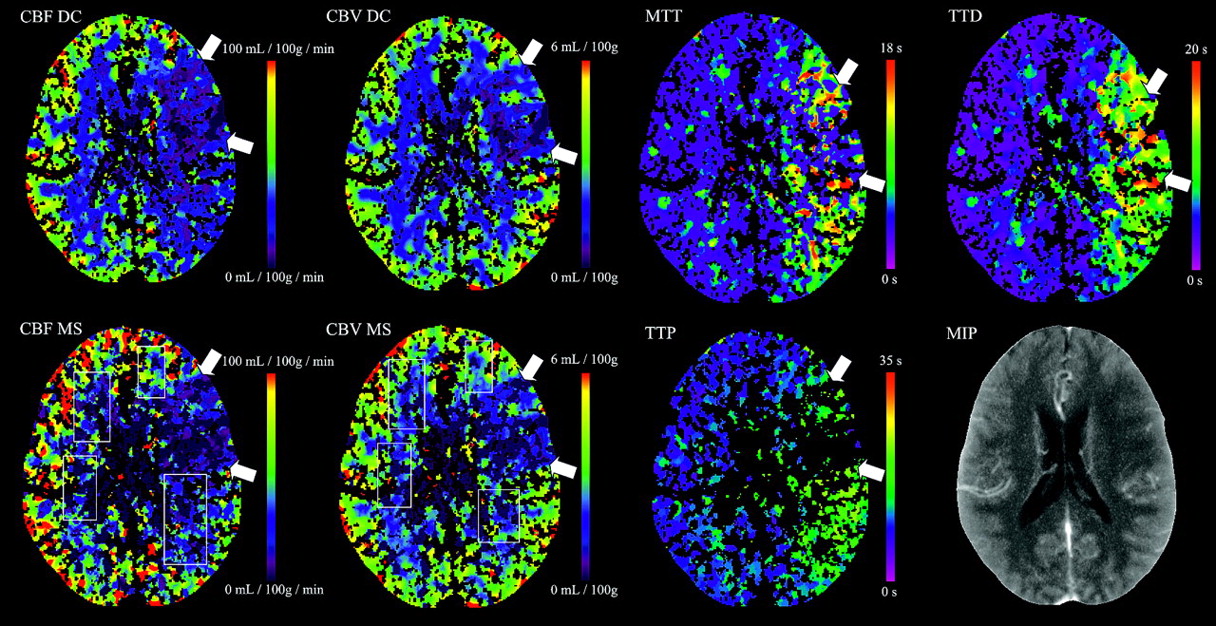
- Fig 2.
Color maps of a 63-year-old man with right middle cerebral artery infarction. CBFDC and CBVDC as well as CBFMS and CBVMS color maps are of high quality. The ischemic lesion is more clearly delineated on TTD and TTP maps compared with MTT. TTD provides the highest contrast of all temporal parameter maps.
- Fig 3.
Examinations with lower source-data quality. CBFMS and CBVMS maps are of reduced quality (category II, see rectangles). Whereas TTP and MTT quality is markedly reduced, TTD quality is good. The case was still considered to be interpretable with both DC and MS.
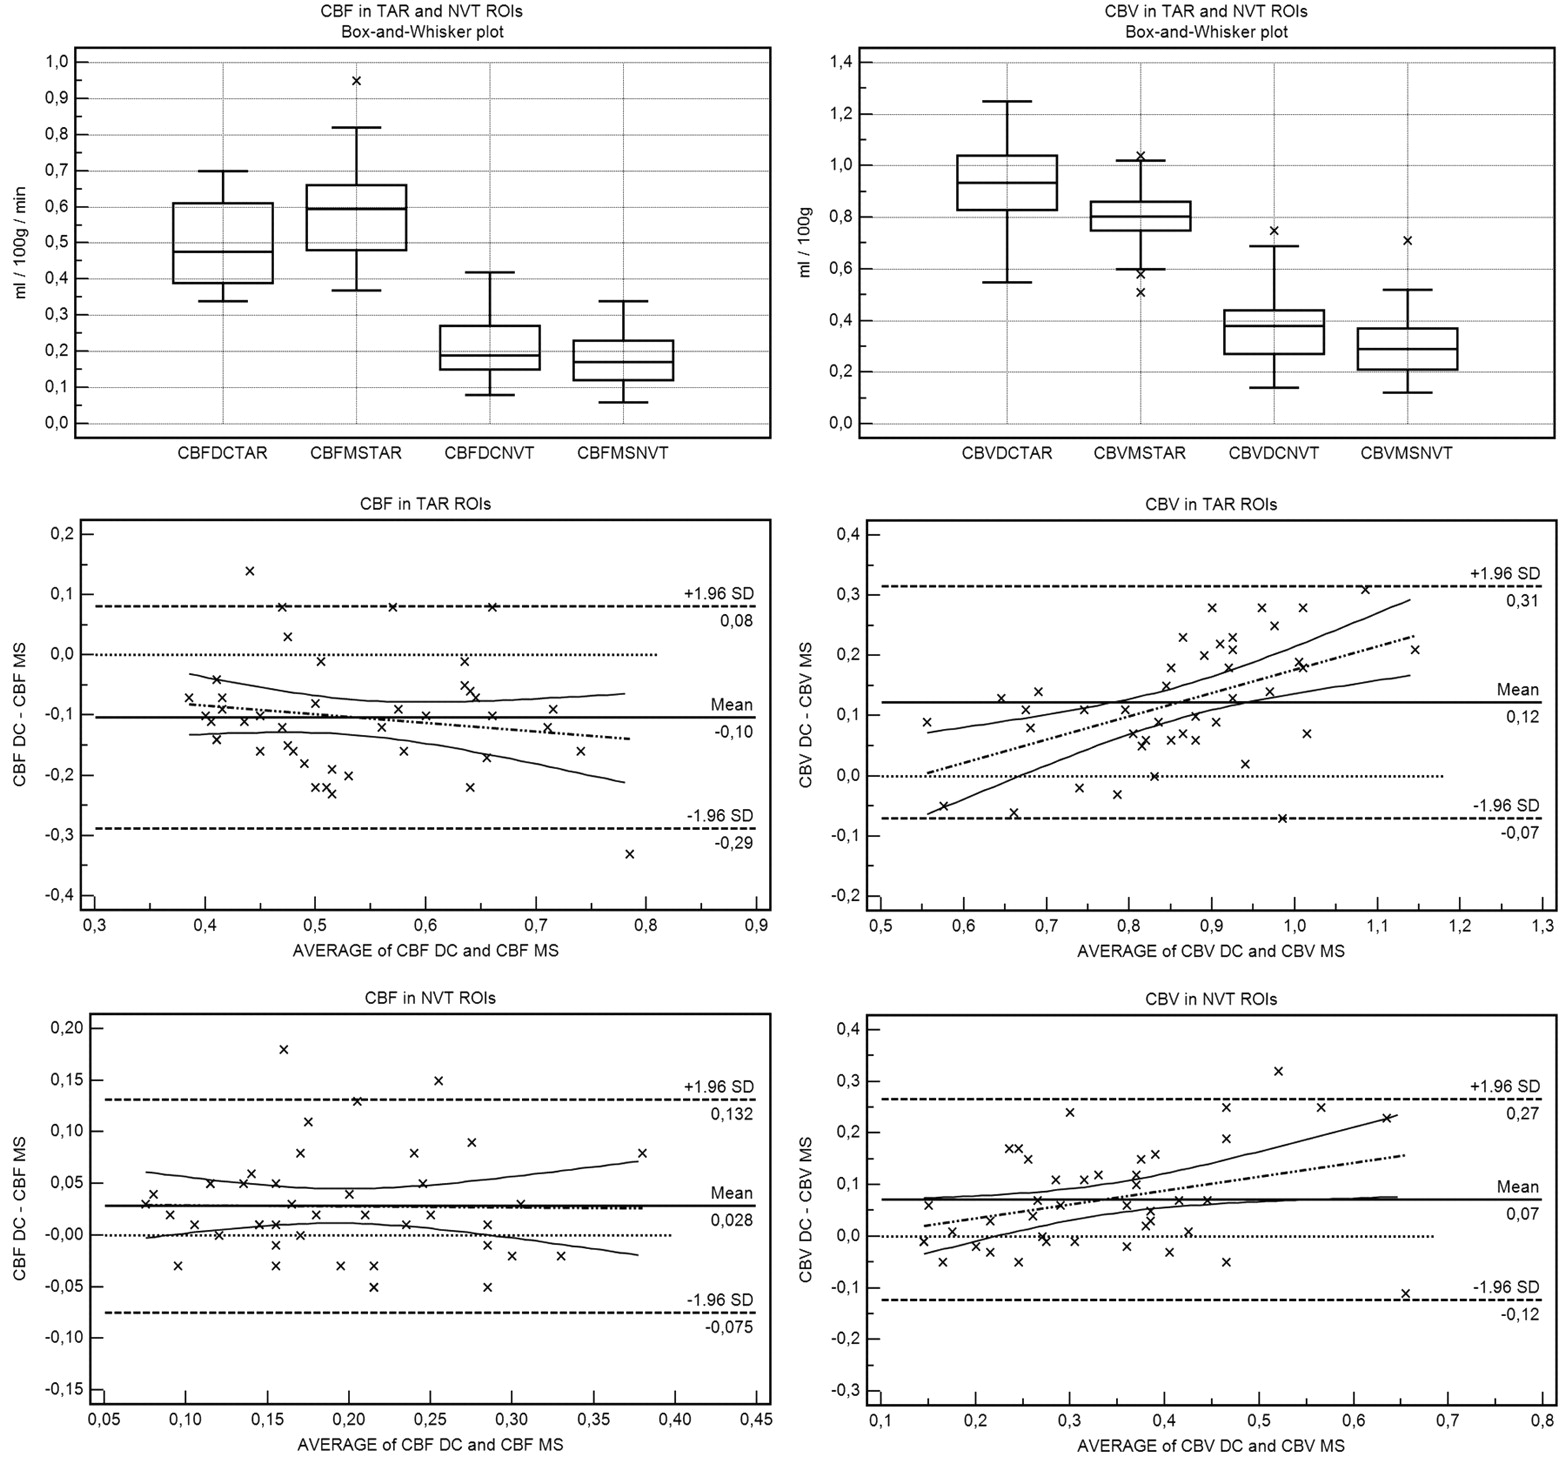
- Fig 4.
Box-and-whisker and Bland-Altman plots demonstrate that rCBFDC is ≤rCBFMS in suspected penumbra (TAR) regions of interest and rCBVDC is ≥rCBVMS in suspected core (NVT) regions of interest. While there is no slope (no significant relationship between method difference and size of measurement) for CBF, for CBV, there is a positive slope in all regions of interest (proportional difference).
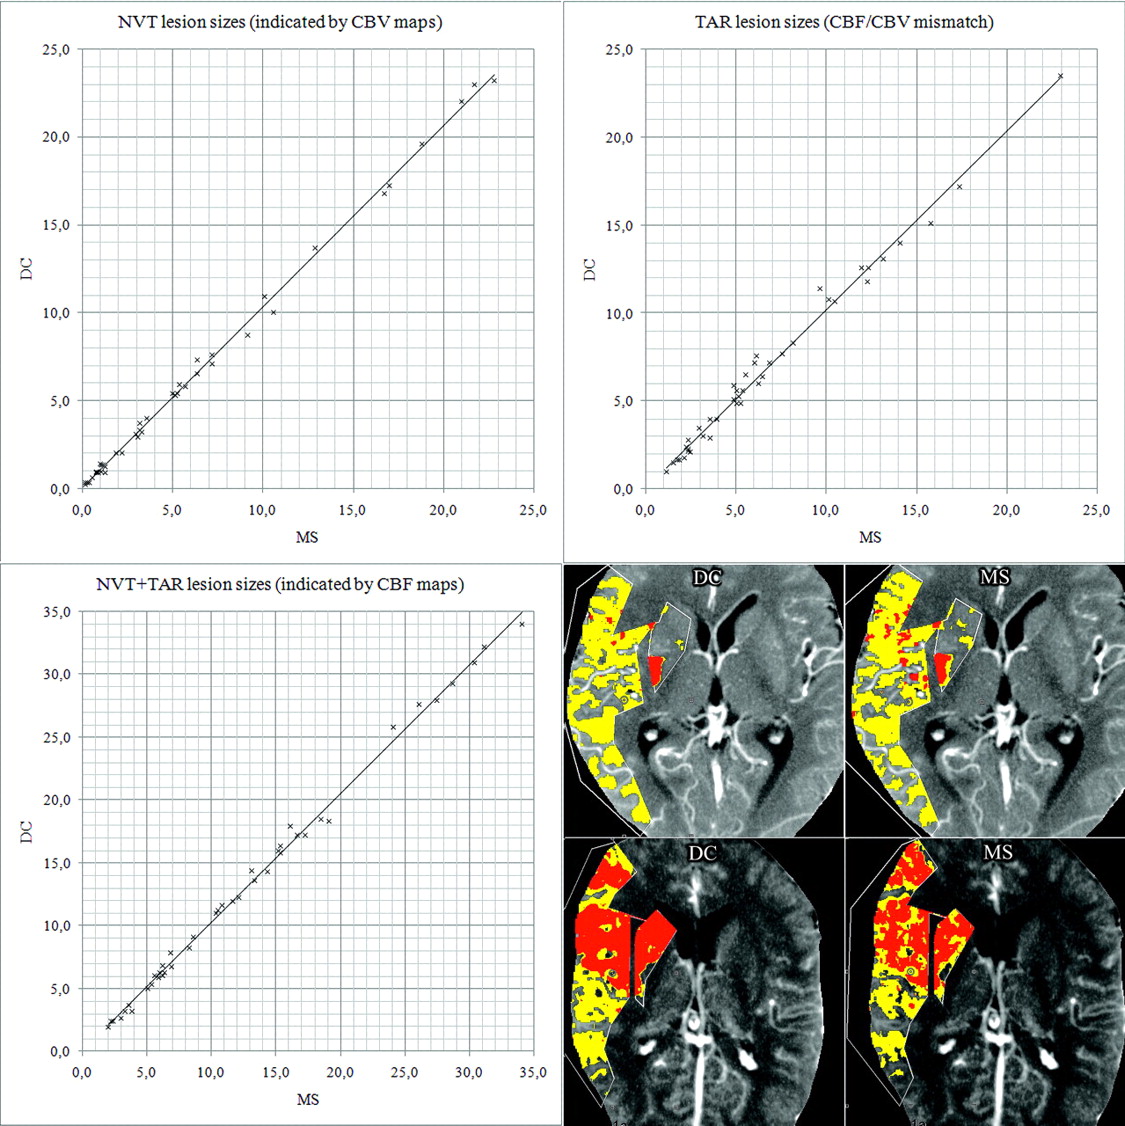
- Fig 5.
Comparison of PCT lesion sizes (DC versus MS). All units are in cubic centimeters. Scatterplots show excellent agreement: NVTDC = 1.03 × NVTMS (R2 = 0.998), TARDC = 1.02 × TARMS (R2 = 0.989), and (NVTDC + TARDC) = 1.03 × (NVTMS + TARMS) (R2 = 0.997). On the lower right, screenshots of 2 cases are shown as examples. Red indicates NVT; yellow, TAR.


Tables
CBFDC CBFMS CBVDC CBVMS MTT TTD TTP Quality score (mean + SD) 6.2 ± 1.3 5.9 ± 1.8 6.3 ± 1.1 6.0 ± 1.2 3.4 ± 2.1 7.0 ± 1.1 5.8 ± 1.2 -
a The average score is on a scale from 0 to 8 points.
-
ROIa GM WM Suspected Penumbra Suspected Core Absolute Absolute Relative Absolute Relative Absolute CBFDC(mL/100 g/min) 65 ± 4.7 30 ± 2.7 .48 ± .11 29 ± 6.6 .21 ± .08 12 ± 4.2 CBFMS (mL/100 g/min) 61 ± 2.4 29 ± 1.7 .59 ± .12 32 ± 6.2 .18 ± .08 9 ± 4.0 Relative difference DC-MS +6%b +5%b −.11b −12%b +.03b +24%b Bland-Altman plot slope Yesc Yesc No No No No Potentially relevant differences 5% 5% 17% 7% 10% 10% CBVDC (mL/100 g) 3.5 ± .2 1.9 ± .2 .92 ± .16 2.9 ± .6 .37 ± .15 1.1 ± .44 CBVMS (mL/100 g) 3.6 ± .2 1.9 ± .1 .80 ± .11 2.6 ± .3 .30 ± .12 .9 ± 0.35 Relative difference DC-MS −4%b −2% +.12b +11%b +.17b +20%b Bland-Altman plot slope Yesc Yesc Yesc Yesc Yesc Yesc Potentially relevant differences 7% 5% 26% 12% 12% 14% MTT 3.3 ± .3s 4.0 ± .6s 2.3 ± .67 7.6 ± 2.2s 2.1 ± .66 6.9 ± 2.1s TTD 3.7 ± .6s 4.8 ± 1.0s 2.9 ± .87 10.6 ± 3.1s 3.7 ± 1.0 13.1 ± 3.5s TTP 8.1 ± 2.4s 9.3 ± 2.5s 1.7 ± .33 13.4 ± 3.3s 1.8 ± .37 14.2 ± 3.7s -
a ROI values are mean ± SD.
-
b Statistically significant difference of DC and MS medians (Wilcoxon signed rank test, P < .05).
-
c Statistically significant relationship of the method difference (DC − MS) versus the size of the measurement (DC + MS)/2 (Wilcoxon test, P < .05). “Yes” indicates a proportional difference; “no” indicates a systematic nonproportional or random difference.
-
Score NVTDC NVTMS NVTDC + TARDC NVTMS + TARMS Mean ± SD [interquartile range] 7.6 ± 1.9 [7.0–9.0] 7.6 ± 1.9 [7.0–9.0] 6.0 ± 2.1 [4.0–7.9] 6.0 ± 2.2 [4.0–7.5] -
a Scores for 1 brain section in orientation to ASPECTS (minimum = 0, maximum = 10).
-
In this issue


Jump to section
Related Articles
Cited By...
- What is the impact of head movement on automated CT perfusion mismatch evaluation in acute ischemic stroke?
- Hemodynamic forces tune the arrest, adhesion and extravasation of circulating tumor cells
- Computed Tomographic Perfusion Predicts Poor Outcomes in a Randomized Trial of Endovascular Therapy
- The feasibility of low-concentration contrast and low tube voltage in computed tomography perfusion imaging: an animal study
- Whole-brain Volume Perfusion Computed Tomography: Acquisition Techniques and Radiation Dose
- Comparison of Perfusion CT Software to Predict the Final Infarct Volume After Thrombectomy
- Perfusion Deficits and Mismatch in Patients with Acute Lacunar Infarcts Studied with Whole-Brain CT Perfusion
- Vertebral Artery Hypoplasia: Frequency and Effect on Cerebellar Blood Flow Characteristics
- Prognostic Evaluation Based on Cortical Vein Score Difference in Stroke
- Comments on an Article by Kamalian et al
- CT Perfusion in Acute Ischemic Stroke: A Comparison of 2-Second and 1-Second Temporal Resolution