
Abstract
BACKGROUND AND PURPOSE: PCT postprocessing commonly uses either the MS or a variant of the DC approach for modeling of voxel-based time-attenuation curves. There is an ongoing discussion about the respective merits and limitations of both methods, frequently on the basis of theoretic reasoning or simulated data. We performed a qualitative and quantitative comparison of DC and MS by using identical source datasets and preprocessing parameters.
MATERIALS AND METHODS: From the PCT data of 50 patients with acute ischemic stroke, color maps of CBF, CBV, and various temporal parameters were calculated with software implementing both DC and MS algorithms. Color maps were qualitatively categorized. Quantitative region-of-interest–based measurements were made in nonischemic GM and WM, suspected penumbra, and suspected infarction core. Qualitative results, quantitative results, and PCT lesion sizes from DC and MS were statistically compared.
RESULTS: CBF and CBV color maps based on DC and MS were of comparably high quality. Quantitative CBF and CBV values calculated by DC and MS were within the same range in nonischemic regions. In suspected penumbra regions, average CBFDC was lower than CBFMS. In suspected infarction core regions, average CBVDC was similar to CBVMS. Using adapted tissue-at-risk/nonviable-tissue thresholds, we found excellent correlation of DC and MS lesion sizes.
CONCLUSIONS: DC and MS yielded comparable qualitative and quantitative results. Lesion sizes indicated by DC and MS showed excellent agreement when using adapted thresholds. In all cases, the same therapy decision would have been made.
Abbreviations
- AIF
- arterial input function
- ASPECTS
- Alberta Stroke Program Early CT Score
- CBF
- cerebral blood flow
- CBV
- cerebral blood volume
- DC
- deconvolution
- GM
- gray matter
- LMS
- least mean square
- MIP
- maximum intensity projection
- MS
- maximum slope
- MTT
- mean transit time
- NVT
- nonviable tissue
- PCA
- posterior cerebral artery
- PCT
- perfusion CT
- rCBF
- relative cerebral blood flow
- rCBV
- relative cerebral blood volume
- rMTT
- relative mean transit time
- rTTD
- relative time to drain
- rTTP
- relative time to peak
- ROI
- region of interest
- SNR
- signal-to-noise ratio
- SVD
- singular value decomposition
- TAC
- time attenuation curve
- TAR
- tissue at risk
- TTD
- time to drain
- TTP
- time to peak
- TTS
- time to start
- WM
- white matter
PCT is a well-established technique in acute stroke imaging. PCT has been proved superior to noncontrast CT1–3 and equivalent to MR imaging in terms of infarct and penumbra characterization and selection for reperfusion therapy.4–6 Quantitative perfusion parameters such as CBF, CBV, TTP, MTT, and TTD can be calculated and displayed as color maps. Indications for reperfusion therapy may be based visually on a mismatch of CBF and CBV and/or quantitatively on thresholds defining TAR (penumbra) and NVT7–9—possibly even in an extended time window.10,11
Commercial PCT postprocessing software currently available is based on a variety of implementations of DC or MS models. It has recently been shown that quantitative values as well as color maps can be significantly different among software/algorithms, even when using identical source data.12 In terms of promoting PCT standardization,13,14 evaluating quantitative and qualitative differences of PCT algorithms is of great importance. The objective of our study was to determine quantitative as well as qualitative comparability of delay-insensitive DC and MS algorithms by systematically analyzing corresponding color maps as well as region-of interest–based measurements (CBF, CBV, and temporal parameters) of both methods.
Materials and Methods
Datasets
We retrospectively enrolled in our study 50 PCT source datasets of patients with acute onset of neurologic symptoms in ≤9 hours. These datasets were acquired on multisection CT scanners after administration of a compact contrast bolus with an injection rate of at least 5 mL/s via power-injector through an 18-gauge intravenous line, by using the following scanning parameters: section thickness, 10–12 mm; tube voltage, 80 kV(peak); tube current, 180–235 mAs; scanning delay, 4 seconds; scanning time, 40 seconds; and temporal resolution, 1 second. Two sections at the level of the basal ganglia were imaged. In the final evaluation, only the section demonstrating the largest extent of ischemia was selected. Datasets without any hemodynamic disturbance as well as datasets with severe motion artifacts or inadequate contrast bolus were excluded from the analysis.
Postprocessing
Calculation of perfusion parameters and color maps was performed with a commercial perfusion package (VPCT-Neuro; Siemens Healthcare, Forchheim, Germany) containing implementations of a DC model and an MS model as the final step of an otherwise identical preprocessing. Both algorithms are explained in the On-line Appendix. For each dataset, processing was done semiautomatically with default settings as used in routine clinical work. Brain parenchyma was first isolated by skull bone contour findings; CSF and calcifications were removed by thresholding. The AIF was measured in suitable branches of the middle or anterior cerebral artery; the venous outflow (and the maximum enhancement reference) was taken from the superior sagittal sinus, both by semiautomatic vessel detection. Major vessels were removed by relative thresholding applied to the maximum voxel enhancement. Standard relative thresholds were 8% of the maximum enhancement in the superior sagittal sinus. Finally, an adaptive spatial filtering was performed that did not smooth over edges and vessel borders. All settings were completely identical for DC and MS. All quantitative values were determined without including larger vascular structures.
Qualitative Analysis
Color maps were visually analyzed and rated by 2 board-certified senior radiologists/neuroradiologists in a consensus reading by using the following scoring system: quality of GM/WM differentiation (for CBF and CBV maps only), grading (for temporal parameter maps only), differentiation of ischemic and normal tissue, homogeneity (contrast, contours, coherency/dissemination of ischemic lesions), and compensation of artifacts were each rated on a 3-point scale (minimum, 0; maximum, 2 points). The scores of the 4 categories were added, resulting in a maximum score of 8. Examinations with a score of >4 points were considered to be of high quality and high diagnostic value (category I); those with scores of ≤4 points and ≥2 points were considered to be of medium quality but still sufficient for diagnosis (category II). Those with a score <2 points were considered poor quality and insufficient for diagnosis (category III).
Quantitative Analysis
To retrieve corresponding quantitative measurements from different healthy and ischemic regions of the brain, 4 different regions of interest were contoured manually (freehand) in each case: In the nonischemic hemisphere, cortical GM and subcortical WM were outlined on the MIP, yielding GM and WM regions of interest, respectively. In the ischemic hemisphere, the GM region with significantly reduced CBF (rCBF, ≤60% of contralateral regions, which corresponded to an absolute threshold of ∼34 mL/100 g/min on the CBFMS) but without a significant decrease in CBV was outlined as “suspected penumbra”; this rCBF threshold is in accordance with TAR values reported in the literature for MS7,15,16 and DC.4,8,17,18 The GM region with significantly reduced CBF and significantly reduced CBV (rCBV, ≤40% of contralateral regions, which corresponded to an absolute threshold of ∼1.2 mL/100 g on the CBVMS maps) was outlined as “suspected core”; this rCBV threshold is in accordance with NVT values reported in the literature for MS7,16 and DC.8,9,19 All regions of interest served for retrieving quantitative measurements for the quantitative comparison of corresponding DC and MS perfusion parameters only; the regions were not meant to delineate final tissue outcome.
PCT Lesion Sizes
Finally, to examine whether there would have been a difference in treatment decisions, we measured PCT lesion sizes for DC versus MS. NVT, TAR, and NVT + TAR lesions were determined by applying adapted absolute CBF/CBV thresholds. Because our results indicated that the absolute CBFDC threshold for defining TAR is lower than the absolute CBFMS threshold, 27 mL/100 g/min and 34 mL/100 g/min, respectively, were selected. CBVDC and CBVMS thresholds for defining NVT were both 1.2 mL/100 g.
In addition to measuring DC and MS lesion sizes, PCT lesion extents were compared by determining PCT lesion scores in orientation to the ASPECTS used in prior studies for PCT lesion assessment.20 In each case, corresponding NVT lesion scores (indicated by CBVDC and CBVMS maps, respectively) and NVT + TAR lesion scores (the whole ischemic area, indicated by CBFDC and CBFMS maps, respectively) were compared. To account for only 1 section per examination, we used the following modified 10-point score: M1, M2, M3, insular ribbon, caudate nucleus, lentiform nucleus, internal capsule, anterior cerebral artery, PCA/occipital lobe, and PCA/thalamus were attributed 1 point each if nonaffected and zero if affected.
Statistical Analysis
Statistical analysis was performed with MedCalc 10 (MedCalc Software, Mariakerke, Belgium) and R 2.9.2 (http://www.r-project.org). Qualitative scores were compared by using the Wilcoxon signed rank test. Quantitative region-of-interest values calculated with DC and MS were compared by using descriptive statistics and Bland-Altman plots; median method differences and the relationship between the method difference (DC − MS) and the average size of measurements (DC + MS)/2 were examined separately for all regions of interest with Bland-Altman plots and Wilcoxon signed rank tests. The temporal parameters MTT, TTD, and TTP refer to quantities that are differently defined and thus cannot be compared directly; therefore, only correlation was determined. To discriminate between negligible minor method differences and major method differences that are potentially relevant in terms of affecting lesion extent on PCT color maps diagnosis respectively, limits of agreements were set. Differences exceeding 0 ± 2 SD of (DC + MS)/2 were considered as potentially relevant. NVT, TAR, and NVT + TAR lesion sizes depicted on DC and MS maps were compared by using scatterplots with regression lines. Likewise, PCT lesion scores (modified ASPECTS) of DC and MS were compared.
Results
Of 50 datasets, 8 had to be excluded from the analysis because they did not meet the criteria defined in the “Materials and Methods” section. The mean age of the remaining 42 patients (n = 23 men, n = 19 women) was 63.8 years (range, 44–84 years). The average computational time on a standard workstation needed to generate all color maps of 1 section was ∼2 seconds for both DC and MS.
Qualitative Results
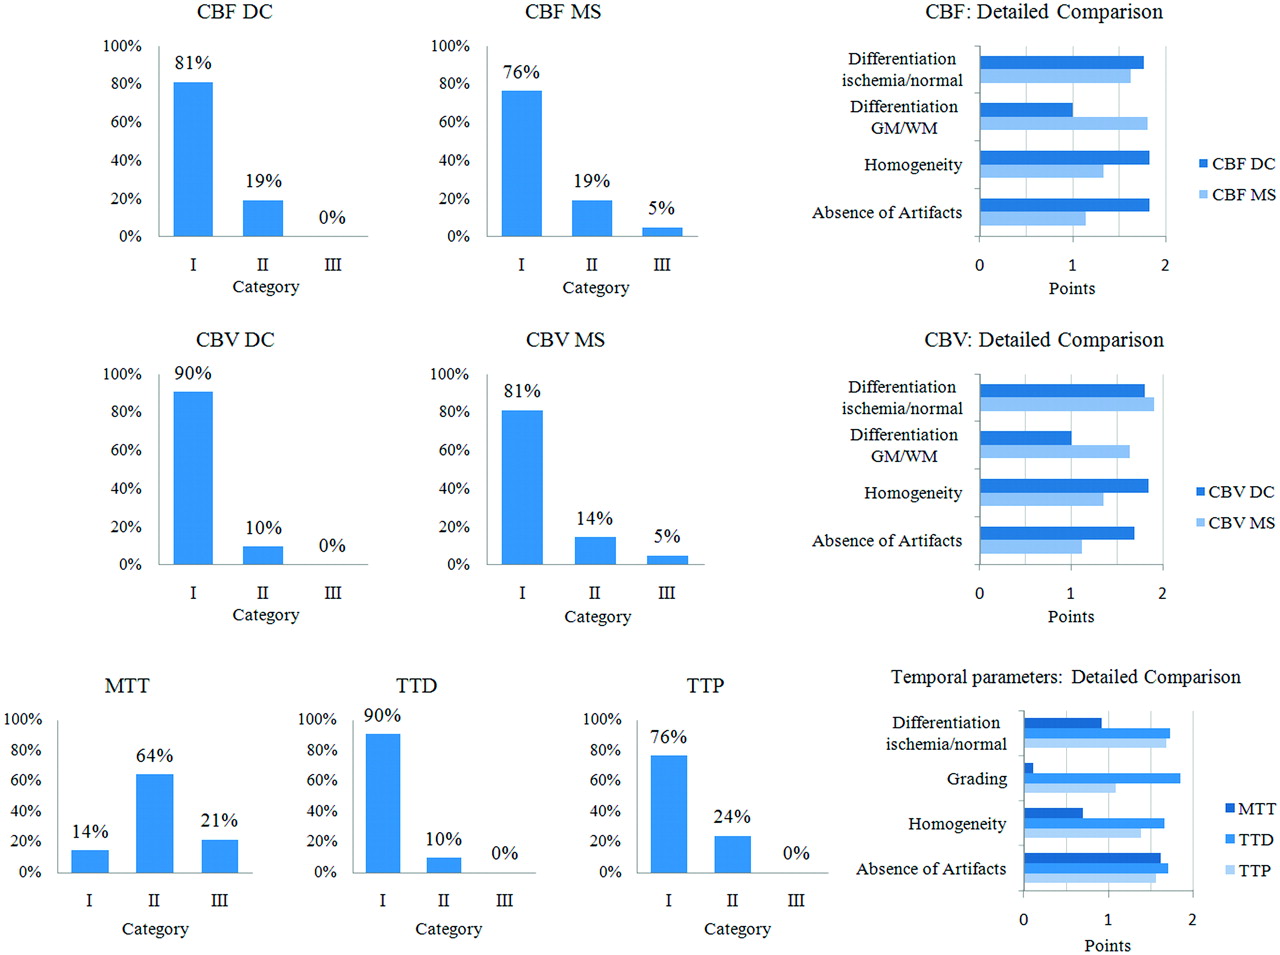
An overview of the qualitative results is given in Table 1 and Fig 1.
Results of the qualitative analysisa

Overview of the qualitative results of 42 examinations. Detailed information on the quality aspects is provided by the diagrams on the right.
On the MTT maps, ischemic areas appeared less well-defined compared with TTD and TTP. Differences were statistically significant for MTT versus TTD and MTT versus TTP (both P < .0001). The average performances (mean quality score) of TTD and TTP were high, with TTD being slightly superior to TTP (P < .0001).
The average performances of CBFDC and CBFMS as well as CBVDC and CBVMS maps were high. Differences of CBFDC and CBFMS as well as CBVDC and CBVMS were not statistically significant (P = .0635 and P = .0968, respectively). In some source datasets (n = 7) with poor SNR and TAC quality, however, CBF and CBV maps calculated with DC were superior to those calculated with MS, due to higher homogeneity and fewer artifacts.
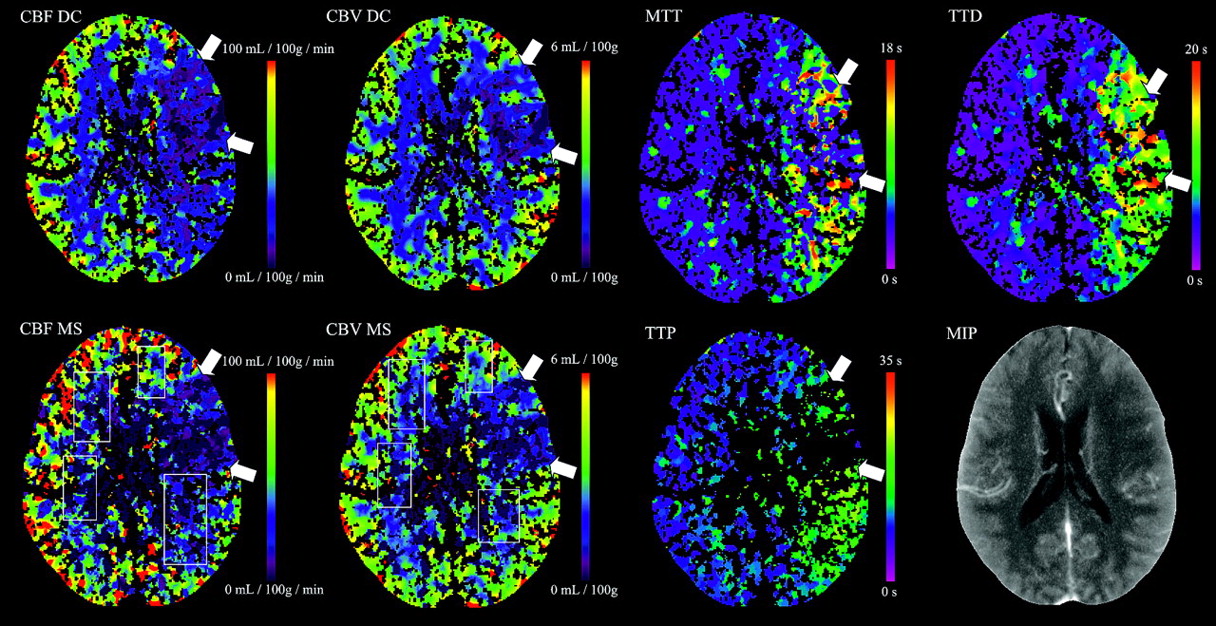
Examples of corresponding maps are shown in Figs 2 and 3.

Color maps of a 63-year-old man with right middle cerebral artery infarction. CBFDC and CBVDC as well as CBFMS and CBVMS color maps are of high quality. The ischemic lesion is more clearly delineated on TTD and TTP maps compared with MTT. TTD provides the highest contrast of all temporal parameter maps.

Examinations with lower source-data quality. CBFMS and CBVMS maps are of reduced quality (category II, see rectangles). Whereas TTP and MTT quality is markedly reduced, TTD quality is good. The case was still considered to be interpretable with both DC and MS.
Quantitative Results
The results of quantitative measurements in all regions of interest are shown in Table 2.
Results of the quantitative analysis
In GM/WM regions of interest, we found good agreement of CBFDC and CBFMS as well as CBVDC and CBVMS. The SDs of CBFDC and CBVDC were markedly higher compared with CBFMS and CBVMS. Although method differences reached statistical significance (CBFDC versus CBFMS: P < .0001 [GM], P = .0074 [WM]; CBVDC versus CBVMS: P < .0041 [GM], P = .2143 [WM]), differences were not considered relevant in most cases: CBF and CBV differences were <2 SDs in 95% and 93%, respectively. Regarding the temporal parameters, we found good correlation between MTT and TTD (r = 0.82) as well as fair correlations between MTT and TTP (r = 0.59) and TTD and TTP (r = 0.56) (all P < .0001).
In suspected penumbra regions of interest, mean CBFDC was significantly lower than CBFMS (absolute, 29 versus 32 mL/100 g/min, P < .0001; relative, 0.48 versus 0.59, P < .0001). Method differences were >2 SDs in 17%. This corresponded to visual findings of ischemic lesions tending to be larger on CBFDC maps compared with CBFMS maps when using identical thresholds for DC and MS. Mean CBVDC was significantly higher than CBVMS (absolute, 2.9 versus 2.6 mL/100 g, P < .0001; relative, 0.92 versus 0.80, P = .0025). Method differences were >2 SDs in 26%. The SD of CBVDC was markedly higher compared with that of CBVMS. We found good correlation of MTT and TTD (r = 0.91), TTD and TTP (r = 0.89), as well as fair correlation of MTT and TTP (r = 0.76) (all P < .0001).
In suspected infarction core regions of interest, mean CBVDC was significantly higher than mean CBVMS (absolute, 1.1 versus 0.9 mL/100 g/min, P = .0011; relative, 0.37 versus 0.30, P = .0001). Method differences were >2 SDs in 12%. This corresponded to visual findings of ischemic lesions tending to be slightly smaller or similar on CBVDC maps compared with CBVMS maps when using identical thresholds for DC and MS. Mean CBFDC was slightly higher than mean CBFMS (absolute, 12 versus 9 mL/100 g/min, P = .0025; relative, 0.21 versus 0.18, P < .0001). Method differences were >2 SDs in 10%. We found fair correlation for MTT versus TTD (r = 0.65, P < .0001) and TTD versus TTP (r = 0.66, P < .0001), and weak correlation for MTT versus TTP (r = 0.30, P = .05).
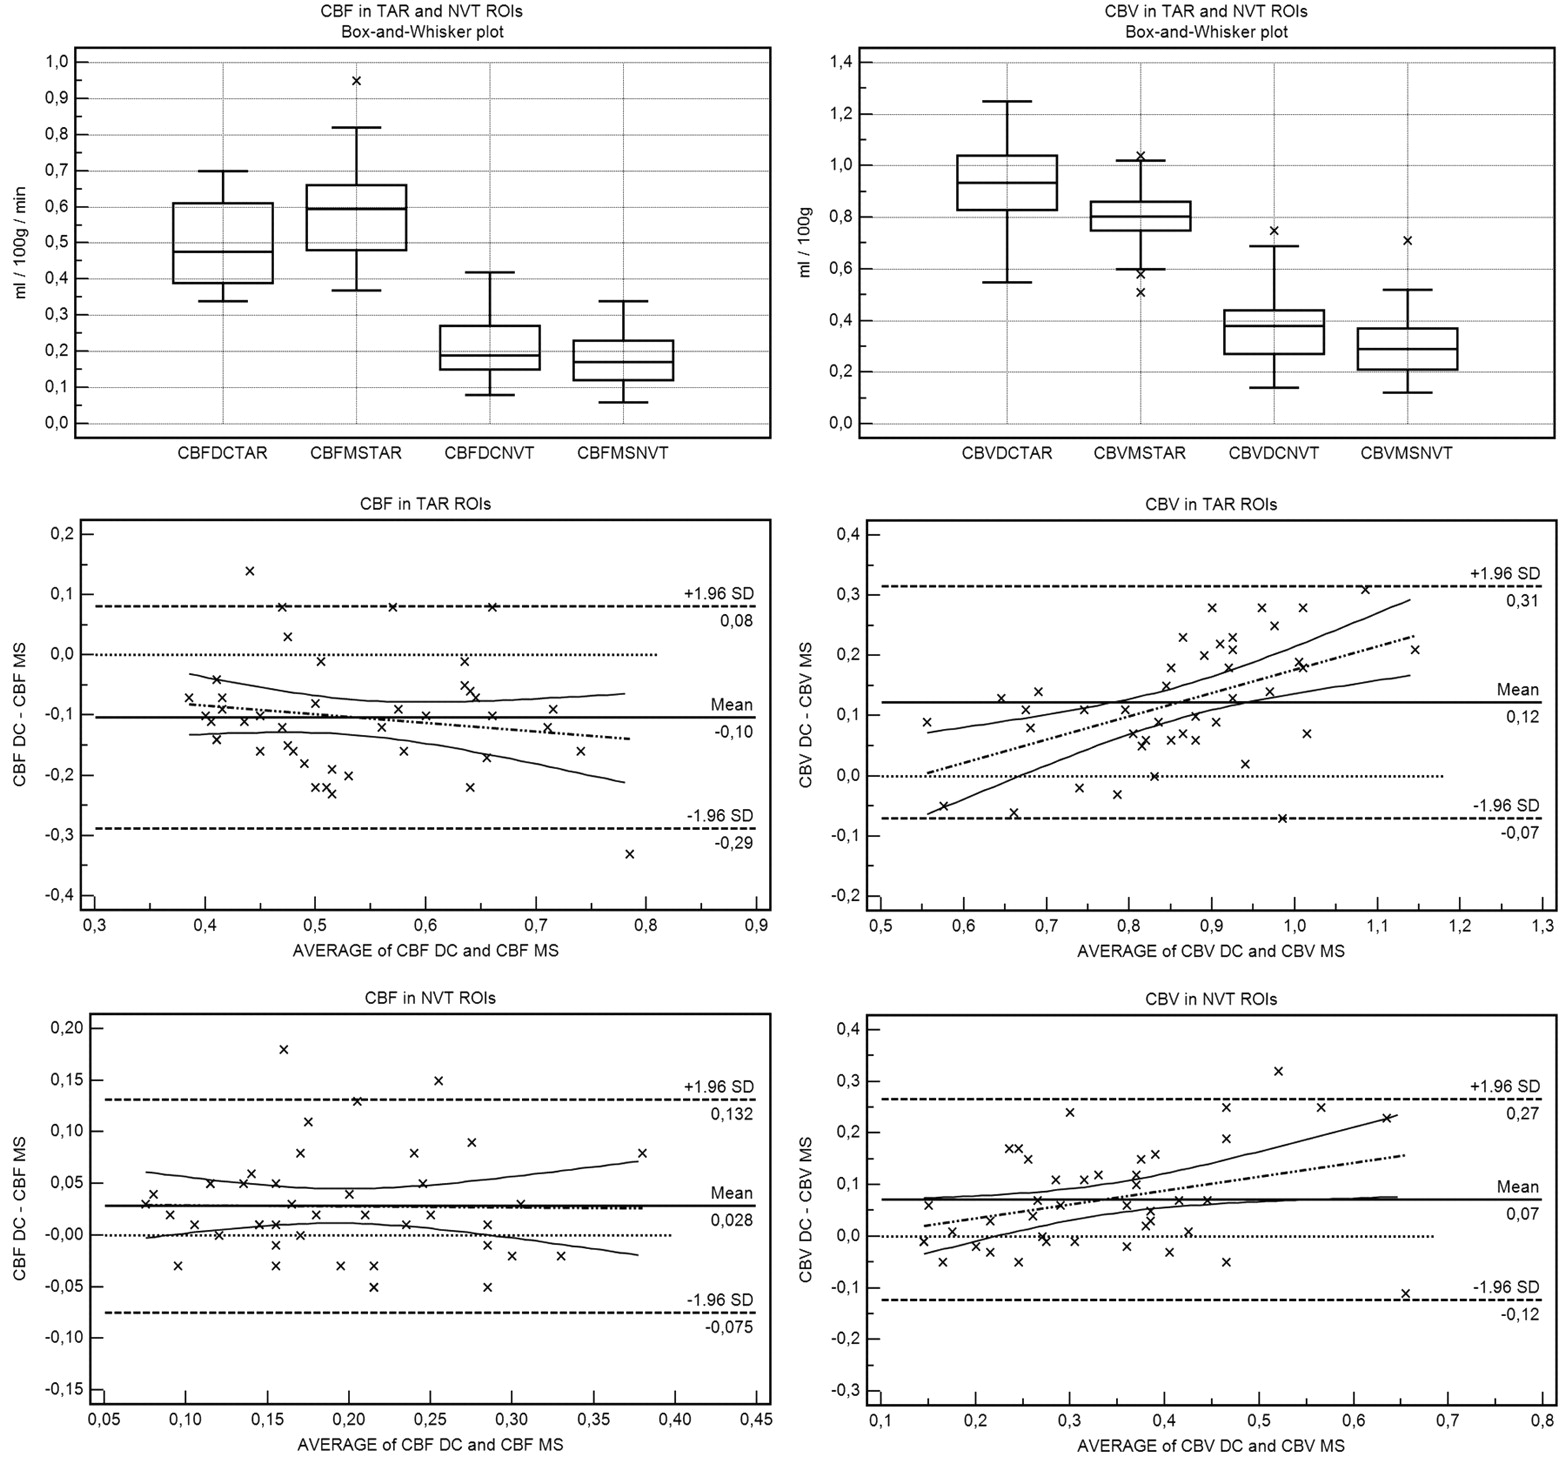
Statistical plots of CBF and CBV in suspected penumbra and suspected core regions of interest are shown in Fig 4.

Box-and-whisker and Bland-Altman plots demonstrate that rCBFDC is ≤rCBFMS in suspected penumbra (TAR) regions of interest and rCBVDC is ≥rCBVMS in suspected core (NVT) regions of interest. While there is no slope (no significant relationship between method difference and size of measurement) for CBF, for CBV, there is a positive slope in all regions of interest (proportional difference).
PCT Lesion Sizes
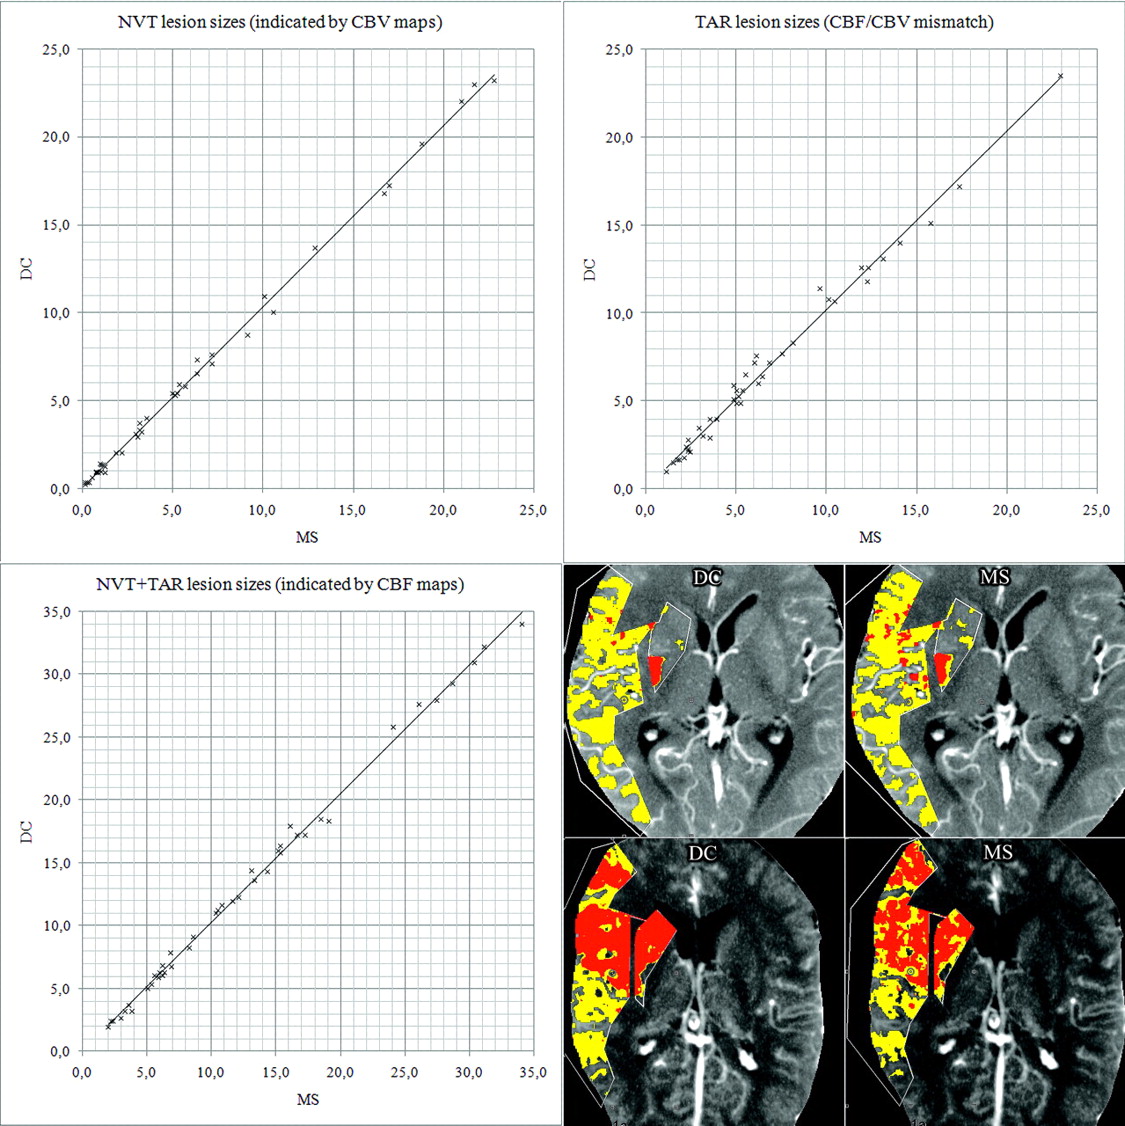
Using the CBF/CBV mismatch approach with adapted thresholds, we found excellent agreement of corresponding NVT, TAR, and NVT + TAR lesion sizes for DC versus MS. Correlation was r = 0.999 (P < .0001), r = 0.995 (P < .0001), and r = 0.998 (P < .0001), respectively. NVT/TAR ratio (CBV/CBF mismatch) was <.50 in 38% (16 cases) for both DC and MS. Detailed results are shown in Fig 5.

Comparison of PCT lesion sizes (DC versus MS). All units are in cubic centimeters. Scatterplots show excellent agreement: NVTDC = 1.03 × NVTMS (R2 = 0.998), TARDC = 1.02 × TARMS (R2 = 0.989), and (NVTDC + TARDC) = 1.03 × (NVTMS + TARMS) (R2 = 0.997). On the lower right, screenshots of 2 cases are shown as examples. Red indicates NVT; yellow, TAR.
Regarding PCT lesion scores (modified ASPECTS), statistical analysis revealed no significant difference for DC versus MS. PCT lesion scores were almost identical for DC and MS. Correlation was r = 0.998 (P < .0001) and r = 0.997 (P < .0001) for NVT and NVT + TAR lesion scores, respectively. NVT and NVT + TAR lesion scores were >7 in 67% (28 cases) and 33% (14 cases), respectively, for both DC and MS. An overview of PCT lesion scores is given in Table 3.
Results of PCT lesion scoresa
Discussion
When one compares quantitative perfusion measurements, their accuracy is, in general, limited because PCT values are dependent on a number of factors such as tube settings (current, voltage, thickness, scanning time), contrast delivery (iodine concentration, flow, maximum bolus height, bolus width), and individual patient variables (bolus distribution depending on cardiac output, lung passage, carotid status, patient movement, partial volume effect); and as a result of these factors, PCT values are also dependent on different source data quality (SNR, voxel TAC, motion artifacts). Moreover, data postprocessing may be influenced by different software properties and settings (such as motion correction, reference vessel selection, tissue and vessel segmentation, filtering) and finally different PCT models/algorithms, as recently found by Kudo et al.12
Although it has been shown that PCT values in healthy tissue agree well with measurements by xenon-CT, single-photon emission CT, positron-emission tomography, and MR imaging,21–23 they are reliable/comparable only if source dataset quality is sufficient and postprocessing is done in a highly standardized way.24 This condition explains why relatively heterogeneous PCT values have been reported. Likewise, different thresholds for infarct core and penumbra definition (TAR/NVT differentiation) have been proposed. Although for some postprocessing algorithms TAR/NVT thresholds could be validated in smaller patient collectives,7–9 none of these has been validated in a large series of patients with a criterion standard as a reference.14 Thus, no universally accepted TAR/NVT thresholds exist to date.
This underlines the importance of comparing perfusion measurements from different algorithms in a highly standardized way, by using the same source datasets and processing settings to retrieve information on qualitative and quantitative comparability and ischemic lesion-size comparability. In our study, all processing variables such as AIF and venous vessel selection, vessel/tissue segmentation, and spatial filtering were identical for the 2 algorithms investigated. Thus, the net differences can mainly be attributed to the final calculation algorithm.
Qualitative Analysis
MTT was reported to be the most sensitive parameter for describing tissue at risk of infarction.9,19,21 Other temporal parameters such as TTP have been discussed less frequently in the literature but have also proved highly sensitive25–27 and similar to DC-derived parameters in terms of positive predictive value.11,12 Our results indicate that TTP and TTD, the latter of which has recently been introduced in commercial postprocessing software, are well-suited to delineating the overall extent of the ischemic lesion with high image quality. TTD appears to condense both pathologic changes in contrast bolus delay—time from arterial enhancement to tissue enhancement and tissue transit time—in 1 high-contrast image.
The high quality of CBF and CBV maps found in our study has been reported in numerous publications;2,3,28,30 our findings additionally show that CBF and CBV maps of DC and MS are very comparable in terms of quality and diagnostic value. In cases with poor source dataset quality, CBFDC and CBVDC maps were slightly superior to CBFMS and CBVMS maps. However, overall method differences were significant neither for CBFDC versus CBFMS nor for CBVDC versus CBVMS.
Quantitative Analysis
In GM/WM, mean MTT values of 3.4–4.9 seconds (GM) and 4.0–5.7 seconds (WM) have been described,17–19,21 as well as TTP values of ∼4–8 seconds.7,29 To our knowledge, TD values have not been reported yet. In our study, mean MTT, TTD, and TTP values were 3.3, 3.7, and 8.1 seconds (GM) and 4.0, 4.8, and 9.3 seconds (WM), respectively. All temporal parameters showed high SDs, but this was expected because they are known to be rather variable (for they are influenced by individual factors affecting bolus distribution). Physiologic CBF values of 50–60 mL/100 g/min (GM) and 20–30 mL/100 g/min (WM) as well as CBV values of ∼3.5 mL/100 g (GM) and ∼2.0 mL/100 g (WM) have been reported.9,15,17,19,21,30 The average CBFDC/CBFMS as well as CBVDC/CBVMS values found in our study are in good agreement with these reported values.
In suspected penumbra/core regions, temporal parameters are markedly prolonged compared with healthy tissue: The average rMTT in our study was ∼220% in ischemic tissue (absolute MTT in suspected penumbra and suspected core was 7.7 seconds and 6.9 seconds, respectively). This compares well with an rMTT of 145% (or an absolute MTT of 5–7 seconds) described in literature for defining penumbra extent.9,17,18 The average rTTD in our study was ∼300% in ischemic tissue (absolute TTD in suspected penumbra and suspected core was 10.6 seconds and 13.0 seconds, respectively). rTTP was ∼170% (absolute TTP in suspected penumbra and suspected core was 13.5 seconds and 14.2 seconds, respectively). This is a TTP delay of ∼4–6 seconds, which is in perfect accordance with the average TTP delay reported in the literature.7,11,26,31 That rMTT in our study tended to be somewhat higher than in other studies may be explained by the fact that we measured mean region-of-interest values, not lower threshold values, and also by high temporal parameter variability.
An important finding of our study was that in penumbral regions, CBFDC was lower than CBFMS. This is probably because the no-venous-outflow assumption of the MS model is violated earlier for nonischemic tissue with shorter transit times than for ischemic tissue. Our quantitative results and visual findings on color maps indicate that identical thresholds are not applicable for DC and MS; rather, adapted thresholds should be used for either model. When compared with DC, MS tends to overestimate CBF in penumbral regions; therefore, the absolute CBFDC threshold for TAR definition must be lower than the CBFMS threshold. These findings are in agreement with rCBFDC ≤ .55–.65 (absolute, ≤25 mL/100 g/min)4,8,17,18 and rCBFMS ≤ ∼.60 (absolute, ≤35 mL/100 g/min)7,15,16 for penumbra (TAR) definition in the literature.
Another important finding was that the average value as well as the SD of CBVDC was markedly higher than those of CBVMS in suspected penumbra regions of interest. This can be explained by the fact that CBVMS is flow-weighted and does not fully account for possible vasodilation in penumbral areas.23 However, because autoregulation is not maintained in nonviable tissue, CBVDC was only slightly higher than CBVMS in suspected core regions of interest (relative, 0.37 versus 0.30 mL/100 g; absolute, 0.12 versus 0.9). Our quantitative results and visual findings on color maps indicate that the absolute CBVDC threshold for NVT definition must be slightly higher than or similar to the CBVMS threshold. Values for defining the infarction core (NVT) in the literature are rCBVDC ≤ ∼.60 (absolute, ∼1.0–2.0 mL/100 g)8,9,19 and rCBVMS ≤ ∼.40 (absolute, ∼1.2–1.6 mL/100 g).7,16 The rCBFDC and rCBFMS values of ∼.20 in suspected infarction core regions of interest found in our study are in perfect agreement with rCBF values of ∼.20 (absolute, ∼10–15 mL/100 g/min) reported.7,15,25
PCT Lesion Sizes
The central task of a modern stroke-imaging technique is to detect and delineate an ischemic lesion and to provide reliable information on its severity. In our study, corresponding region-of-interest–based measurements from DC and MS were within the same range, but our results suggest that identical CBF/CBV thresholds for TAR/NVT definition are not applicable for DC and MS. Nevertheless, corresponding NVT, TAR, and NVT + TAR lesion sizes for DC versus MS showed excellent agreement when using adapted CBF/CBV thresholds. Because both methods yielded essentially the same information in terms of tissue classification by using PCT lesion scores (modified ASPECTS), it can be concluded that DC and MS fulfilled this task equivalently in our study. No different therapy decisions would have been made when DC and MS were interchanged.
Limitations
A limitation of our study could be that the accuracy of lesion sizes indicated by PCT could not be verified by follow-up imaging. However, the objective of our study was not the verification of PCT lesions but rather a systematic analysis of qualitative and quantitative method comparability. Nevertheless, in comparing TAR/NVT lesion sizes delineated by DC and MS, we found excellent agreement and no clinically significant difference in terms of therapeutic decision making between both approaches. Another limitation of this study is that perfusion measurements and lesion sizes were retrieved from 1 axial section only. Furthermore, the inhomogeneity of source data (nonuniform protocols) can be regarded as a limitation, but this was intended to test different datasets with different image quality with both algorithms. Finally, our trial was conducted retrospectively on a limited number of cases. Therefore, larger randomized prospective trials should follow to further investigate advantages and disadvantages of both techniques, validate TAR/NVT threshold values, and examine the equivalence of DC and MS in terms of patient outcome.
Conclusions
By directly comparing DC and MS, we found that both approaches are—despite some model immanent advantages and disadvantages—very similar with regard to color map quality and quantitative values. For exact TAR/NVT differentiation, different CBF and CBV thresholds must be applied for DC and MS. Lesion sizes indicated by DC and MS showed excellent agreement when using adapted thresholds. In all cases, the same therapy decision would have been made.
Footnotes
-
Indicates article with supplemental on-line appendix.
References
- Received January 27, 2010.
- Accepted after revision April 5, 2010.
- Copyright © American Society of Neuroradiology
In this issue


Jump to section
Related Articles
Cited By...
- What is the impact of head movement on automated CT perfusion mismatch evaluation in acute ischemic stroke?
- Hemodynamic forces tune the arrest, adhesion and extravasation of circulating tumor cells
- Computed Tomographic Perfusion Predicts Poor Outcomes in a Randomized Trial of Endovascular Therapy
- The feasibility of low-concentration contrast and low tube voltage in computed tomography perfusion imaging: an animal study
- Whole-brain Volume Perfusion Computed Tomography: Acquisition Techniques and Radiation Dose
- Comparison of Perfusion CT Software to Predict the Final Infarct Volume After Thrombectomy
- Perfusion Deficits and Mismatch in Patients with Acute Lacunar Infarcts Studied with Whole-Brain CT Perfusion
- Vertebral Artery Hypoplasia: Frequency and Effect on Cerebellar Blood Flow Characteristics
- Prognostic Evaluation Based on Cortical Vein Score Difference in Stroke
- Comments on an Article by Kamalian et al
- CT Perfusion in Acute Ischemic Stroke: A Comparison of 2-Second and 1-Second Temporal Resolution