
Abstract
BACKGROUND AND PURPOSE: Does the K-means algorithm do a better job of differentiating benign and malignant neck pathologies compared to only mean ADC? The objective of our study was to analyze the differences between ADC partitions to evaluate whether the K-means technique can be of additional benefit to whole-lesion mean ADC alone in distinguishing benign and malignant neck pathologies.
MATERIAL AND METHODS: MR imaging studies of 10 benign and 10 malignant proved neck pathologies were postprocessed on a PC by using in-house software developed in Matlab. Two neuroradiologists manually contoured the lesions, with the ADC values within each lesion clustered into 2 (low, ADC-ADCL; high, ADC-ADCH) and 3 partitions (ADCL; intermediate, ADC-ADCI; ADCH) by using the K-means clustering algorithm. An unpaired 2-tailed Student t test was performed for all metrics to determine statistical differences in the means of the benign and malignant pathologies.
RESULTS: A statistically significant difference between the mean ADCL clusters in benign and malignant pathologies was seen in the 3-cluster models of both readers (P = .03 and .022, respectively) and the 2-cluster model of reader 2 (P = .04), with the other metrics (ADCH, ADCI; whole-lesion mean ADC) not revealing any significant differences. ROC curves demonstrated the quantitative differences in mean ADCH and ADCL in both the 2- and 3-cluster models to be predictive of malignancy (2 clusters: P = .008, area under curve = 0.850; 3 clusters: P = .01, area under curve = 0.825).
CONCLUSIONS: The K-means clustering algorithm that generates partitions of large datasets may provide a better characterization of neck pathologies and may be of additional benefit in distinguishing benign and malignant neck pathologies compared with whole-lesion mean ADC alone.
Abbreviations
- ADC
- apparent diffusion coefficient
- DWI
- diffusion-weighted imaging
- FA
- flip angle
- ROC
- receiver operator characteristic
- SCC
- squamous cell carcinoma
- SNUC
- sinonasal undifferentiated carcinoma
- VOI
- volume of interest
Imaging can play an important role in determining benignancy versus malignancy in neck pathologies due to the potential benefit of avoiding unnecessary biopsies. However, the overlap of imaging features of benignancy and malignancy in neck lesions on contrast-enhanced CT or conventional spin-echo MR imaging necessitates the search for advanced imaging techniques that can fill the void. One such advanced imaging technique is DWI, which has invoked significant interest in the past few years due to its potential in characterizing neck pathologies. It has been shown that ADC values obtained from DWI images may be helpful in distinguishing benign and malignant neck neoplasms (benign pathologies demonstrating higher mean ADC values compared with malignant lesions) with studies suggesting an ADC of 1.3 × 10⁻³ mm2/s as a possible threshold for distinguishing these entities.1–5 The reason for this difference in ADC can be attributed to the difference in cellularity between benign and malignant neck lesions: Benign lesions tend to be less cellular compared with malignant lesions, which demonstrate hypercellularity and hence a relative restriction of water molecular motion and, thereby, decreased ADC. However, this distinction may not always be reproducible by using whole-lesion mean ADC because benign lesions may be hypercellular (with decreased ADC) and malignant lesions can consist of necrotic areas (which can elevate the ADC).4
In an attempt to better differentiate benign and malignant neck pathologies by using DWI, we have used the K-means algorithm in this study to cluster the ADC values within benign and malignant lesions into different partitions. The K-means algorithm is a technique to cluster n objects, on the basis of attributes, into k partitions, k < n.6 Clustering is the classification of objects into different groups or, more precisely, the partitioning of a dataset into clusters (subsets) so that the data in each cluster (ideally) share some common trait—often proximity according to some defined distance measure. We hypothesized that a clustered analysis of the ADC within lesions into different partitions may be better at stratifying malignant from benign lesions than an analysis of whole-lesion mean ADC alone due to the inherent differences in the magnitude and/or proportion of low and high ADC voxels between the lesions. The objective of our study was to analyze the differences between these partitions to evaluate whether the K-means technique can be of additional benefit to whole-lesion mean ADC alone in distinguishing benign and malignant neck pathologies.
Materials and Methods
Patients
The study was approved by the institutional review board. The MR imaging studies of 10 benign and 10 malignant pathologies were selected in a consecutive fashion from >50 head and neck MR imaging scans obtained at our institution from December 2006 to December 2007. All 10 patients with malignant pathologies had tissue sampling and pathologic confirmation of disease. Eight of the 10 benign pathologies had tissue diagnosis and pathologic confirmation of benignancy. Two benign lesions (patients 5 and 9 in Table 1) did not have pathologic confirmation of disease, and the benignancy was presumed on the basis of the MR imaging features, stability with time, or both. MR imaging in patient 5 with the presumed trigeminal schwannoma demonstrated a T1-weighted hypointense, T2-weighted hyperintense, gadolinium-enhancing lesion within the trigeminal ganglion, which was stable for 4 years of follow-up. The presumed parotid pleomorphic adenoma in patient 9 was well circumscribed without adjacent-structure invasion or perineural spread and was stable for 6 years of follow-up.
ADC values obtained in 10 benign neck pathologies by readers 1 and 2
MR Imaging
All MR imaging was performed on a 3T system (Achieva 3T Quasar Dual; Philips Medical Systems Best, the Netherlands) by using a 16-channel head and neck coil from the skull base up to the thoracic inlet. DWI was performed by using a single-shot spin-echo echo-planar imaging sequence with the following parameters: axial plane with a 2454-ms TR, 45-ms TE, a 90° FA, 4-mm section thickness, FOV of 240 mm, and b-values of 0 and 800 s/mm2. Delineation of tumor from healthy tissue was aided by using fat-saturated contrast-enhanced T1-weighted images acquired with the following sequence parameters: axial plane with a 575-ms TR, 10-ms TE, 90° FA, 4-mm section thickness, and FOV of 220 mm.
Image Processing and Analysis
MR images were transferred to a PC for further processing and analysis, which was performed by using in-house software developed in Matlab ((MathWorks, Natick, Massachusetts). Lesions were manually contoured by 2 neuroradiologists (readers 1 and 2) on the low b-images, high-b images, or ADC maps, depending on which provided the best contrast, to generate a VOI for each lesion. Clinical or pathologic diagnosis was known to reader 1 (and was blinded to reader 2) in all cases before image analysis. Because this study was not intended to prospectively differentiate benign and malignant neck pathologies by using DWI, we thought that the lack of blinding to the final diagnosis would not introduce any bias. However, we also wanted to evaluate whether the results would be different between the blinded and nonblinded measurements.
The ADC values within each lesion were clustered into both 2 and 3 partitions by using the K-means clustering algorithm.6,7 The K-means algorithm is a technique to cluster n objects on the basis of attributes into k partitions, k < n. It is an attempt to find the centers of natural clusters in the data. It assumes that the object attributes form a vector space. The objective it tries to achieve is to minimize total intracluster variance. The algorithm steps are the following6–8:
-
Choose the number of clusters, k.
-
Randomly generate k clusters and determine the cluster centers or directly generate k random points as cluster centers. The K-means clustering algorithm, included in the Statistics Toolbox from Matlab, randomly generates cluster centers.
-
Assign each point to the nearest cluster center.
-
Recompute the new cluster centers.
-
Repeat the 2 previous steps until some convergence criterion is met.
The main advantages of this algorithm are its simplicity and speed, which allow it to run on large datasets. A drawback of the K-means algorithm is that the number of clusters, k, is an input parameter. An inappropriate choice of k may yield poor results.8 The number of partitions, k, is driven by the operator; and in this study, we chose k values of 2 and 3 to cluster the ADC values into low and high as well as low, intermediate, and high values, respectively, within each lesion. The K-means algorithm was applied onto the data obtained from each individual VOI within the individual ADC maps. When 2 clusters (k2) were chosen, the low ADC cluster (ADCL[k2]) was color-coded blue and the high ADC cluster (ADCH[k2]), green. When 3 clusters (k3) were chosen, the low ADC cluster (ADCL[k3]) was color-coded blue, the intermediate cluster (ADCI[k3]) was coded green, and the high ADC cluster (ADCH[k3]) was coded red. On the basis of observable trends in the individual metrics for benign and malignant lesions, the difference in ADCH and ADCL for each cluster analysis was also analyzed as a predictive marker of pathology. In addition, the mean ADC of the whole tumor, which constitutes a cluster of 1, was analyzed in this study.
Statistical Analysis
An unpaired 2-tailed Student t test was performed for all metrics to determine statistical differences in the means between the benign and malignant pathology cohorts. Variability in the metrics between readers was assessed by using a paired 2-tailed Student t test. Due to the small sample size, nonparametric tests, including the Wilcoxon signed rank test for comparing observations of readers 1 and 2 and the Mann-Whitney U test for comparing the ADC clusters between the benign and malignant pathologies, were also performed.
As an additional aim, ROC curves were constructed by using the metrics obtained from the observations of readers 1 and 2 in an effort to study which metric could be useful for predicting that the lesion was malignant.
Results
Patient Characteristics
Tables 1 and 2 illustrate the diagnosis and mean ADC values in both the benign and malignant categories obtained by readers 1 and 2. There were 9 patients with 10 benign pathologies (mean age, 48.8 ± 18.6 years) and 10 patients with 10 malignant pathologies (mean age, 52.8 ± 18.1 years).
ADC values obtained in 10 malignant neck pathologies by readers 1 and 2
K-Means Analysis
The 1-cluster whole-lesion mean ADC was as follows:
-
Reader 1: benign, 147 ± 43 (× 10−5) mm2/s; malignant, 121 ± 31 (× 10−5) mm2/s, no statistically significant difference between the means (P = .14).
-
Reader 2: benign, 146 ± 42 (× 10−5) mm2/s; malignant, 114 ± 27 (× 10−5) mm2/s, no statistically significant difference between the means (P = .063).
-
A paired t test between the measurements obtained by readers 1 and 2 for all lesions did not reveal any statistically significant difference (P = .141).
The 2-cluster model (high and low ADC clusters) was as follows:
-
Reader 1: no statistically significant difference between the mean low and high ADC values in benign and malignant pathologies (P = .06 and 0.76, respectively).
-
Reader 2: no statistically significant difference (P = .465) between the mean high ADC values in benign and malignant pathologies but a significant difference between low ADC values (P = .04).
The 3-cluster model (high, intermediate, and low ADC clusters) was as follows:
-
Reader 1: statistically significant difference between the mean low ADC values in benign and malignant pathologies (P = .03) but not between the means of the intermediate (P = .08) and high ADC (P = .72) clusters.
-
Reader 2: statistically significant difference between the mean low ADC values in benign and malignant pathologies (P = .022) but not between the means of the intermediate (P = .082) and high ADC (P = .55) clusters.
Figures 1 and 2 demonstrate the overlay of ADC and the color-coded cluster analysis by using the 2- and 3-cluster models in individual patients with benign and malignant pathologies, respectively. The difference in means between the various clusters obtained by reader 1 is shown in Fig 3, which illustrates the bar graph of mean ADC values within the whole lesion; ADC values within the low and high clusters (2-cluster model); and low, intermediate, and high clusters (3-cluster model) for both benign and malignant pathologies. As demonstrated in the figure, the best separation of means was obtained between the low ADC clusters of benign and malignant pathologies in both the 2- and 3-cluster models. Similar results were obtained from the observations of reader 2 (figure not shown).

Images from a patient with a benign lesion (parotid pleomorphic adenoma) demonstrate overlay of ADC (A) and cluster maps (B and D) on low b-value images and histograms assuming 2 (C) and 3 (E) clusters. In the 2-cluster model, low ADC is color-coded blue; and high ADC, green. In the 3-cluster model, low ADC is color-coded blue; intermediate ADC, green; and high ADC, red.

Images from a patient with a malignant lesion (sinonasal undifferentiated carcinoma) demonstrate overlay of ADC (A) and cluster maps (B and D) on low b-value images and histograms assuming 2 (C) and 3 (E) clusters. In the 2-cluster model, low ADC is color-coded blue; and high ADC, green. In the 3-cluster model, low ADC is color-coded blue; intermediate ADC, green; and high ADC, red.

Bar graphs of whole-tumor ADC, ADCH(k2), ADCL(k2), ADCH(k3), ADCI(k3), and ADCL(k3) obtained from the observations of reader 1 for benign and malignant pathologies are depicted. Significant difference in means are only identified between the ADCL(k3) in benign and malignant lesions (P = .03). For reader 2, significant differences are identified in both the ADCL(k2) and ADCL(k3) clusters (P = .04 and 0.022, respectively) (k2–2-cluster model; k3–3-cluster model).
ROC Curves
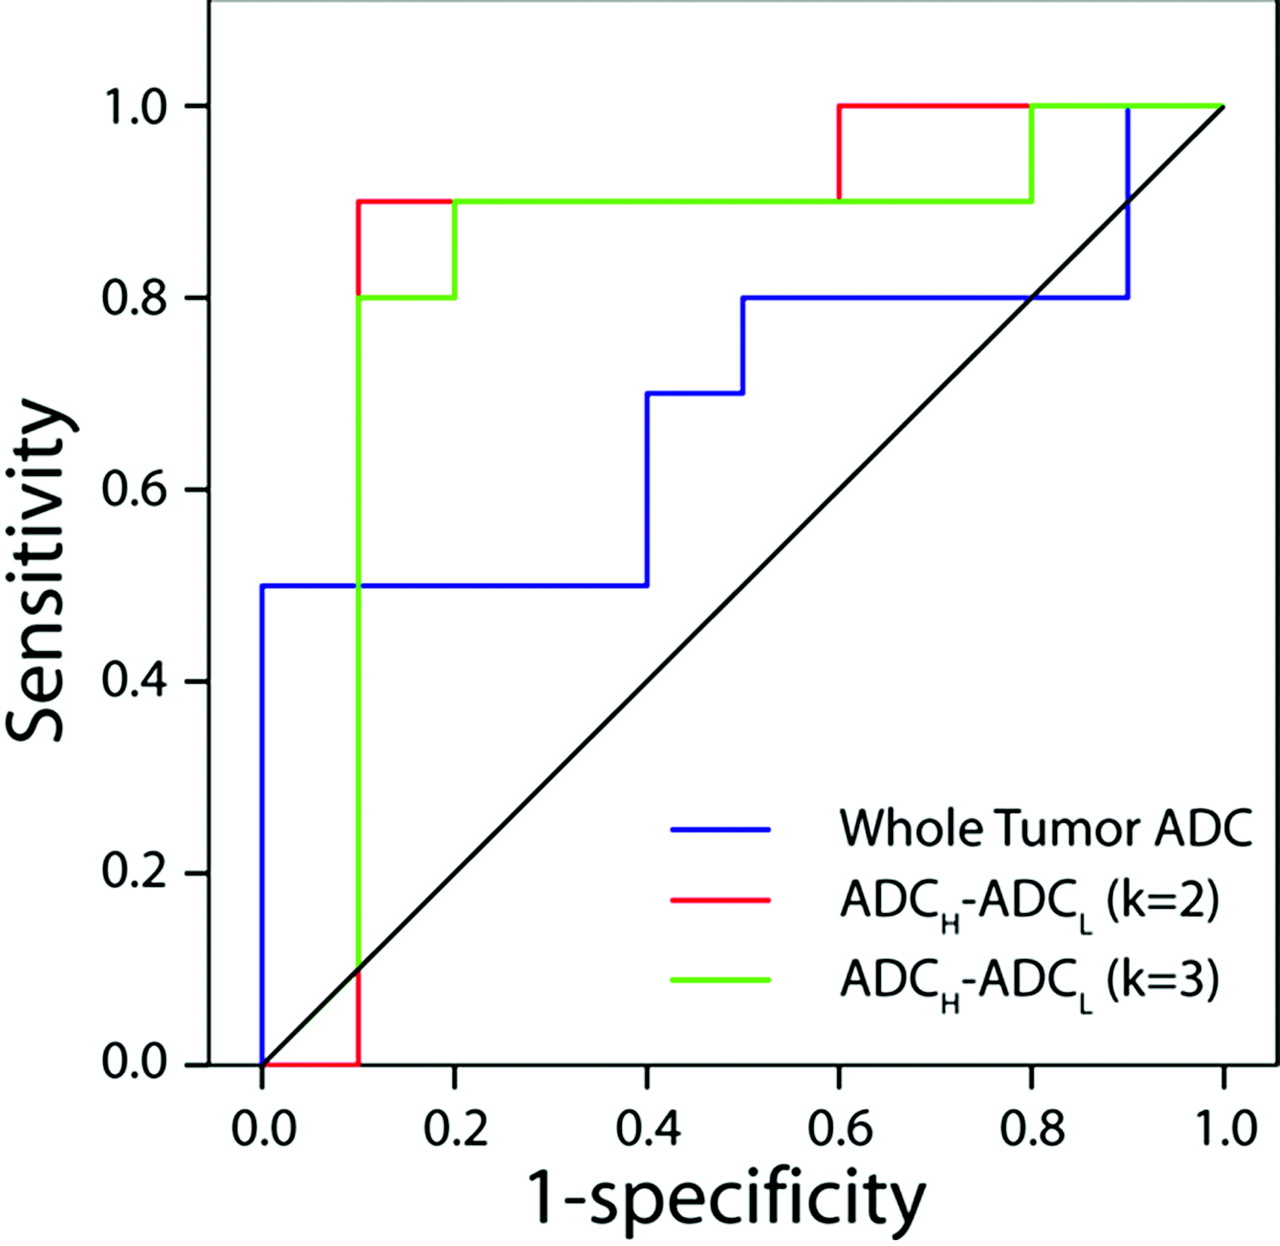
Figure 4 illustrates the ROC curves for predicting malignancy constructed from the observations of reader 1. There was no predictive value of whole-lesion mean ADC (P = .2, area under curve = 0.310) or individual metrics (data not shown). However, the quantitative difference in means of high ADC and low ADC clusters in both the 2- and 3-cluster models was found to be predictive of malignancy (2 clusters: P = .008, area under curve = 0.850; 3 clusters: P = .01, area under curve = 0.825) with cutoffs of 48 and 81, respectively. Two patients were misclassified by using the k2 cutoff; and 3, by using the k3 cutoff. ROC analysis of the results of reader 2 was similar to that of reader 1, with the difference in the high and low ADCs for both clustering analyses providing the most predictive value. The k2 cutoff was 48 (3 misclassified), and the k3 cutoff was 76 (5 misclassified).

ROC curves for whole-lesion mean ADC (blue line) and difference in mean ADCH and ADCL as determined from K-means analysis assuming a cluster number of 2 (red line) and 3 (green line). There was no predictive value of whole-lesion mean ADC for malignancy (P = .2, area under curve = 0.310). However, the quantitative difference in the means of high ADC and low ADC clusters in both the 2- and 3-cluster models was found to be predictive of malignancy (2 clusters: P = .008, area under curve = 0.850; 3 clusters: P = .01, area under curve = 0.825).
Nonparametric Tests
The Wilcoxon signed rank test for comparing the observations of readers 1 and 2 and the Mann-Whitney U test for comparing the ADC clusters between the benign and malignant pathologies demonstrated results similar to those of the t tests (individual results not shown).
Volume Fractions
There were no significant differences seen in the cluster volume fractions between the benign and malignant pathologies in both the 2- and 3-cluster models.
Discussion
CT and MR imaging are used in day-to-day practice to evaluate neck pathologies, particularly with an emphasis on differentiating benign-versus-malignant etiologies. If imaging can reliably establish the benignancy of a lesion, it would be helpful in reducing the morbidity of unnecessary biopsies. However, in many instances, there can be overlap of imaging features of benignancy and malignancy in a lesion, resulting in a diagnostic dilemma. In these patients, parameters (eg, ADC and blood volume) derived from advanced imaging techniques (like DWI and perfusion imaging) can be of additional benefit in differentiating pathologies. In multiple studies, it has been shown that benign neck pathologies tend to have a higher mean lesion ADC compared with malignant neck pathologies.1,2,4,5,9,10 Also, ADC has been shown to be different between malignant pathologies like squamous cell carcinoma and lymphoma, very likely due to differences in cellularity between malignant neoplasms of different pathologic types.11
The problem with using mean ADC as the distinguishing factor between benign and malignant pathologies is due to the heterogeneity of lesions: Some benign pathologies may be hypercellular (causing decreased ADC), and malignant pathologies can develop necrotic areas (with increased ADC), thus causing overlap in mean ADC values between these categories.
We based our study on the hypothesis that it may be possible to separate the ADC within a lesion into multiple clusters—in this case, low and high (2-cluster model); or low, intermediate, and high (3-cluster model)—and that there would be differences in ADC values generated from the individual clusters between the benign and malignant pathologies. Differences in ADC values observed between benign and malignant tumors could be attributed to the differences in magnitude and/or proportion of the voxels with low and high ADC values. Our results demonstrate that the low ADC cluster is significantly different between benign and malignant neck pathologies in the 3-cluster models for both readers 1 and 2 (P = .030 and 0.022, respectively). In the 2-cluster model, the differences in the low ADC cluster between benign and malignant pathologies achieved significance (P = .04) for reader 2. There was no significant difference in intermediate or high ADC value clusters. There was also no significant difference in the mean ADC values obtained by the 2 readers, suggesting that the measurements were internally consistent.
Although this study was performed on a small number of patients, these results suggest that the differences in ADC values between benign and malignant neck pathologies may not be truly represented by measurement of whole-lesion mean value alone (no significant difference in whole-tumor mean ADC). By dividing a tumor or lesion into multiple clusters, we can better separate out the heterogeneous components; and the true difference in ADC values between benign and malignant lesions may thus be due to the following: malignant lesions having a greater proportion (or volume) of low ADC voxels, voxels that have inherently lower ADC than the voxels having the lowest ADC in benign tumors, or both. It would be of interest to evaluate whether this low ADC cluster has any threshold below or above which there is accurate prediction of malignancy versus benignancy. For example, a tumor with 50% of its voxels below an ADC of 100 × 10−5 mm2/s may have a higher probability of being malignant compared with another lesion with 20% of its voxels below the same threshold. In our study, we did not see any significant differences in the quantitative cluster-volume fractions (eg, the low ADC cluster volume in the benign cohort was not different from the low ADC cluster volume in the malignant cohort) between the benign and malignant pathologies in both the 2- and 3-cluster models; however, due to the small sample size, we did not draw any conclusions from these results. Another potential area of interest in which the K-means technique can be helpful is the differentiation of posttherapeutic change from recurrent malignancy in the head and neck; large sample sizes may be required for this differentiation. Also, while the number of clusters for achieving adequate separation of coefficients may be different on a case-by-case basis, in our study, we achieved similar results with 2 and 3 clusters, either of which we believe could be the most practical method of clustering the data. We think that the ease of use and the practicality of the clustering algorithm may not be optimum when the number of clusters exceeds 3.
The limitations of the study include the small sample size and the inherent subjectivity introduced when choosing the number of clusters in the model. Also, while the ROC results looked promising (with quantitative differences in high and low ADC values within the clusters being predictive of malignancy), there were misclassifications by using the cutoff generated in both the 2- and 3-cluster models, implying that more work needs to be done to establish its utility in individual cases.
In conclusion, the K-means clustering technique is a simple quick algorithm that can be applied to large datasets to separate them into different partitions; analysis of these partitions may provide a better characterization of neck pathologies and may be of additional benefit in distinguishing benign and malignant neck pathologies compared with whole lesion mean ADC alone.
Footnotes
-
Indicates Editor's Choices selection
-

-
This work was funded in part by National Institutes of Health grants P50CA093990 and P01CA085878.

Indicates open access to non-subscribers at www.ajnr.org
References
- Received April 22, 2009.
- Accepted after revision August 15, 2009.
- Copyright © American Society of Neuroradiology
In this issue


Jump to section
Related Articles
Cited By...
- No citing articles found.