
Abstract
BACKGROUND AND PURPOSE: Differentiating tumor growth from posttreatment radiation effect (PTRE) remains a common problem in neuro-oncology practice. To our knowledge, useful threshold relative cerebral blood volume (rCBV) values that accurately distinguish the 2 entities do not exist. Our prospective study uses image-guided neuronavigation during surgical resection of MR imaging lesions to correlate directly specimen histopathology with localized dynamic susceptibility-weighted contrast-enhanced perfusion MR imaging (DSC) measurements and to establish accurate rCBV threshold values, which differentiate PTRE from tumor recurrence.
MATERIALS AND METHODS: Preoperative 3T gradient-echo DSC and contrast-enhanced stereotactic T1-weighted images were obtained in patients with high-grade glioma (HGG) previously treated with multimodality therapy. Intraoperative neuronavigation documented the stereotactic location of multiple tissue specimens taken randomly from the periphery of enhancing MR imaging lesions. Coregistration of DSC and stereotactic images enabled calculation of localized rCBV within the previously recorded specimen locations. All tissue specimens were histopathologically categorized as tumor or PTRE and were correlated with corresponding rCBV values. All rCBV values were T1-weighted leakage-corrected with preload contrast-bolus administration and T2/T2*-weighted leakage-corrected with baseline subtraction integration.
RESULTS: Forty tissue specimens were collected from 13 subjects. The PTRE group (n = 16) rCBV values ranged from 0.21 to 0.71, tumor (n = 24) values ranged from 0.55 to 4.64, and 8.3% of tumor rCBV values fell within the PTRE group range. A threshold value of 0.71 optimized differentiation of the histopathologic groups with a sensitivity of 91.7% and a specificity of 100%.
CONCLUSIONS: rCBV measurements obtained by using DSC and the protocol we have described can differentiate HGG recurrence from PTRE with a high degree of accuracy.
High-grade glioma (HGG) treatment often requires combined surgery, chemo-, and radiation therapy (RT), after which patients must be closely monitored for tumor recurrence and posttreatment radiation effect (PTRE). Conventional MR imaging is currently best at detecting early treatment-bed changes, though accurate diagnosis is challenging because tumor growth, PTRE, and admixed lesions can all have identical MR imaging appearances.1,2 Microscopic tissue analysis distinguishes these entities and can document intralesion heterogeneity by resolving distinct subregions of tumor from pure PTRE within different locations of the same lesion. The implications of the 2 patterns are critical. Whereas a true recurrence indicates treatment failure and a need to change to a different therapy, PTRE reflects the ongoing success of the current treatment. Thus, MR imaging lesions composed of predominantly tumor have different treatment options compared with predominant PTRE. Although current protocol requires surgical biopsy for diagnosis, this step has disadvantages that include operative risks, patient morbidity, and increased health care costs. The accuracy of microscopic analysis is also dependent on representative sampling of the tissue in question and, therefore, is subject to significant error. These issues could be avoided if advanced MR imaging techniques offered a noninvasive alternative for accurate diagnosis.
Dynamic susceptibility-weighted contrast-enhanced perfusion MR imaging (DSC) estimates tissue microvascular density (MVD) by measuring relative cerebral blood volume (rCBV)3,4 and has the potential to differentiate tumor growth and PTRE accurately and noninvasively. RT typically induces endothelial cell damage and small-vessel injury,5–7 decreasing capillary perfusion and MVD. In contrast, tumor recurrence promotes angiogenesis and microvascular proliferation, helping to sustain tumor growth.8–11 DSC thus offers a biomarker that potentially correlates with histopathology and provides valuable diagnostic information.12–14
We hypothesized that clinically useful threshold rCBV values, which accurately distinguish PTRE and tumor growth, could be developed by directly correlating localized rCBV values with spatially accurate histopathology in the posttreatment setting. We implemented a study design that uses neuronavigation during surgical resection of contrast-enhancing MR imaging lesions to correlate tissue-specimen histopathology directly with DSC measurements in patients with HGG previously treated with multimodality therapy. Our goal in this prospective study was to establish an accurate threshold rCBV value to differentiate clinically and noninvasively areas of glioma recurrence from PTRE.
Materials and Methods
Subject Recruitment
We recruited previously treated (surgery, RT, and chemotherapy) WHO grade III and IV patients with primary HGG undergoing preoperative imaging for surgical re-resection of newly developed contrast-enhancing lesions identified on surveillance MR imaging. The estimated glomerular filtration rate (eGFR) was calculated from serum creatinine levels, patient demographics, and age. Patients with eGFR < 60 mg/min/1.72 m2 were excluded. We documented each subject's history of present or previous steroid therapy, previous surgical resection, timing and dose of RT, and adjuvant chemotherapy. The institutional review board approved our study, and written and informed consent was obtained from each subject.
Preoperative Imaging
DSC Protocol.
All patients were scanned on a 3T MR imaging magnet (Signa HDx; GE Healthcare, Milwaukee, Wis), following placement of an intravenous catheter in the antecubital fossa or forearm. Preload contrast was administered before the DSC acquisition to correct for T1-weighted leakage effects that might underestimate rCBV measurement.15–17 We used a stepwise dosing protocol to optimize T1-weighted leakage correction and minimize patient contrast load.18 The data presented in this study were obtained by using a protocol by which each subject received a total of 3 intravenous injections of gadolinium-diethylene-triamine pentaacetate-bis (methylamide) (Gd-DTPA-BMA) (Gadodiamide, Omniscan; Amersham Health, Princeton, NJ). Two preloading dose injections (each 0.05-mmol/kg bolus at 3–5 mL/s) were administered at 6 minutes and 3 minutes, respectively, prior to the DSC acquisition. The third injection (0.05-mmol/kg bolus at 3–5 mL/s) was performed during the DSC acquisition, with injection starting at the tenth time point in the image series. The DSC sequence parameters were the following: gradient-echo echo-planar imaging (EPI) with TR/TE/flip angle, 2000 ms/20 ms/60°; FOV, 24 × 24 cm; matrix, 128 × 96; 5-mm section; no intersection gap. These parameters yielded an in-plane spatial resolution of 1.8 × 2.5 mm and voxel volumes of 0.02 cm3. Each DSC acquisition lasted 2 minutes. The final Gd-DTPA dose was 0.15 mmol/kg body weight.
Stereotactic Anatomic Dataset.
We obtained 3T T1-weighted spoiled gradient recalled-echo inversion-recovery prepped (SPGR-IR prepped) stereotactic MR imaging datasets (TI/TR/TE, 300/6.8/2.8 ms; matrix, 320 × 224; FOV, 26 cm; section thickness, 2 mm) immediately before and following the DSC protocol for purposes of neuronavigation during surgical resection and tissue-specimen collection. All imaging was performed within 1 day of surgery.
Intraoperative Tissue-Specimen Collection
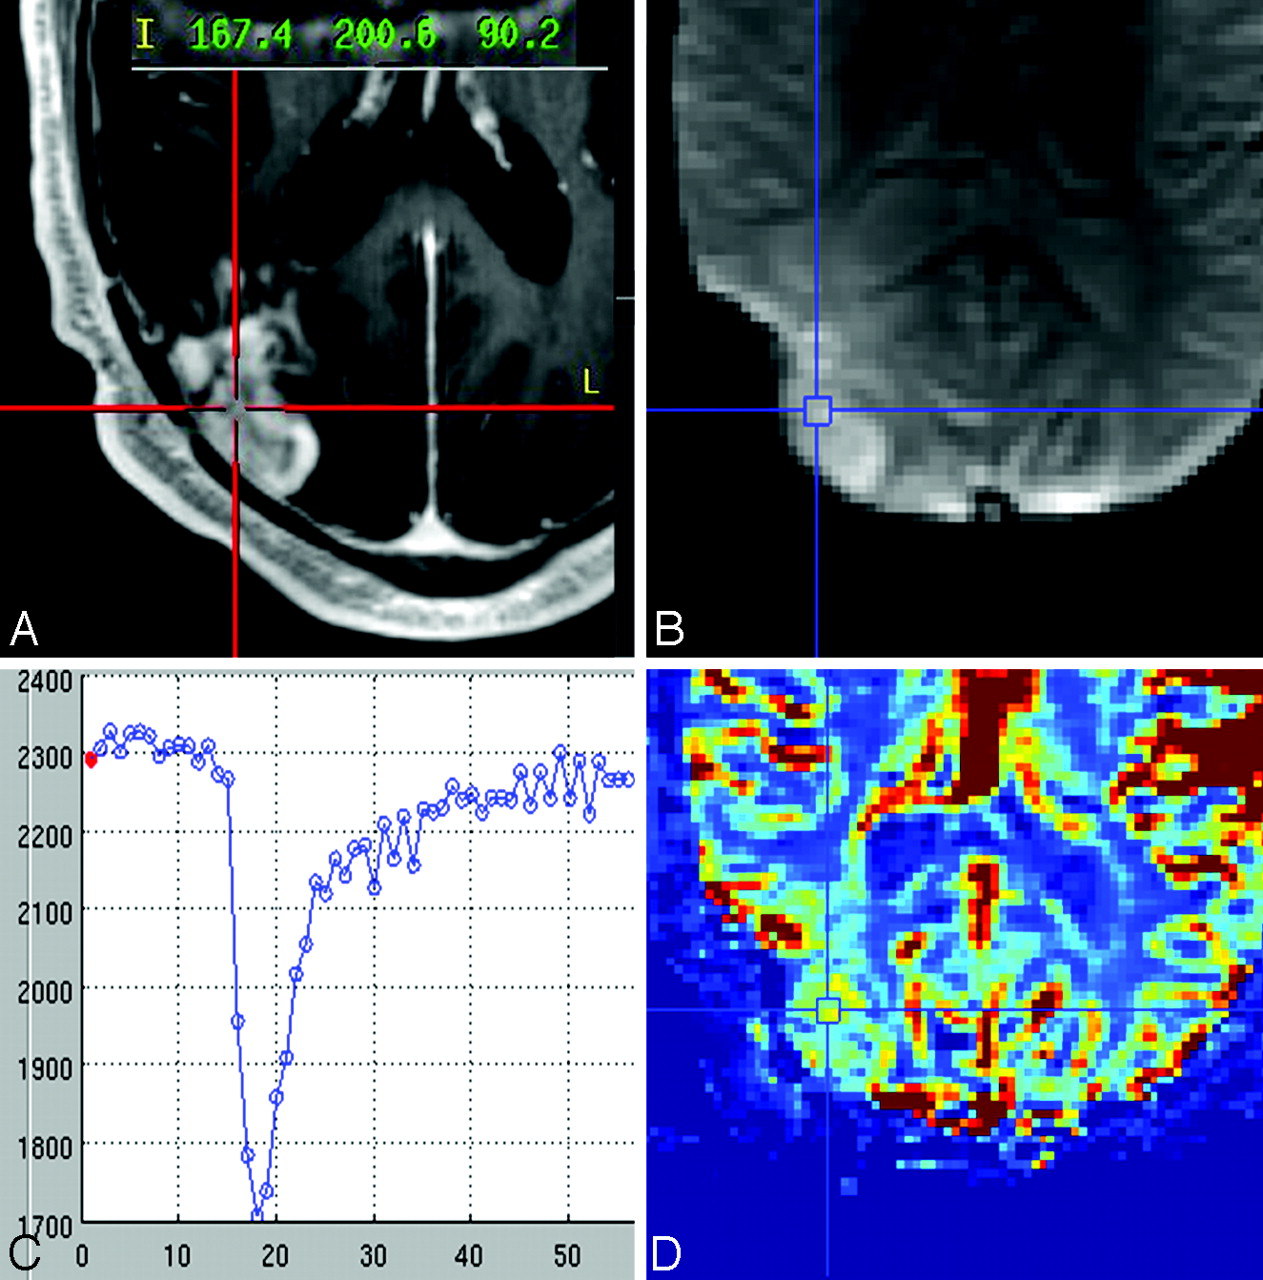
A neurosurgeon (K.A.S., P.N.) collected an average of 3 tissue specimens from each subject during surgical resection and created the smallest possible diameter craniotomy to minimize brain shift. The neurosurgeon took specimens randomly from different locations within the enhancing lesion periphery, avoiding central necrotic regions. All stereotactic imaging locations were visually validated with corresponding intracranial neuroanatomic landmarks (ie, adjacent vascular structures, ventricle margins) by the neurosurgeon. Screen-capture images were recorded to document specimen stereotactic location for coregistration with the DSC dataset (Figs 1 and 2). For most patients, a neuroradiologist (L.S.H.) was present at surgery, and when necessary, the tissue-sample location was agreed upon by consensus between the neuroradiologist and the neurosurgeon, and neither had knowledge of DSC measurements at the time of tissue collection.

A, Representative case of a histologically diagnosed tumor sample showing the neuronavigational screen-capture image with documentation of the surgical tissue specimen location (red target lines) and system coordinate points with left-anterior-superior reference origin. B−D, Image B shows the coregistered DSC source image with placement of a region of interest (blue target lines) at the specimen location with corresponding signal-intensity time course (C) and color rCBV map (D).

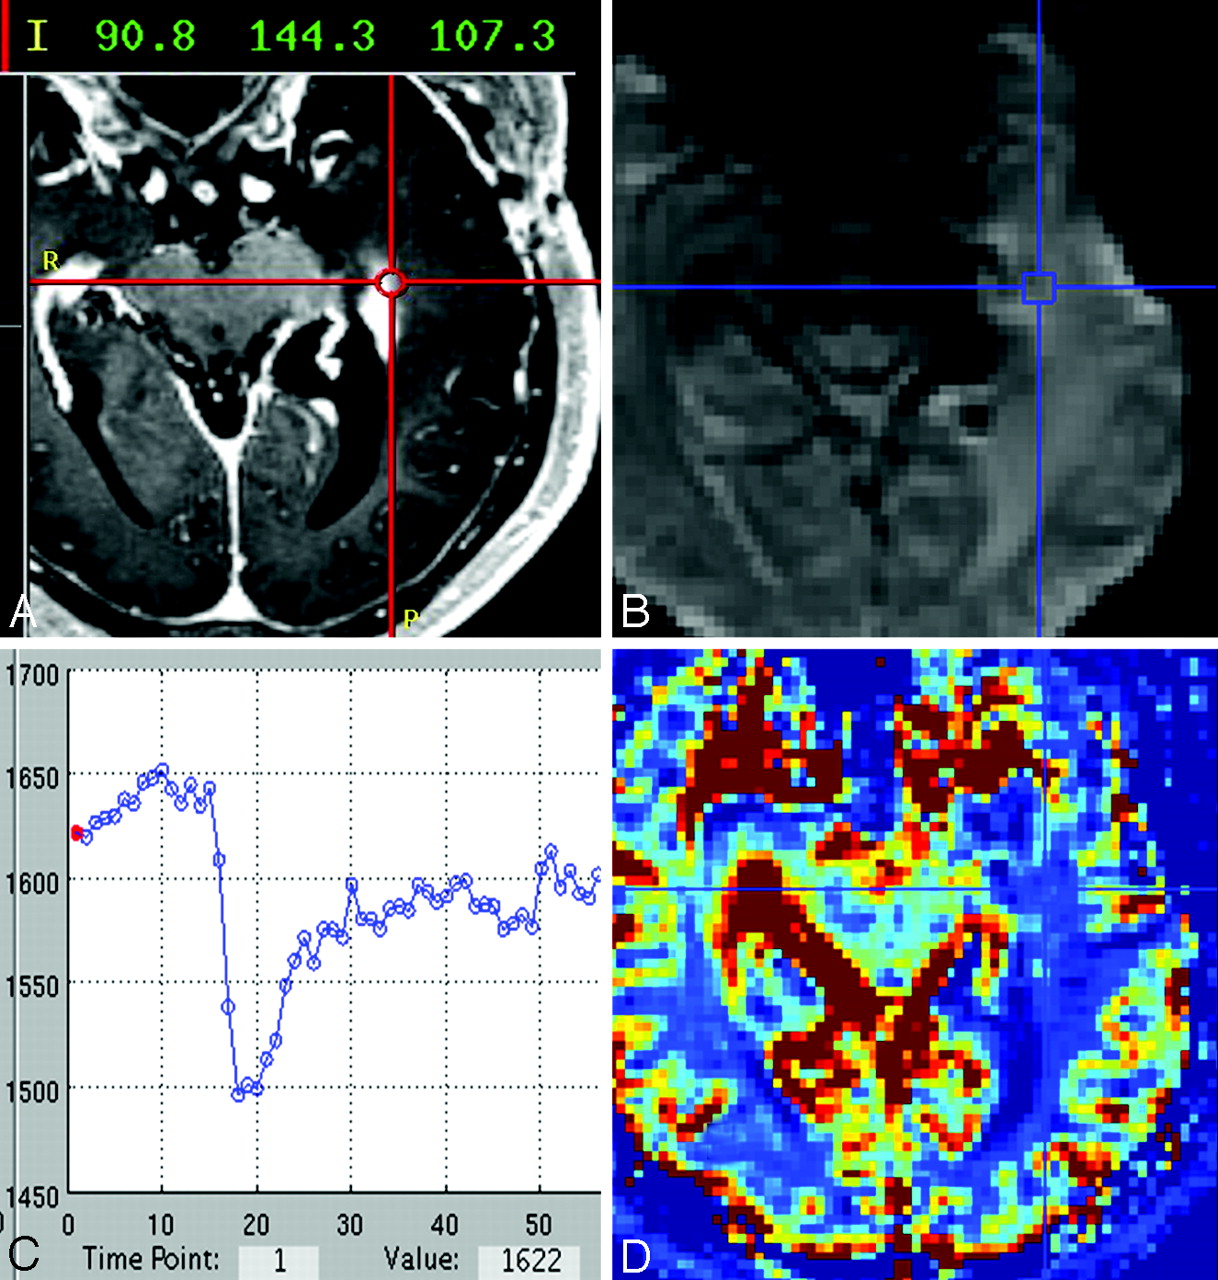
A, Representative case of a histologically diagnosed PTRE sample showing the neuronavigational screen-capture image with documentation of the surgical tissue specimen location (red target lines) and system coordinate points with left-anterior-superior reference origin. B−D, Image B shows the coregistered DSC source image with placement of a region of interest (blue target lines) at the specimen location with corresponding signal-intensity time course (C) and color rCBV map (D).
Coregistration of Stereotactic and DSC Image Datasets
Stereotactic MR imaging and DSC image datasets were transferred to an off-line Linux-based workstation for rigid body coregistration by using statistical parametric mapping (SPM5; Wellcome Department of Imaging Neuroscience, University College London, UK). A neuroradiologist (L.S.H.) visually validated all coregistration results to ensure accuracy. Coregistration of the DSC and stereotactic images enabled placement of DSC regions of interest specifically within the previously recorded stereotactic locations of corresponding surgical tissue specimens. All regions of interest were also inspected to ensure exclusion of visible vessels.
DSC Data Postprocessing and rCBV Calculation
DSC was analyzed by using an in-house Matlab-based MR Perfusion analysis program with postprocessing steps based on previously published methods.3,15
Conversion of Time-Series Data.
The first 3 data points for each time series were excluded to allow adequate tissue signal-intensity (SI) saturation. DSC SI time-series data for each voxel were normalized against the mean baseline value before the first-pass contrast bolus and converted to change in relaxivity with time [ΔR2*(t)] for the entire brain.
Calculation of CBV.
We generated whole-brain CBV maps by integrating the area under the ΔR2*(t) curve from start to end of the first-pass contrast bolus on a voxel-by-voxel basis, using the baseline subtraction method to correct for residual T2/T2*-weighted leakage effects,16 as demonstrated in Fig 3.

Demonstration of the CBV calculation method by integration from the start to end of the ΔR2*(t) curve first-pass bolus, using the baseline subtraction method for T2/T2*- weighted leakage correction.
CBV Normalization and rCBV Map Generation.
CBV maps were normalized to the average CBV from four 3 × 3 voxel regions of interest placed within normal-appearing gray matter (GM) and white matter (NAWM), contralateral to the enhancing lesion to generate whole-brain rCBV maps. Specifically, 2 regions of interest were placed within the putamen (each on consecutive sections), and 2 regions of interest were placed centrally within contralateral NAWM, 1 frontal and the other parietal. We developed this method of CBV normalization to allow representation of both GM and WM elements in producing rCBV maps, because ≤20% of gliomas involve GM.10,19 Selecting the putamen instead of cortical GM reduces partial volume effects from adjacent subcortical WM, CSF spaces, and cortical vessels. The putamen is also relatively easily identified on imaging.
rCBV Map Region-of-Interest Analysis.
We placed 3 × 3 voxel-sized (∼0.4 cm2) regions of interest centrally within the previously recorded stereotactic locations for each surgical tissue specimen. The 9 region-of-interest voxel values were averaged to yield a mean rCBV value and were correlated with corresponding specimen histopathology. DSC measurements were performed without knowledge of histopathology.
Tissue Histopathologic Diagnosis
All surgical tissue specimens were formalin-fixed, paraffin-embedded, sectioned, and hematoxylin-eosin−stained per standard diagnostic protocol at our institution. Each specimen was histopathologically categorized as either tumor or PTRE by 1 of 2 neuropathologists (S.W.C., J.M.E.), who were blinded to results of the DSC analysis. Diagnosis was based on the following established criteria: PTRE features included paucicellularity, lack of numerous atypical cells, lack of mitotic figures, and reactive cells, including gemistocytes. Necrosis, if present, involved parenchyma rather than cellular tumor. Tumor-recurrence features included sheets and/or nests of atypical cells often with mitotic figures. Necrosis involved cellular tumor rather than parenchyma. Samples containing a mixture of both tumor and PTRE were classified as tumor, regardless of the percentage of tumor bulk. Only samples with pure radiation change (in the absence of tumor criteria) were categorized as PTRE. The sole presence of a few isolated scattered atypical cells did not qualify as tumor categorization, as long as other neoplastic features were absent.
Statistical Analysis
Sensitivity, specificity, and 95% confidence intervals (95% CI) for distinguishing PTRE and tumor were generated at a number of rCBV cutoff points (Analyse-it Software, Leeds, England). These data were inspected to determine the optimal threshold value that maximized accuracy (defined as the average of sensitivity and specificity). A statistician (R.F.Y) supervised all analyses.
Results
Study Subjects, Tissue Specimens, and Histopathologic Analysis
A total of 43 tissue specimens was collected from the 13 subjects. On-line Table 1 summarizes the patient demographics, subtype, and grade of originally treated tumor, presence of steroid therapy, and type and timing of RT previous to imaging. All subjects had undergone previous surgical resection and combined chemotherapy and RT for their initial tumor treatment. The group mean (SD) of craniotomy diameters was 3.97 ± 1.71 cm. The average tissue-specimen volume was approximately 0.3 cm3. No adverse events were encountered from the contrast administration. Three (7%) of the 43 specimens were excluded from analysis because the corresponding DSC regions of interest demonstrated a significant degree of noise on time-series data, specifically during baseline measurements before arrival of the contrast bolus. This is a common artifact associated with the EPI technique and is often more prominent at higher field strengths. Of the remaining 40 tissue specimens, 16 were diagnosed as PTRE and 24 were diagnosed as tumor growth.
rCBV versus Histopathology
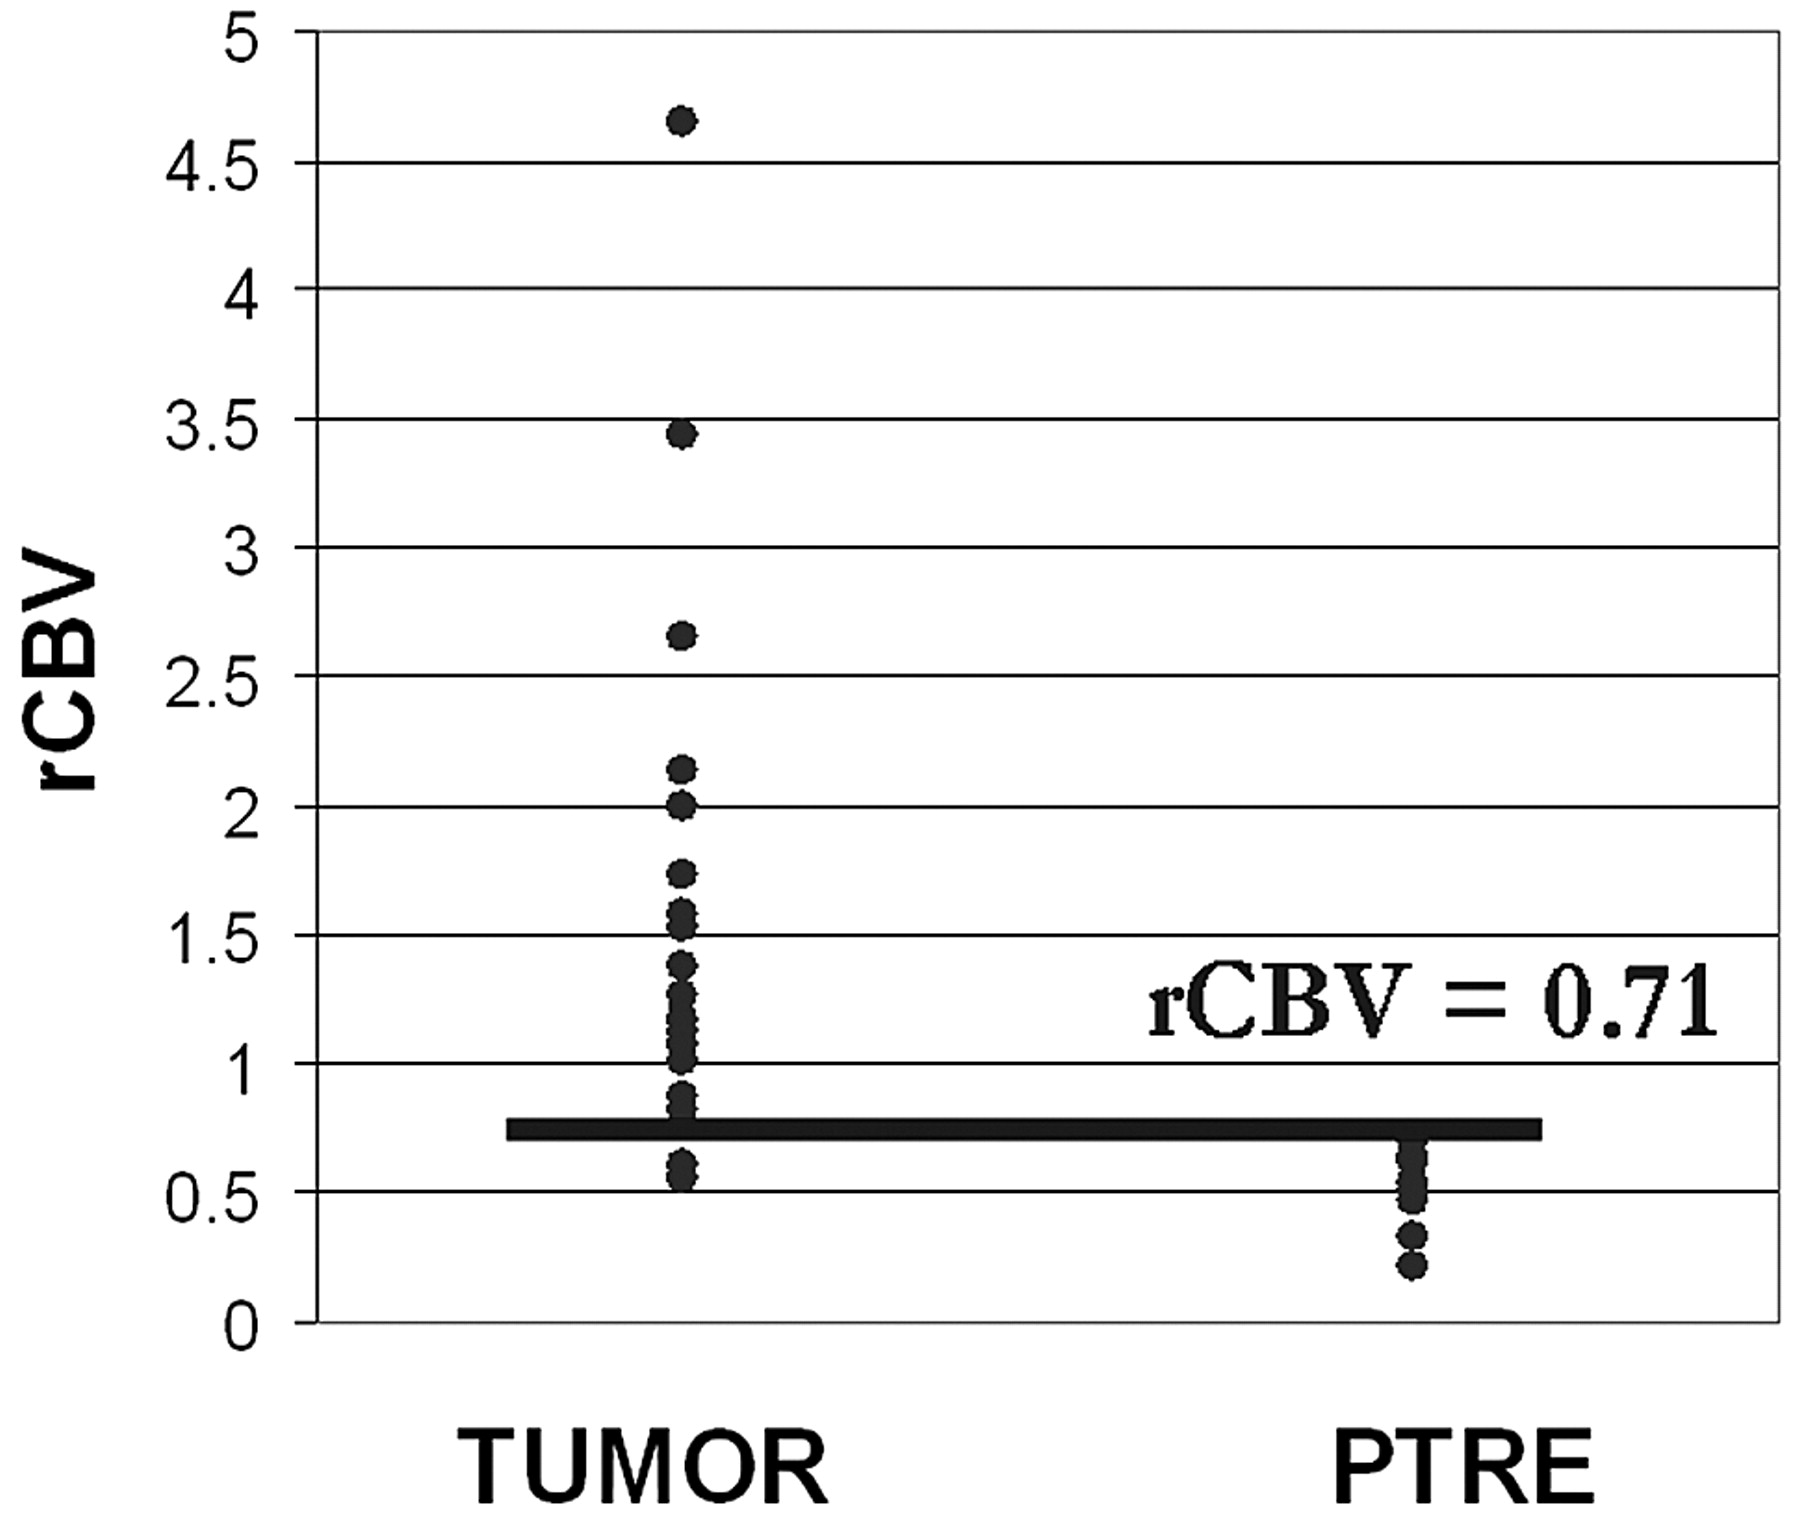
On-line Table 2 summarizes the histopathologic results and corresponding rCBV values for each tissue specimen. Of the 13 subjects, 3 (23.1%) had only PTRE specimens, 6 (46.1%) had only tumor specimens, and 4 (30.8%) had both types of specimens. PTRE group rCBV values ranged from 0.21 to 0.71; tumor values ranged from 0.55 to 4.64. There was a small degree of overlap between the groups. Two tumor-sample rCBV values (8.3%) fell within the PTRE group range.
Determination of an rCBV Threshold Value
A threshold between 0.71 and 0.756 maximized accuracy as determined by the average of specificity (100%) and sensitivity (91.7%). The upper and lower 95% CI values were 73% and 99% for sensitivity and 79.4% and 100% for specificity. We chose 0.71 as our rCBV cutoff value, though other values within the range 0.71–0.756 yielded identical accuracy. Thus, rCBV > 0.71 predicted tumor growth, whereas rCBV ≤ 0.71 predicted PTRE with approximately 95.9% accuracy (Fig 4).

Graphic distribution of rCBV values for tumor and PTRE groups with a threshold value of 0.71.
Discussion
Differentiating tumor growth from PTRE remains a common problem in clinical practice. Whole-brain DSC rCBV maps are typically generated with in-plane spatial resolution on the order of 1.8- to 2.5-mm voxel dimensions and approximately 0.02-cm3 voxel volumes at 3T. By applying accurate threshold rCBV values to differentiate tumor from PTRE, we can diagnose small isolated enhancing foci and identify histologically distinct subregions within large enhancing lesions. This has important diagnostic and prognostic implications because MR imaging lesions composed of predominantly tumor are often treated differently from predominantly PTRE lesions. This accurate noninvasive alternative to surgery avoids potential operative risks, morbidity, and sampling errors.
To date, to our knowledge, threshold rCBV values that accurately differentiate PTRE and tumor growth have not been reported. This study establishes threshold rCBV values to distinguish subregions of tumor and PTRE with approximately 92% sensitivity and 100% specificity. These values are specific to the data-acquisition parameters (ie, 3T field strength, pulse sequence, preload bolus dosing, and type and amount of contrast agent) and the chosen postprocessing methods. If different scanning and postprocessing techniques are used at other institutions, the threshold rCBV values for clinical use will require recalibration. Future clinical applications of these findings include 1) volumetrically quantifying the distinct subregions of large lesions to provide information about lesion heterogeneity and the amount of tumor bulk in relation to background PTRE, and 2) localizing isolated nests of tumor to guide stereotactic biopsy or selective radiation retreatment. Use of these applications warrants further clinical investigation to assess the potential impact on changes in treatment protocol and clinical prognosis.
Three of 43 (7%) DSC region-of-interest locations were excluded due to signal-intensity pileup artifacts and poor quality of time series near the skull base, adjacent to air-brain interfaces. Although the EPI technique is prone to these artifacts at higher field strengths, these could be minimized by manipulating technical parameters such as bandwidth or by using spin-echo techniques.
Although our data suggest a highly accurate test, a small number (8%) of tumor rCBV values overlapped with the PTRE group. Considering the study design and disease process, we believe that several factors warrant discussion as possible sources of error.
Accurate correlations between rCBV and histopathology depend in part on DSC methods. We addressed rCBV accuracy by correcting for both T1-weighted and T2/T2*-weighted errors. Published preload bolus amounts at 1.5T field strength ranged from 0.01 to 0.10 mmol/kg.12,15,17,20,21 Previous studies investigated the relationship between preload amount and T1-weighted leakage correction; however, the issue remains unresolved15,17,21 and is likely further confounded at higher field strengths. Because 3T DSC enables a smaller contrast bolus compared with 1.5T with similar data quality,22 we used a stepwise preload dosing protocol with half-dose incremental steps as part of a separate study to optimize T1-weighted leakage correction and minimize patient contrast load.18 The details of that study are beyond the scope of this article; in short, we determined an optimal protocol to be 0.1-mmol/kg Omniscan preload given 6 minutes before DSC acquisition. We administered the total preload dose via 2 separate injections but suspect that administering the total dose via a single injection 6 minutes before the DSC acquisition will yield comparable results. The baseline subtraction method of CBV integration corrected for T2/T2*-weighted effects.16 Finally, we generated rCBV maps by normalizing against an average of GM and WM. Other published normalizing methods include contralateral WM16,17 and homologous contralateral parenchyma,15 and a future formal comparison may be warranted to determine which methods provide the most accurate and reproducible correlation between rCBV and histopathology.
We used a binary system to categorize tissue samples as tumor or PTRE: Specimens containing any amount of tumor were categorized as tumor group, regardless of the degree of intermixed PTRE. The variable degrees of microscopic heterogeneity among tumor specimens likely contributed to the observed wide range of rCBV measurements.5–7,23,24 Reducing tissue-specimen size in future studies might help reduce histologic heterogeneity, though increasing DSC spatial resolution is limited by current EPI techniques. We conservatively chose 3 × 3 voxel regions of interest to optimize contrast to noise, roughly correlate with target tissue specimen volumes of 0.3 cm3, and help optimize localization of DSC measurements; however, we anticipate that voxel-by-voxel analysis of rCBV maps will still provide reliable measures for clinical use. Additionally, future studies that substratify the tumor-group samples on the basis of glioma grade and subtype and proportion of tumor growth to PTRE may reveal added diagnostic or prognostic information.
Tissue-specimen collection in this study followed open craniotomy, as opposed to stereotactic needle biopsy.25 Although estimated brain shifts that can influence image-guided localization following craniotomy might be more than expected with needle biopsy, the craniotomy sizes in this study were made as small as possible to minimize brain shift. Furthermore, craniotomies allowed the neurosurgeon to validate visually the stereotactic image location with intracranial neuroanatomic landmarks (ie, adjacent vascular structures, ventricle margins), which would not be possible with stereotactic needle biopsies. Most tissue samples were taken from enhancing edges, avoiding central necrotic fluid regions that might complicate accurate stereotactic localization. Stereotactic and DSC datasets were coregistered by using a rigid-body algorithm (SPM5), and the results were visually validated (L.S.H.) to ensure accuracy. Our experience suggests the misregistration error is similar to that in previous reports: ∼1–2 mm.25
Variable RT dose and delivery methods, chemotherapy, steroid therapy, and grade and subtype of primary HGGs may also contribute to our heterogeneous tumor rCBV values. Our study sample included subjects diagnosed with grade III (n = 4) and grade IV (n = 9) primary astrocytomas (n = 10), gangliogliomas (n = 2), and oligodendroglioma (n = 1). The 2 tumor-group specimens with rCBV values overlapping the PTRE group were from a subject with a grade III astrocytoma. If our analysis was limited to patients with primary grade IV glioblastoma multiforme (excluding all grade III primary tumors), there would be no overlap between tumor and PTRE group rCBV values. Our study compared rCBV measurements with histopathologic diagnosis. Future studies directly correlating rCBV values with MVD parameters in tumor and PTRE samples may clarify underlying pathophysiologic mechanisms of these diseases.
One of the largest studies evaluating rCBV values in post-treatment gliomas by Sugahara et al12 used primarily short-term imaging and clinical follow-up as diagnostic standards; however, this method is often inaccurate because PTRE can mimic tumor recurrence both clinically and radiologically. Both entities can increase in size and severity or remain stable over serial examinations.6 The radiologic distinction is further blurred because contrast-enhancing lesions are often histologically heterogeneous and composed of a mixture of the 2.1,2 In these cases, follow-up is a nonlocalizing method of validation. As a consequence, misdiagnosis likely degraded the study data of Sugahara et al and calls into question their conclusion that rCBV was nonspecific over a broad range of values. Our study suggests the opposite result. We demonstrated excellent rCBV separation between areas of tumor growth and PTRE. To date, we have not found reports of direct correlation between localized rCBV measurements and imaged-guided tissue analysis to address this clinical issue.
This study specifically addresses blood volume estimates by using the DSC technique. Vessel permeability is another vascular parameter that has been widely studied and may prove useful in differentiating PTRE and tumor. Both T1-weighted and T2*-weighted perfusion techniques can simultaneously estimate permeability and blood volume,26,27 though dual-echo techniques may provide further benefits in measurement accuracy.16,28 This is an area for potential future research.
Many groups have investigated MR spectroscopy and positron-emission tomography (PET) as techniques to distinguish tumor from PTRE. Multivoxel MR spectroscopy is technically more challenging than single-voxel techniques but provides better spatial resolution.29–33 Although reliable spectra can be achieved with voxel volumes as low as 0.9–1.0 cm3 at 1.5T29–31 and 0.7–1.0 cm3 at 3T,32,33 further improvements in voxel volumes and spatial resolution are probably necessary to overcome partial volume effects in histologically heterogeneous lesions. Current MR spectroscopy techniques cannot reliably distinguish subregions of admixture from pure PTRE or tumor.29,31,33 PET imaging has better spatial resolution (0.1–0.2 cm3) than MR spectroscopy.33,34 [18F]fluorodeoxyglucose has been the most widely studied agent, and initial reports suggested an ability to differentiate PTRE from tumor recurrence35,36; subsequent studies, however, suggest the accuracy is significantly lower than that in initial reports.37–39 Other PET tracers such as 13N-NH3, 11C-methionine, [18F]-FDOPA, and O-(2-[18F]-fluoroethyl)-L-tyrosine have shown promise in helping with the differential diagnosis,34,40–42 but these studies are limited by small sample numbers or lack of histopathologic confirmation.
Conclusions
We demonstrated the feasibility for direct correlation between image-guided tissue histopathology and localized DSC measurements. The rCBV measurements obtained by using our protocol differentiate high-grade glioma recurrence from PTRE with a high degree of accuracy.
Acknowledgments
We thank Mary Harrigan, Thomas Paine, Scott Beeman, and Brian Lenoski for their help on this project and Barrow Neurological Institute (BNI) Tumor Board for their advice on clinical applicability of this work. We also thank the BNI patients and their families for their enrollment and support in the project.
Footnotes
This work was funded in part by the Barrow Neurological Foundation, Phoenix, Ariz, the Bruce T. Halle Family Foundation, and the Arizona Biomedical Research Commission.
Awarded the Gabriel H. Wilson Award for best paper at: Annual Meeting of the Western Neuroradiological Society, October 4–7, 2007; Vancouver, British Columbia, Canada.
Paper previously presented at: Annual Meeting of the American Society of Neuroradiology, May 31–June 6, 2008; New Orleans, La.
indicates article with supplemental on-line tables.
References
- Received July 2, 2008.
- Accepted after revision September 25, 2008.
- Copyright © American Society of Neuroradiology
In this issue


Jump to section
Related Articles
Cited By...
- Identification of a Single-Dose, Low-Flip-Angle-Based CBV Threshold for Fractional Tumor Burden Mapping in Recurrent Glioblastoma
- Arterial Spin-Labeling and DSC Perfusion Metrics Improve Agreement in Neuroradiologists Clinical Interpretations of Posttreatment High-Grade Glioma Surveillance MR Imaging--An Institutional Experience
- Radiotherapy delays malignant transformation and prolongs survival in patients with IDH-mutant gliomas
- Volumetric Measurement of Relative CBV Using T1-Perfusion-Weighted MRI with High Temporal Resolution Compared with Traditional T2*-Perfusion-Weighted MRI in Postoperative Patients with High-Grade Gliomas
- Performance of Standardized Relative CBV for Quantifying Regional Histologic Tumor Burden in Recurrent High-Grade Glioma: Comparison against Normalized Relative CBV Using Image-Localized Stereotactic Biopsies
- Effects of Susceptibility Artifacts on Perfusion MRI in Patients with Primary Brain Tumor: A Comparison of Arterial Spin-Labeling versus DSC
- Response Assessment in Neuro-Oncology Criteria for Gliomas: Practical Approach Using Conventional and Advanced Techniques
- Perfusion MRI-Based Fractional Tumor Burden Differentiates between Tumor and Treatment Effect in Recurrent Glioblastomas and Informs Clinical Decision-Making
- Accurate Patient-Specific Machine Learning Models of Glioblastoma Invasion Using Transfer Learning
- Identifying Recurrent Malignant Glioma after Treatment Using Amide Proton Transfer-Weighted MR Imaging: A Validation Study with Image-Guided Stereotactic Biopsy
- Multisite Concordance of DSC-MRI Analysis for Brain Tumors: Results of a National Cancer Institute Quantitative Imaging Network Collaborative Project
- Optimization of DSC MRI Echo Times for CBV Measurements Using Error Analysis in a Pilot Study of High-Grade Gliomas
- Classification of High-Grade Glioma into Tumor and Nontumor Components Using Support Vector Machine
- Impact of Software Modeling on the Accuracy of Perfusion MRI in Glioma
- Repeatability of Standardized and Normalized Relative CBV in Patients with Newly Diagnosed Glioblastoma
- ASFNR Recommendations for Clinical Performance of MR Dynamic Susceptibility Contrast Perfusion Imaging of the Brain
- Diffusion and Perfusion MRI to Differentiate Treatment-Related Changes Including Pseudoprogression from Recurrent Tumors in High-Grade Gliomas with Histopathologic Evidence
- Dynamic Contrast-Enhanced Perfusion Processing for Neuroradiologists: Model-Dependent Analysis May Not Be Necessary for Determining Recurrent High-Grade Glioma versus Treatment Effect
- Histogram Analysis of Intravoxel Incoherent Motion for Differentiating Recurrent Tumor from Treatment Effect in Patients with Glioblastoma: Initial Clinical Experience
- Prediction of Pseudoprogression in Patients with Glioblastomas Using the Initial and Final Area Under the Curves Ratio Derived from Dynamic Contrast-Enhanced T1-Weighted Perfusion MR Imaging
- Accurate Differentiation of Recurrent Gliomas from Radiation Injury by Kinetic Analysis of {alpha}-11C-Methyl-L-Tryptophan PET
- The Role of Preload and Leakage Correction in Gadolinium-Based Cerebral Blood Volume Estimation Determined by Comparison with MION as a Criterion Standard
- Does MR Perfusion Imaging Impact Management Decisions for Patients with Brain Tumors? A Prospective Study
- Correlations between Perfusion MR Imaging Cerebral Blood Volume, Microvessel Quantification, and Clinical Outcome Using Stereotactic Analysis in Recurrent High-Grade Glioma
- Imaging biomarkers of angiogenesis and the microvascular environment in cerebral tumours
- Prospective Analysis of Parametric Response Map-Derived MRI Biomarkers: Identification of Early and Distinct Glioma Response Patterns Not Predicted by Standard Radiographic Assessment
- O-(2-18F-Fluoroethyl)-L-Tyrosine PET Predicts Failure of Antiangiogenic Treatment in Patients with Recurrent High-Grade Glioma
- Permeability Estimates in Histopathology-Proved Treatment-Induced Necrosis Using Perfusion CT: Can These Add to Other Perfusion Parameters in Differentiating from Recurrent/Progressive Tumors?
- Diagnostic Dilemma of Pseudoprogression in the Treatment of Newly Diagnosed Glioblastomas: The Role of Assessing Relative Cerebral Blood Flow Volume and Oxygen-6-Methylguanine-DNA Methyltransferase Promoter Methylation Status
- Optimized Preload Leakage-Correction Methods to Improve the Diagnostic Accuracy of Dynamic Susceptibility-Weighted Contrast-Enhanced Perfusion MR Imaging in Posttreatment Gliomas