
Abstract
BACKGROUND AND PURPOSE: Reliability of CT perfusion (CTP) algorithms has not been fully validated. We investigated whether the cerebral blood flow (CBF) values obtained by using a dynamic CTP technique with a tracer delay–insensitive deconvolution algorithm are more accurate than those obtained by using CTP with delay-sensitive algorithms in unilateral cerebrovascular steno-occlusive disease, when compared with those generated by quantitative single-photon emission CT (SPECT).
MATERIALS AND METHODS: Using CTP and iodine-123-N-isopropyl-p-iodoamphetamine SPECT with an autoradiographic quantification technique, we examined 20 patients with suggested hemodynamic ischemia due to stenosis or occlusion of the unilateral internal carotid or middle cerebral artery. The algorithms used for CTP included delay-insensitive block-circulant singular value decomposition (SVD) (bSVD) and delay-sensitive standard SVD (sSVD) and box-modulation transfer function (bMTF).
RESULTS: Absolute CBF values obtained by using CTP with bSVD were significantly lower than those obtained with SPECT, but the ratios to the nonaffected side were significantly correlated to the quantitative SPECT values with significant agreements, particularly when the arterial input function was obtained from the unaffected side. Contrastingly, CBF ratios with sSVD and bMTF were significantly underestimated, and no significant agreement was determined between CTP with sSVD or bMTF and SPECT, though there were substantial correlations between them in some parameters.
CONCLUSIONS: With the CTP technique, the insensitivity of the deconvolution algorithm to the tracer-delay effect appears to be essential for estimating semiquantitative CBF values in patients with unilateral steno-occlusive lesions.
The advent of multidetector-row CT (MDCT) has facilitated the use of the dynamic CT perfusion (CTP) technique to assess regional cerebral perfusion abnormalities in acute and chronic ischemias.1–3 Although CTP usually involves the use of deconvolution techniques that are identical to those applied in dynamic susceptibility contrast (DSC)-MR imaging, little attention has been paid to the validity of the deconvolution algorithms, which has been thoroughly investigated in DSC-MR imaging. Moreover, deconvolution algorithms that are insensitive to the delay of tracer arrival to the brain tissue are believed to be more accurate in DSC-MR imaging.4–6 To determine whether a delay-insensitive technique is appropriate even in CTP, we examined the correlation of cerebral blood flow (CBF) values generated by quantitative single-photon emission CT (SPECT) with the values obtained by using algorithms that are theoretically sensitive or insensitive to the tracer delay.
Materials and Methods
Patients
We prospectively examined 20 patients with symptomatic unilateral cerebrovascular steno-occlusive diseases with transient ischemic attack or minor stroke. The patients included 16 men and 4 women ranging from 50 to 76 years of age (mean, 66.0 years of age). Among them were 13 patients with internal carotid artery (ICA) stenosis >70% of the North American Symptomatic Carotid Endarterectomy Trial criteria (9 right-sided and 4 left-sided, 12 men and 1 woman, 53–72 years of age), 2 patients with ICA occlusion (2 right-sided, 1 man and 1 woman, 69–70 years of age), and 5 patients with middle cerebral artery (MCA) occlusion (4 right-sided and 1 left-sided, 3 men and 2 women, 50–76 years). All examinations were conducted after obtaining approval from the institutional review board and informed consent from the subjects. The intervals between the onset of the symptoms and CTP examination ranged from 3 to 14 days (mean, 5.8 days). The intervals between the CTP and SPECT examinations ranged from 2 to 7 days (mean, 4.2 days), and neurologic status had not changed during the intervals in all the patients.
CTP Study and Data Processing
CTP was performed by using a 16-row MDCT unit (Aquilion 16; Toshiba Medical Systems, Tokyo, Japan). A total of 40-mL nonionic iodine contrast material (Iopamiron 300; Bayer Schering Pharma, Berlin, Germany) was injected into the right antecubital vein by using a power injector at a flow rate of 4 mL/s. Five seconds after the injection, dynamic scanning was performed at the basal ganglia level by using the following parameters: 4 contiguous 8-mm-thick sections, 80 kVp, 40 mA, 1.5 s/rotation (60 mAs), and 30 rotations (total scanning time, 45 seconds). Radiation doses of the scanning protocol were as follows: volume CT dose index, 150 mGy; dose-length product, 480 mGy cm; and effective dose, 1.34 mSv.
Postprocessing of the acquired data was performed by using the CTP analysis software obtained from a commercial workstation (M900 Quadra; Ziosoft, Tokyo, Japan). In this software, 3 types of deconvolution algorithms were implemented. A region of interest of the arterial input function (AIF) was manually applied at single branch of the insular segment of the MCA at either the contralateral or the ipsilateral side of the affected hemisphere. A region of interest of the venous output function was also established on the superior sagittal sinus. The mean transit time (MTT) was obtained as a first moment of the residue function by using 3 types of deconvolution techniques: block-circulant singular value decomposition (SVD) (bSVD), which is theoretically delay insensitive6; standard SVD (sSVD), which is widely used and known as delay sensitive4–6; and box-modulation transfer function (bMTF),7 which is delay-sensitive and used in many institutions in Japan. The threshold of the bSVD and sSVD was set as 20%.
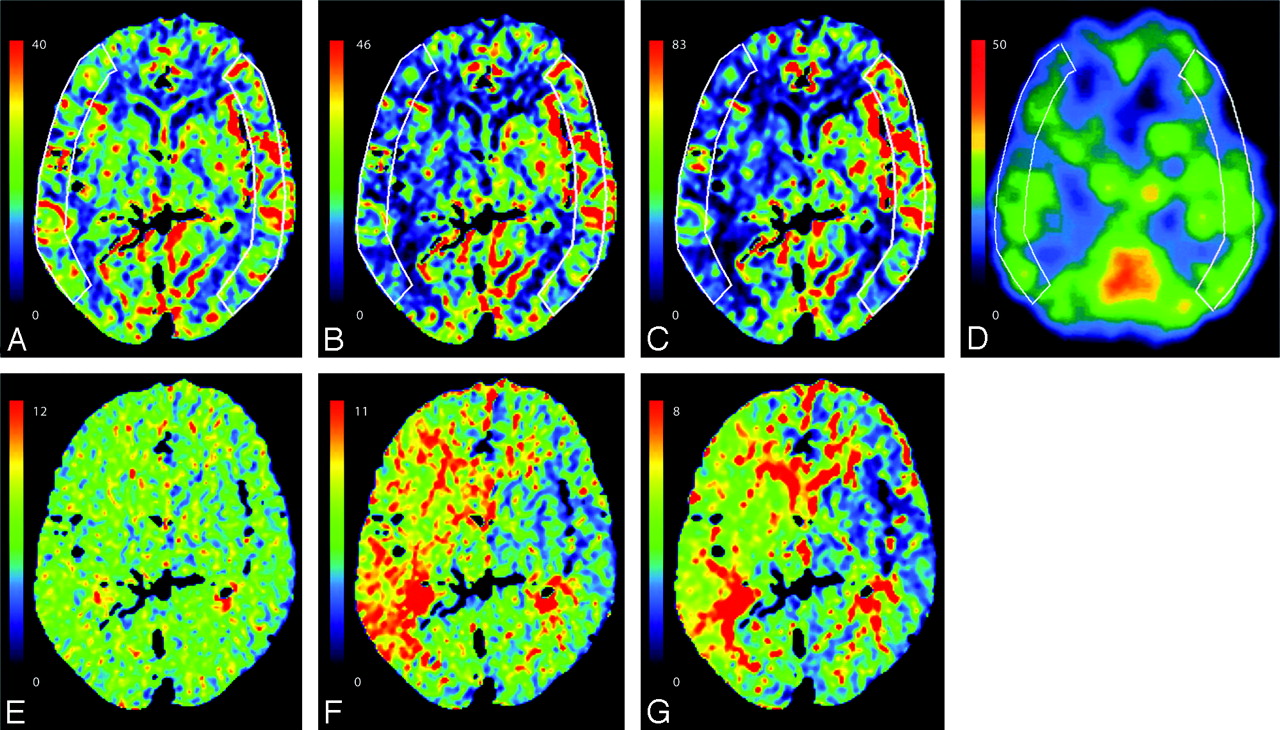
Cerebral blood volume (CBV) values were obtained by dividing the area under the curve of the brain tissue by the area under the curve of the venous output function after automatic pixel-by-pixel determination of the start point and discard of the second bolus. Subsequently, CBF values were calculated by dividing the CBV by the MTT, according to the central volume theorem.8 Vascular pixels were defined as those with CBV values >8 mL/100 mg and were automatically eliminated. CBF values of the bilateral cortical areas of MCA territories in the single section at the level of the basal ganglia and thalamus were measured by using a pair of line-symmetric polygon-shaped regions of interest obtained with cursor-driven manual tracing (Fig 1). Color maps were generated after determining the range of the color scale as follows: The maximum value of the range was set to twice the average pixel value of the entire unaffected hemisphere and the minimum value was set to zero.

CBF and MTT maps of a 70-year-old woman with occlusion of the right MCA. A and E, CTP with bSVD. B and F, CTP with sSVD. C and G, CTP with bMTF. D, Quantitative SPECT with 123I-IMP. A–D, CBF. E–G, MTT. AIF was obtained from the second portion of the left MCA. A–C, E–G, CBF and MTT color maps on CTP appear different among the different deconvolution algorithms. B–D, Images obtained by using sSVD (B) and bMTF (C) overestimate the decrease in CBF of the right MCA territory, compared with that generated by SPECT (D), whereas images using bSVD (A) correspond well with those using SPECT (D).
SPECT Study and Data Processing
Iodine-123-N-isopropyl-p-iodoamphetamine (123I-IMP) SPECT examination was conducted by using a ring-type scanner (Headtome-SET080, Shimadzu, Kyoto, Japan). During 20 minutes after the initiation of intravenous infusion of 123I-IMP (5 mL, 222 MBq) and subsequent saline infusion (5 mL) at a rate of 5 mL/min, data were acquired with a midscanning time of 30 minutes. At 10 minutes after the initiation of infusion, 2-mL arterial blood was drawn from the brachial artery. For quantitative analysis, radioactivity was measured by using an autoradiography model, as described previously.9 The CBF of the MCA cortical areas in the section corresponding to that of CTP was measured by using a polygon-shaped region of interest that was carefully drawn to imitate the corresponding region of interest on CTP (Fig 1). Obtained CBF values were calibrated to those equivalent to CBF values in positron-emission tomography (PET) by using the following equation: CBFPET = 2.04 * CBFSPECT − 12.26.9 Color maps were generated by using the same method as that used in CTP.
Statistical Analysis
The difference in quantitative CBF and semiquantitative CBF (a ratio of affected side to the healthy contralateral side) values was examined among bSVD, sSVD, bMTF, and SPECT by using a repeated measures analysis of variance (ANOVA) followed by the Tukey test. Correlations of these values between CTP and SPECT were examined by using linear regression analysis. Sensitivity and specificity of the semiquantitative CBF on CTP with respect to SPECT were calculated on a region-by-region basis when the cutoff line for the misery perfusion was set as <80% of the contralateral hemisphere, as applied for SPECT in the Japanese External Carotid-Internal Carotid Bypass Trial.10 Intermodality agreements were also examined by intraclass correlation coefficients (ICCs). The α level for all the analyses was 0.05.
Results
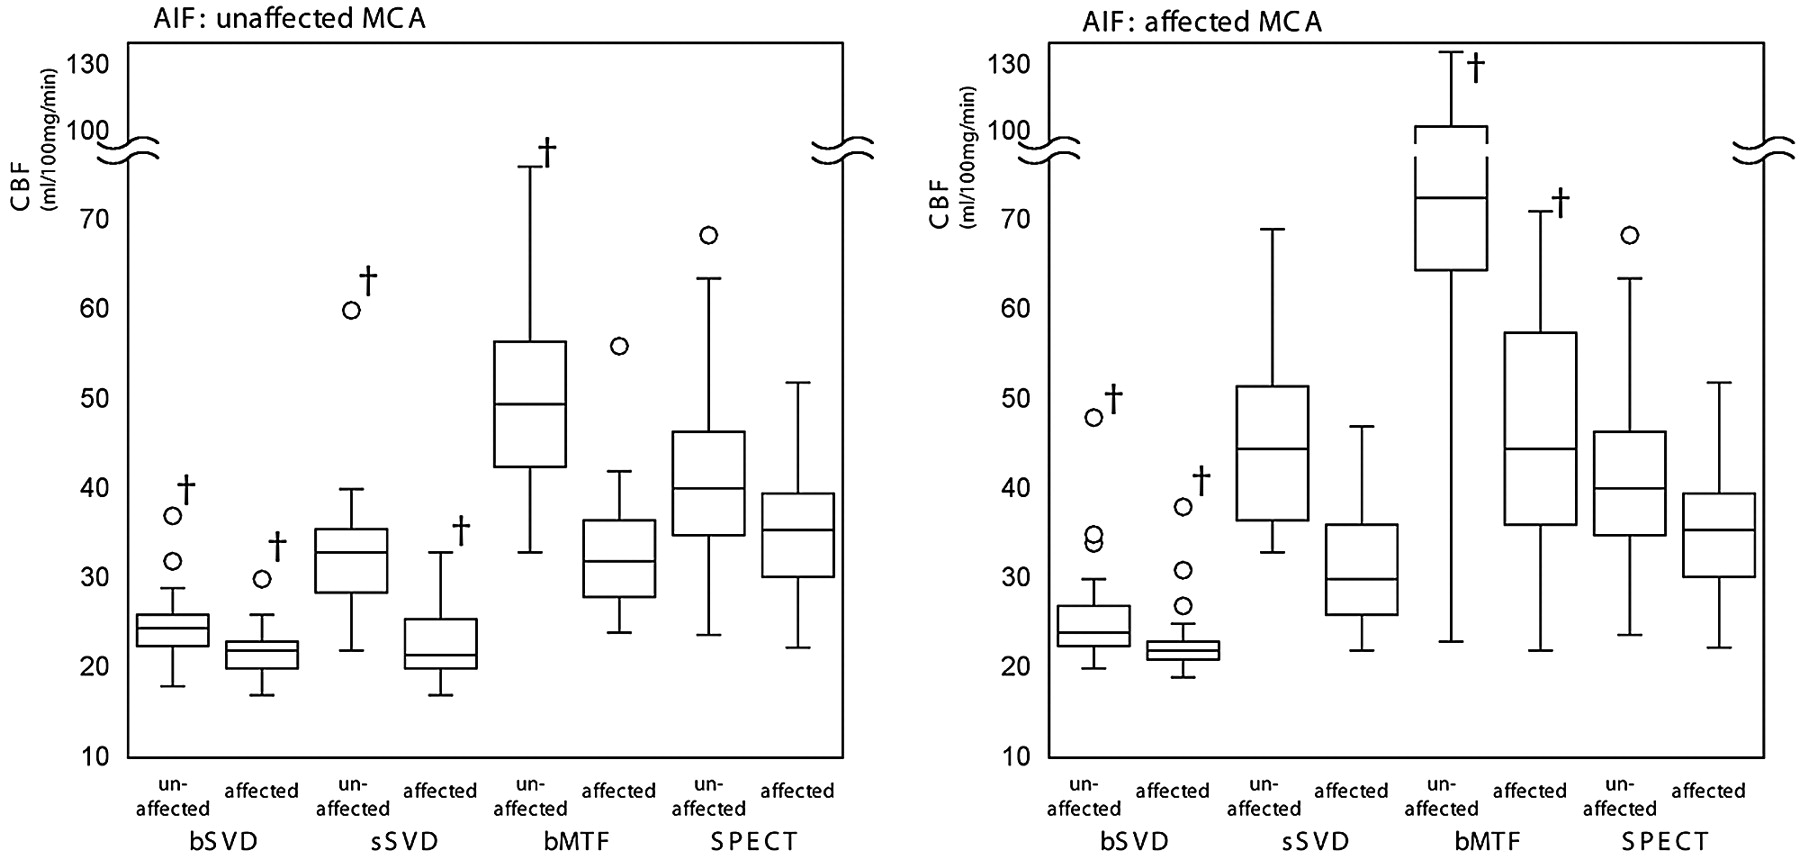
The absolute CBF values varied significantly among bSVD, sSVD, and bMTF, particularly when the AIF was obtained from the affected side (Figs 1 and 2). Differences in the CBF values were statistically significant among these algorithms (P < .01. repeated measures ANOVA with the Tukey test) except for those between bSVD and sSVD in the affected hemisphere (Fig 2). Among them, the CBF values obtained by using sSVD with the AIF from the affected side exhibited a good correspondence with the values generated by SPECT. However, the values obtained by using sSVD with the AIF from the unaffected side and those obtained by using bSVD in any condition were significantly lower than the values generated by SPECT (P < .01), whereas those obtained by using bMTF except in the affected hemisphere with the unaffected AIF were significantly greater than those obtained by using SPECT (P < .01) (Fig 2).

Absolute CBF values of the unaffected and affected MCA territories with different algorithms and different locations of AIFs. The ranges of the CBF obtained by bSVD in any conditions and those obtained by sSVD with the AIF on the unaffected MCA are significantly smaller than the corresponding ranges obtained by quantitative SPECT. However, those obtained by bMTF are significantly larger than those obtained by SPECT, particularly when the AIF is on the affected MCA. The CBF ranges obtained by sSVD with the AIF on the affected MCA are compatible with those generated by SPECT. †P < .01.
With regard to the correlation of the absolute CBF values between CTP and SPECT, the CBF values obtained by using the bSVD with the unaffected AIF (unaffected and affected hemispheres: r2 = 0.58 [P = .008] and 0.46 [P = .04], respectively; linear regression analysis) as well as those obtained by using the sSVD of the unaffected hemisphere (unaffected and affected AIFs: 0.52 [P = .02] and 0.46 [P = .04], respectively) correlated significantly to the SPECT values. Besides these combinations, no combination exhibited a statistically significant correlation (Table). Intertechnique agreements of the absolute CBF values between CTP and SPECT were found only when using sSVD (unaffected hemisphere with the affected AIF, 0.43 [P < .05], respectively; interclass correlation ICC) (Table).
Correlation of the CBF values between CTP and SPECT
Semiquantitative values (CBF ratios of the affected hemisphere to the corresponding unaffected hemisphere) obtained by using bSVD were significantly different from those obtained with sSVD or bMTF (P < .01, repeated measures ANOVA with the Tukey test) and corresponded to those generated by SPECT (Fig 3). The values obtained by using bSVD correlated significantly to those generated by SPECT (unaffected and affected AIF: r2 = 0.70 [P < .001] and 0.60 [P = .005], respectively), and the agreements between them were also substantially high (0.64 [P < .001] and 0.58 [P = .004], respectively; ICC). Correlations between sSVD or bMTF and SPECT were statistically significant only when the AIFs were obtained from the unaffected side (r2 = 0.50 [P = .02] and 0.57 [P = .008], respectively), but their ICCs were remarkably low (Table).

The CBF ratios of the affected MCA territory to the contralateral corresponding area with different algorithms and different locations of AIFs. When comparing the CBF ratios with SPECT, we observed that the CBF ratios were underestimated in many patients on CTP with sSVD and bMTF but not with bSVD, regardless of the location (affected or unaffected side) of the AIF on the MCA.
When the cutoff line of the semiquantitative CBF ratio for the misery perfusion was set as <80% of the contralateral hemisphere, the sensitivity and specificity of the CBF ratio in bSVD with respect to SPECT were relatively high, 75% and 100%, respectively, with the unaffected AIF, but 25% and 94%, respectively, with the affected AIF. In sSVD and bMTF, however, the specificities of this ratio were remarkably low, though the sensitivities were high: The sensitivity and specificity of the unaffected AIF were 100% and 31%, respectively, in sSVD and 100% and 13%, respectively, in bMTF. Those with the affected AIF were 100% and 38%, respectively, in sSVD and 75% and 19%, respectively, in bMTF (Fig 3).
Discussion
In this study, we successfully demonstrated that the semiquantitative CBF values obtained by using CTP with the bSVD algorithm, which is known as tracer delay–insensitive,6 correlated well with those generated by 123I-IMP SPECT with autoradiography quantification, particularly when the AIF was obtained from the second part of the MCA of the unaffected side. However, the CBF values obtained by using CTP with sSVD and bMTF varied significantly and were not consistent with the values generated by SPECT. Besides this study, to our knowledge, there were few investigations performing a comparison among the different deconvolution algorithms for CTP and elucidating the advantages of tracer delay–insensitive algorithms over other common algorithms. Nonetheless, several reports on DSC-MR imaging have stated that tracer-arrival delay can result in the overestimation of MTT prolongation and CBF reduction and that its compensation can correct this error.11–14
In the field of DSC-MR imaging, deconvolution algorithms for the intravascular tracer model have been thoroughly investigated. The sSVD technique is widely used for the quantitative evaluation of MTT and CBF; however, it is known to be susceptible to the delay in the arrival of contrast materials to the brain tissue, leading to a miscalculation of MTT and CBF.12,13 Algorithms that compensate for the delayed arrival time of the tracer12 and those that are inherently insensitive to tracer delay have already been proposed, such as bSVD6 and fast Fourier transform13 to overcome this issue.
On the other hand, few studies concerning CTP have focused on deconvolution algorithms.15,16 Although different algorithms are implemented in commercial software packages provided by CT and workstation vendors, to our knowledge, a direct comparison between algorithms or software packages has hardly been performed. Among these algorithms, sSVD is commonly used and bSVD, bMTF, and fast Fourier transform are used in a limited number of software packages. One of the vendors uses a maximum slope model16 instead of a deconvolution technique. The previously mentioned variety of analysis algorithms can result in considerable differences in the generated perfusion maps; however, this problem has not been investigated enough. Thus, we performed a direct comparison of 3 different algorithms by using otherwise identical parameters and by using a software program that is the commercial package available with both tracer delay–sensitive and tracer delay–insensitive algorithms.
It is generally believed that CTP has an advantage over DSC-MR imaging with respect to its 1) quantitativeness, due to the linear relationship between the concentration of the contrast agent and the CT value; and 2) the easy acquisition of AIF.15,16 However, we revealed that the absolute CBF values on CTP varied remarkably among algorithms and were significantly different from those generated by SPECT in patients with hemodynamic ischemia with unilateral steno-occlusive lesions. Previously, several studies have demonstrated a good correlation in CBF values between CTP and PET or Xenon CT. However, these studies included no subjects with hemodynamic ischemia in whom substantial tracer-arrival delay occurred.17,18 On the other hand, the ratios of the CBF in the affected hemisphere to the contralateral hemisphere correlated well with those generated by SPECT only when using bSVD, though its absolute values were apparently smaller than those generated by using sSVD, bMTF, and SPECT, presumably due to oscillations of the residue function caused by large image noises. Our results suggest that the accuracy of the semiquantitative CTP values in unilateral steno-occlusive conditions strongly depend on the deconvolution algorithms, particularly on the insensitivity to tracer-arrival delay.
The source of AIF is another important factor that influences CBF values obtained by using CTP. Although an AIF closest to the brain tissue is ideal, it cannot be distinctly obtained. Therefore, a surrogate AIF is usually measured at the intracranial major arteries such as the MCA. Its location (affected or unaffected side) can thus result in significant variation in CBF quantification, mainly with regard to tracer-arrival delay, bolus dispersion, and partial volume effects.11,19 In this study, the quantitative and semiquantitative CBF values generated by using the MCA ipsilateral to the affected hemisphere as the source of AIF were substantially different from those generated by using the contralateral MCA; this difference was observed particularly when tracer delay–sensitive sSVD and bMTF were used. The bSVD algorithm appears to afford relatively robust results regardless of the difference in AIF locations, but quantitative CBF values with the AIF from the affected side could not show a significant correlation with those generated by SPECT. We speculate that dispersion of the first bolus curve, partial volume effect of AIF, and/or image noise can deteriorate the accuracy of CBF values. A sophisticated technique for automatically obtaining an appropriate surrogate AIF is required to improve further reproducibility of the CTP results even when using bSVD.
One of the limitations of this study was that only a single software program was used for the evaluations and intervendor differences were not examined. The quantitative and semiquantitative CBF values may be different among different software packages, even when the same algorithm is implemented. Currently, we are investigating this issue by analyzing identical source data by using a number of commercial software packages. Another limitation of our study was that a few patients with severe ischemia were included. Only 4 of the 20 patients were reported to have <80% CBF ratio by SPECT. The calculated specificity and sensitivity of 3 algorithms against SPECT with the cutoff line of 80% included substantial statistical errors. The third limitation was that no acetazolamide challenge test was performed in CTP because of ethical issues. It has not been elucidated whether deconvolution algorithms affect the results of the acetazolamide challenge test, which estimates regional cerebrovascular reserve capacity in cases of hemodynamic ischemias.3 We speculated that the tracer delay–insensitive algorithm would be preferable because acetazolamide may affect the AIF and the time taken by the contrast medium to reach the brain tissue. Another limitation was that we only evaluated CBF values in the cortical areas of the MCA territory but did not assess differences in the volume showing CBF abnormalities among deconvolution techniques, which appear to be important clinically, because there were a few patients showing remarkable decrease in the CBF. Further investigation with a large number of patients with severe hemodynamic ischemia is needed to elucidate how the volume with CBF decrease varies among the algorithms.
In this study, CBF quantified not by PET but by the 123I-IMP autoradiography method by using SPECT was defined as the control, because the value obtained by this method significantly correlates with that obtained by the H215O PET method.9 In particular, the fit to the regression line of the 2 values is high in the hypoperfusion (lower than 35 mL · 100 mg−1 · min−1 on SPECT) areas.9 Although PET is widely used as a gold standard for quantitative CBF, we believe that the recent technical development in SPECT with regard to quantification enables its use as a gold standard.
Correlation coefficients of the CBF values between CTP and SPECT in this study were substantially low even when using the bSVD method. The low radiation dose that we applied might deteriorate accuracies during deconvolution processing, though deconvolution algorithms are said to be relatively robust to the image noise. Further optimization of the deconvolution algorithms can also improve the accuracy. The manual tracing method we used for quantitative measurement would cause some additional biases, so some sophisticated methods using coregistration techniques may improve the results.
CTP is widely applied for assessing not only chronic ischemia but also acute ischemic stroke. Previous studies concerning DSC-MR imaging have already revealed that tracer delay–sensitive algorithms tend to overestimate MTT prolongation and CBF reduction in patients with embolic occlusion of the major arteries.13,14 We believe that tracer delay–insensitive algorithms such as bSVD are much more appropriate for generating CTP maps that are used for assessing patients with acute stroke, including candidates for thrombolytic therapy. Evaluation of perfusion abnormalities may be crucial for expanding the time window of the thrombolytic therapy beyond 3 hours.20 The use of the deconvolution algorithm that is insensitive to the tracer-delay effect will facilitate the decrease in patient selection bias and will improve patient outcome.
Conclusions
We demonstrated that delay-sensitive deconvolution algorithms are inaccurate for evaluating CBF changes by using CTP and that the delay-insensitive algorithms are much more suitable for the purpose when semiquantitative ratios, not absolute values, are applied. The insensitivity to the delay of tracer arrival in CTP algorithms appears to be essential for reliable assessment of perfusion abnormalities in patients with unilateral steno-occlusive lesions.
Footnotes
This work was partly supported by the Research Grant for Cardiovascular Diseases (17C-3) from the Ministry of Health, Labor and Welfare and by the Grant-in-Aid for Advanced Science Research from the Ministry of Education, Culture, Sports, Science and Technology of Japan.
References
- Received November 19, 2007.
- Accepted after revision July 15, 2008.
- Copyright © American Society of Neuroradiology
In this issue


Jump to section
Related Articles
Cited By...
- Predicting Impaired Cerebrovascular Reactivity and Hyperperfusion Syndrome with BeamSAT MRI in Carotid Artery Stenosis
- CT Perfusion in Acute Lacunar Stroke: Detection Capabilities Based on Infarct Location
- Using Quantitative CT Perfusion for Evaluation of Delayed Cerebral Ischemia Following Aneurysmal Subarachnoid Hemorrhage
- CT Cerebral Blood Flow Maps Optimally Correlate With Admission Diffusion-Weighted Imaging in Acute Stroke but Thresholds Vary by Postprocessing Platform