
Abstract
BACKGROUND AND PURPOSE: The Alberta Stroke Program Early CT Score (ASPECTS) is a reliable method of delineating the extent of middle cerebral artery (MCA) stroke. Our aim was to retrospectively compare the accuracy of ASPECTS on noncontrast CT, CT angiography (CTA) source images, and CT perfusion maps of cerebral blood volume (CBV) during the first 3 hours of middle cerebral artery (MCA) stroke.
MATERIALS AND METHODS: First-time patients with MCA stroke who presented <3 hours from symptom onset and were evaluated by noncontrast CT/CTA/CT perfusion, had confirmed acute nonlacunar MCA infarct on diffusion-weighted MR imaging (DWI) within 7 days, and had follow-up angiography were included. Patients were excluded for persistent MCA occlusion or stenosis. Two raters through consensus assigned an ASPECTS on the noncontrast CT, CTA source images, and the section-selective (2 × 12 mm coverage) CT perfusion CBV maps. ASPECTS on follow-up DWI served as the reference standard. For each CT technique, the detection rates of regional infarction, the mean ASPECTS, and the linear correlation to final ASPECTS were determined and compared. P values <.05 were considered significant.
RESULTS: Twenty-eight patients satisfied the criteria with DWI performed at a mean of 50.3 hours (range, 22–125 hours) post-CT imaging. Of 280 ASPECTS regions, 100 were infarcted on DWI. The accuracy of noncontrast CT, CTA source images, and CT perfusion CBV for detecting regional infarct was 80.0%, 84.3%, and 96.8%, respectively (P < .0001). The mean ASPECTSs of noncontrast CT, CTA source images, CT perfusion CBV, and DWI were 8.4 ± 1.8, 8.0 ± 1.8, 6.8 ± 1.9, and 6.5 ± 1.8, respectively. The mean noncontrast CT and CTA source image ASPECTS was different from that of DWI (P < .05). Correlation of noncontrast CT, CTA source images, and CT perfusion CBV ASPECTS with final ASPECTS was r2 = 0.34, r2 = 0.42, and r2 = 0.91, respectively.
CONCLUSION: In a retrospective cohort of MCA infarcts imaged <3 hours from stroke onset, ASPECTS was most accurately determined on CT perfusion CBV maps.
The Alberta Stroke Program Early CT Score (ASPECTS) is a semiquantitative method of defining infarct extent in the middle cerebral artery (MCA) territory that is more reliable than the “1/3 MCA” rule1,2 and is highly predictive of outcome.3-6 ASPECTS was designed for conventional noncontrast CT, the ubiquitously performed imaging technique for triaging acute stroke. However, several recent studies have reported application of ASPECTS to CT angiography (CTA) source images7-9 and CT perfusion parametric color maps,10-12 with data to suggest that the acute ASPECTS is more accurately determined on these advanced CT techniques. Our aim was to retrospectively compare the accuracy and strength of the correlation of the acute ASPECTSs obtained on noncontrast CT, CTA source images, and CT perfusion mapping of cerebral blood volume (CBV) for nonlacunar MCA territory strokes imaged during the initial 3 hours of symptom onset. We hypothesized that with arterial recanalization, the CT perfusion CBV map is the best predictor of the final ASPECTS.
Methods
Patient Selection
Imaging and clinical data obtained as part of standard clinical stroke care at our institution were retrospectively reviewed. Approval for this study was obtained from the Institutional Board of Research Associates. A retrospective waiver of consent was obtained for review of all images and charts from our institutional review board.
In this retrospective analysis, subjects were selected from an ongoing data base of patients who presented to the emergency department of our institution and had confirmed first-time acute ischemic stroke from January 2004 to August 2007. Inclusion criteria were the following: 1) arrival <3 hours from onset of MCA stroke symptoms (hemiparesis, hemisensory loss, aphasia, etc), 2) baseline imaging evaluation with the noncontrast CT/CTA/CT perfusion protocol of our institution, 3) follow-up confirmation of nonlacunar (>15 mm in maximal dimension) MCA stroke by diffusion-weighted MR imaging (DWI) within 7 days of ictus, and 4) follow-up evaluation of arterial patency by CTA, MR angiography (MRA), or digital subtraction angiography (if the patient received intra-arterial therapy). Patients who satisfied these criteria were subsequently excluded for the following: 1) degradation of initial or follow-up imaging examinations by poor scan quality including severe motion artifacts, and 2) persistent MCA occlusion or stenosis on follow-up angiography.
CT and MR Imaging Acquisition
All noncontrast CT, CTA, and CT perfusion were performed on 16-section scanners (Sensation; Siemens, Erlangen, Germany). Noncontrast CT was performed with 5-mm contiguous axial sections from the vertex to the skull base by using imaging parameters of 120 kVp, 285 mAs, 1.5-mm section collimation, and 1.0-second rotation. CTA was performed from the aortic arch to the vertex after intravenous administration of 100 mL of nonionic iodinated contrast at 4 mL/s by a power injector into a 20-gauge or larger catheter at the antecubital vein (Omnipaque, 300 mg/mL; Amersham Health, Princeton, NJ). Bolus-tracking software was used to aid in the acquisition of images at maximal arterial enhancement. CTA imaging parameters were 120 kVp, 200 mAs, 1.0-mm section collimation, and 1.0-second rotation. CTA source images were reconstructed to 3 mm. CT perfusion was performed by using 2 contiguous 12-mm-thick axial sections, 1 through the basal ganglia/internal capsules and the other through the upper portion of the lateral ventricles. In ASPECTS topography, the MCA territory is divided into 10 regions (caudate, lentiform nucleus, internal capsule, insula, and M1-M6) at these 2 levels.1,2 A 60-second cine series was performed beginning 4 seconds after the intravenous administration of 50 mL of nonionic iodinated contrast at 5 mL/s by a power injector. CT perfusion imaging parameters were 80 kVp, 200 mAs, 0.5-second rotation, and 60 images per section.
All follow-up MR imaging examinations were performed on 1.5T systems (Vision or Symphony; Siemens). A localizing sagittal T1-weighted image was obtained followed by nonenhanced axial T1-weighted spin-echo (TR 600, TE 14 ms), axial fluid-attenuated inversion recovery (TR 9000, TE 110, TI 2500 ms), T2-weighted (TR 3400, TE 119 ms), and diffusion-weighted (TR 3400; TE 95 ms; b values of 0, 100, 1000 s/mm2) images by using 6 gradient directions. Concurrent MRA was performed by a 3D time-of-flight technique (TR 22–28 ms, TE 4–6 ms, flip angle of 20°).
Image Processing
Image postprocessing was performed by B.K.P. (with 5 years of experience in generating and interpreting CT perfusion). For this retrospective analysis, the dynamic CT perfusion source images were retrieved and loaded onto an off-line workstation (Advantage Workstation 4.0; GE Healthcare, Milwaukee, Wis) equipped with postprocessing software that generates color overlay maps of dynamic enhancement data (CT Perfusion 3.0; GE Healthcare). The CBV parameter was calculated as the integral of the tissue time attenuation curve divided by the integral of the normalized arterial input function and expressed in units of milliliters per 100 mg. The arterial and venous inputs were obtained from the anterior cerebral artery and superior sagittal sinus, respectively. CT perfusion CBV color maps were created following previously reported guidelines for the selection of pre- and postenhancement cutoffs.13 The scale was set at 0–8 mL/100 mg for all CT perfusion CBV maps, and 2 CT perfusion CBV maps were generated for each patient in the cohort.
The presentation noncontrast CT and CTA source images as well as the follow-up DWI (including apparent diffusion coefficient maps) were reloaded from the PACS of our institution onto an off-line workstation (Syngo/Leonardo Workstation; Siemens). Although the noncontrast CT, CTA source images, and CT perfusion all had the same patient positioning and head tilt angles, the DWIs were often different. With standard multiplanar reformatting tools, the DWIs were angled along the z-axis and rotated in the x-y plane to match the orientation and angling of the CT-based techniques. All CT perfusion CBV color maps and all images from the whole-brain datasets had patient identifiers removed and coded before being recorded on compact disks in 16-bit Digital Imaging and Communications in Medicine format. Each of the 3 CT-based techniques and the follow-up DWI datasets were recorded on separate sets of compact disks in randomized patient order.
Data Analyses
Two raters (K.L. and O.R., each with approximately 5 years of neuroimaging experience including interpretation of CT perfusion) loaded the images from the prepared compact disks onto a personal computer and accessed them by using internet-available image analysis software (ImageJ version 1.37; National Institutes of Health, Bethesda, Md). The raters were aware of the presence of acute nonlacunar MCA stroke but were blinded to clinical information, formally dictated reports, and follow-up imaging results. Each technique was evaluated separately during a readout session by the raters in consensus. Each of the 3 readout sessions was separated by 2 weeks of time to limit potential recall bias. CT perfusion CBV maps were reviewed first, followed by CTA source images, and finally noncontrast CT.
For the CT perfusion CBV maps, the raters visually evaluated each ASPECTS region for relatively low CBV compared with the mirror region in the contralateral hemisphere. For the whole-brain CTA source images and noncontrast CT datasets, the raters evaluated each ASPECTS region for parenchymal hypoattenuation,14,15 compared with the mirror region in the contralateral hemisphere. Adjustments in optimal window width and center level settings16 were used to maximize detection of subtle differences between normal and abnormal brain during the hyperacute stroke period. Two weeks after all CT-based data were assessed, the same raters loaded and reviewed the follow-up DWIs from the prepared compact disks. By consensus, the raters evaluated each ASPECTS region for DWI hyperintensity17 and associated restricted diffusion on the apparent diffusion coefficient maps. These abnormalities on DWI were recorded and served as the reference standard for regions of final infarct.
Statistical Analyses
Data from the evaluation of the noncontrast CT, CTA source images, and CT perfusion CBV color maps were compared with the follow-up DWI. To evaluate stroke extent on a per-region basis, we calculated the sensitivity, specificity, and accuracy of each technique and constructed their exact 95% confidence intervals (CIs) according to the Blyth-Still-Casella procedure. Two-sided P values from a binary logistic regression model for correlated data were obtained to compare sensitivity, specificity, and accuracy between techniques. In assigning an ASPECTS, a true-positive region of infarct was 1 point subtracted from the baseline score of 10. Repeated-measures analysis of variance followed by a Bonferroni multiple comparisons test was used to compare the mean ASPECTSs of all techniques. Linear regression coefficients were calculated to determine the degree of correlation between noncontrast CT, CTA source images, and CT perfusion CBV ASPECTS with DWI ASPECTS. Two-sided P values from a mixed regression model were obtained to compare these correlations. For all comparisons, a P value <.05 was considered significant. All statistical computations were performed by using Statistical Analysis Software (Version 9.0; SAS Institute, Cary, NC) and Prism (Version 5.01; GraphPad Software, San Diego, Calif).
Results
Twenty-eight patients satisfied the study criteria: 18 women and 10 men, with a median age of 70.4 years (range, 45–86 years) and a median National Institutes of Health Stroke Scale score of 15 (range, 4–28). Follow-up DWI was performed at a mean of 50.3 hours (range, 22–125 hours) after initial noncontrast CT/CTA/CT perfusion. There were no bilateral infarcts or additional acute infarct outside the MCA territory.
Of the 28 patients, 2 had distal internal carotid artery and M1 segment occlusions, 7 had M1 segment occlusions, 10 had M2 segment occlusions, and 9 did not have an occlusion proximal to the M3 segment. All patients with demonstrated arterial occlusion received emergent intravenous tissue plasminogen activator, with 8 receiving additional intra-arterial therapy (mechanical and/or chemical thrombolysis). For the 8 patients who received intra-arterial therapy, recanalization was documented on digital subtraction angiography at a mean of 3.2 hours (range, 1.0–5.0 hours) after initial noncontrast CT/CTA/CT perfusion. For the other 11 patients with arterial occlusion, recanalizations were documented on follow-up MRAs (performed concurrently with DWIs) at a mean of 30.3 hours (range, 22–52 hours) after initial noncontrast CT/CTA/CT perfusion. The 9 patients who did not have arterial occlusion proximal to M3 on baseline CTA or follow-up MRA, nevertheless, had infarcts in the M1 and/or M2 territories; thus, spontaneous recanalization of an occlusion was assumed before acute CT imaging.18
All 28 patients with nonlacunar MCA stroke had infarction involving at least 1 ASPECTS region on follow-up DWI. No regional infarction (ASPECTS, 10) was detected in 10 (35.7%) cases on noncontrast CT, 7 (25.0%) cases on CTA source images, and 2 (7.1%) cases on CT perfusion CBV maps. From a total of 280 possible ASPECTS regions, DWI revealed final infarct in 100 (35.7%) of them. On a per-region basis, the sensitivity, specificity, and accuracy and 95% CIs of the 3 CT-based techniques are summarized in Table 1. The CT perfusion CBV maps had significantly higher sensitivity (91.0%) compared with both noncontrast CT (44.0%, P < .0001) and CTA source images (57%, P < .0001). There was no difference in specificity between the 3 CT-based techniques (P ∼ 1.0). The CT perfusion CBV maps demonstrated significantly higher overall accuracy (96.8%) compared with both noncontrast CT (80.0%, P < .0001) and CTA source images (84.3%, P < .0001). CTA source images showed a trend toward higher sensitivity (P = .0668) compared with noncontrast CT, but no difference was detected in overall accuracy (P = .186).
Sensitivity, specificity, and accuracy of detecting ASPECTS regional infarctions <3 hours old (n = 280) with a follow-up DWI reference standard*
Fifteen (25.9%) of the 58 false-negative regions on noncontrast CT were true-positive infarcts on CTA source images, whereas 49 (84.5%) of them were true-positive infarcts on CT perfusion CBV maps. Thirty-four (79.1%) of the 43 false-negative regions on CTA source images were true-positive infarcts on CT perfusion CBV maps. Conversely, no false-negative region on CT perfusion CBV maps was abnormal on CTA source images or noncontrast CT, and no false-negative region on CTA source images was abnormal on noncontrast CT. There was a single false-positive region on CTA source images, but no false-positive regions on noncontrast CT or CT perfusion CBV were identified.
The means of the acute ASPECTSs on noncontrast CT, CTA source images, and CT perfusion CBV were 8.4 ± 1.8, 8.0 ± 1.8, and 6.8 ± 1.9, respectively. The mean of the follow-up DWI ASPECTSs was 6.5 ± 1.8. The mean ASPECTSs of all techniques were compared and summarized in Table 2. There was a significant difference in the mean ASPECTSs between CT perfusion CBV maps versus noncontrast CT and between CT perfusion CBV maps versus CTA source images but not between noncontrast CT versus CTA source images. In comparison with the mean DWI ASPECTS, only the mean score from CT perfusion CBV maps was not significantly different. See Fig 1 for an example of the CT-based techniques and follow-up DWI of 1 of the patients in this cohort.

A 62-year-old man imaged <3 hours after sudden onset of right hemiparesis. From left to right, baseline noncontrast CT (NCCT), CTA source images (CTA-SI), CT perfusion CBV color maps (CT-CBV), and follow-up DWI. Noncontrast CT, by using a window center of 35 HU and a width of 15 HU to visualize optimally the gray-white interface, fails to demonstrate a focal region of parenchymal hypoattenuation, yielding an ASPECTS of 10. CTA source images reveal a focal hypoattenuation at the caudate nucleus consistent with acute infarction, yielding an ASPECTS of 9. CT perfusion CBV map shows relative hypoperfusion in the caudate nucleus as well as at the anterior inferior frontal lobe (M1) and anterior superior frontal lobe (M4), yielding an ASPECTS of 7. Follow-up DWI at 37 hours post-CT imaging confirms acute infarctions in the caudate nucleus, M1, and M4, yielding a final ASPECTS of 7.
Comparison of mean NCCT, CTA-SI, CT-CBV, and follow-up DWI ASPECTS (repeated measures ANOVA with the Bonferroni multiple comparisons test)*
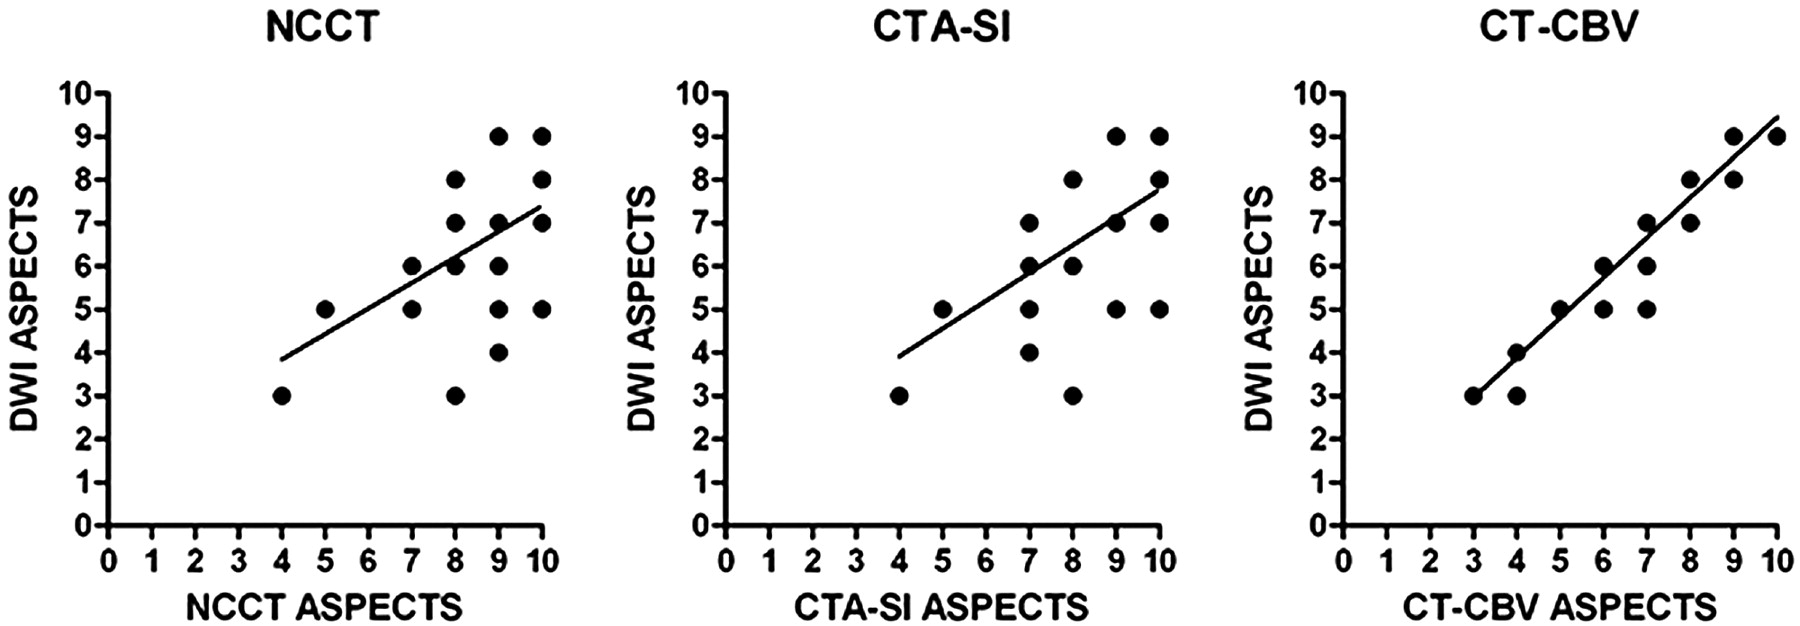
Linear regression analysis revealed r2 = 0.34 (P = .0011), r2 = 0.42 (P = .0002), and r2 = 0.91 (P < .0001) for correlations between the acute noncontrast CT, CTA source images, and CT perfusion CBV ASPECTSs and the follow-up DWI ASPECTSs, respectively (Fig 2). The CT perfusion CBV ASPECTSs were more strongly correlated with DWI ASPECTSs than were noncontrast CT (P = .0277) or CTA source image (P = .0379) scores. There was no significant difference in correlation strengths between the acute noncontrast CT and CTA source image ASPECTSs with the final DWI score (P = .535).

Plots of linear regression between noncontrast CT (NCCT) ASPECTS (r2 = 0.34, P = .0011), CTA source images (CTA-SI) ASPECTS (r2 = 0.42, P = .0002), and CT perfusion CBV (CT-CBV) ASPECTS (r2 = 0.91, P < .0001), with follow-up DWI ASPECTS.
Final DWI ASPECTSs were predicted by noncontrast CT in 6 (21.4%), CTA source images in 10 (35.7%), and CT perfusion CBV maps in 20 (71.4%) cases. In no case did an acute ASPECTS underestimate the follow-up score (overestimate infarct extent). Dichotomizing ASPECTS at 7 and classifying each case as having “small” (>7) or “large” infarct (≤7) extent, we found that 19 (67.9%) cases showed large infarct extent on final DWI. Noncontrast CT, CTA source images, and CT perfusion CBV maps correctly predicted large infarct extent in 6 (31.6%), 10 (52.6%), and 18 (94.7%) cases, respectively. CT perfusion CBV maps upgraded the classification of infarct extent in 12 cases on noncontrast CT and 8 cases on CTA source images. All CT-based techniques correctly predicted all 9 cases of small infarct extent on final DWI.
Discussion
We retrospectively compared the acute ASPECTSs on noncontrast CT, CTA source images, and CT perfusion CBV maps from a cohort of confirmed nonlacunar MCA strokes imaged within 3 hours of symptom onset that had angiographic proof of recanalization. There is no prior study, to our knowledge, that has evaluated the accuracy of ASPECTS on all 3 techniques during this early period of hyperacute stroke. Our results confirm the generally accepted notion that in acute cerebral ischemia, regions of hypoattenuation on noncontrast CT and CTA source images and hypoperfusion on CT perfusion CBV maps represent unsalvageable tissue despite reperfusion.19,20 However, in the 3-hour window, CBV appears to be a significantly more sensitive and accurate marker for irreversible ischemic damage. We compared the mean ASPECTS of each CT-based technique and found no difference between the scores on noncontrast CT and CTA source images, but both were different from scores on CT perfusion CBV maps. Compared with the mean ASPECTS on follow-up DWI, there was no detectable difference with the mean score on CT perfusion CBV maps, but the scores on both noncontrast CT and CTA source images were different. To evaluate further the relationship between the acute and final ASPECTSs, we used linear regression analysis to determine the strength of the correlation and found that although all 3 CT-based techniques showed significant correlation to the final ASPECTSs, those on CT perfusion CBV maps were the ones most strongly correlated.
The finding of more accurate ASPECTSs on CT perfusion CBV maps versus noncontrast CT and CTA source images is consistent with the results of the only other report in which ASPECTS was examined on all 3 CT-based techniques in parallel. Parsons et al10 reported similar findings in a prospective subcohort of 20 patients with MCA stroke, imaged within 6 hours of symptom onset, who achieved major reperfusion. We were particularly interested in the comparison of ASPECTS between CT perfusion CBV maps and CTA source images because both techniques have been shown to provide benefit over noncontrast CT.7-11 We believe that CT perfusion CBV maps outperformed CTA source images in this study because of the inherent technical difference in determining blood volume between the 2 techniques. CTA source images provide an estimate of CBV by revealing regions of decreased enhancement but do so in a single “snapshot” during peak contrast enhancement. Most dynamic CT perfusion protocols, on the other hand, acquire at least 45 samplings of a preselected tissue section through the entire first-pass circulation of contrast. Therefore, CTA source images are unlikely to be as sensitive as CT perfusion for detecting small CBV changes, which can be critical if either the absolute or relative value approaches viability thresholds.20,21 CTA source images have the advantage of not requiring image postprocessing and of providing whole-brain coverage. Most interesting, the latter provided no added benefit in determining ASPECTSs compared with the scores obtained from CT perfusion. ASPECTS is easily adoptable by CT perfusion if the appropriate axial levels are preselected for dynamic acquisition. In contrast, given the current limitations of CT perfusion in spatial coverage, it is conceivably less reliable to apply the 1/3 MCA rule to its parametric maps to define infarct extent.
One previous study by Coutts et al7 showed increased accuracy of ASPECTS when determined on CTA source images compared with noncontrast CT within the first 3 hours of stroke symptom onset. In our comparison of the 2 techniques, we did not detect a significant difference in their mean ASPECTSs or their correlations to the final score. We speculate on several possible explanations. One is that our readouts occurred in the sequence of CT perfusion CBV maps, CTA source images, and then noncontrast CT. This sequence of review was by design to prevent any possibility of recall bias favoring CT perfusion CBV maps, the technique we hypothesized to be most accurate for delineating infarct extent by using ASPECTS. In doing so however, we cannot exclude the possibility that recall bias may have inadvertently increased the accuracy of noncontrast CT and confounded the comparison between it and CTA source images. Another possibility for our inability to detect the added value of CTA source images over noncontrast CT is the small sample size of the cohort. With just 28 patients, CTA source images were, in fact, showing a trend toward significantly increased sensitivity for regional infarction (57% versus 44%, P = .0668) over noncontrast CT. Also, after dichotomizing ASPECTS by using the traditional cut-point of ≤7, CTA source images showed fewer errors in predicting “large” infarct extent compared with noncontrast CT.
There are other limitations to consider in this study. By examining a retrospective cohort of known MCA strokes, we inevitably introduced a selection bias for increased accuracy of regional infarct detection across all techniques. We do not imply that the sensitivities and accuracies reported in Table 1 should be expected on a prospective cohort of community patients presenting to the emergency department with strokelike symptoms. Indeed, the aim of this study was not to evaluate the accuracy of acute stroke detection by CT-based techniques but to compare the relative accuracy of ASPECTS for each technique. Such an analysis requires a cohort with a high prevalence of regions of infarct (in this case 100/280, 35.7%), which was obtained by examining a group of patients with known nonlacunar MCA strokes and variably sized final infarcts (median DWI ASPECTS of 6, range 3–9).
We used the follow-up DWI ASPECTSs as the radiologic outcome variable, but we did not have access to clinical outcome data, such as the often-reported 90-day modified Rankin scale (mRS). Despite the lack of clinical outcome data, we believe our results are clinically relevant because previous studies have repeatedly shown that improving the accuracy of the acute ASPECTS allows it to be a better predictor of functional outcome.7,8,10,11 The lack of follow-up data on functional independence prevented us from deriving the optimal ASPECTS cut-point for each technique that best predicts favorable outcome. We cautiously used the traditional cut-point of ≤7 in a brief subanalysis of our main results, but this may not be optimal for CT perfusion CBV maps. Parsons et al10 and, more recently, Kloska et al12 demonstrated better predictability of 90-day mRS with a cut-point of ≤6, whereas Aviv et al11 recently reported an optimal cut-point of ≤8. The latter study had a lack of direct recanalization data and a small sample size (only 7 patients had evidence of reperfusion). Clearly further investigations with large prospective cohorts are needed to select the optimal ASPECTS threshold for use in CT perfusion. Most interesting, this remains a controversial issue even on noncontrast CT.
Examining ASPECTS in large randomized trials has already revealed some evidence that dichotomizing ASPECTS to select a cut-point may not be as valuable as once thought. A retrospective analysis22 of 825 patients in the Canadian Alteplase for Stroke Effectiveness Study showed a moderate increase in risk (odds ratio, 1.63) of poor outcome for ASPECTS ≤7, whereas there was a continuous linear relationship between functional outcome and ASPECTS from 6 to 10. It is also doubtful that ASPECTS ≤7 is interchangeable with >1/3 of the MCA territory. A volumetric analysis of the ASPECTS template by Phan et al23 showed that an ASPECTS of 7 equates to approximately 14%–21% of the MCA territory. Supporting this result is a retrospective analysis4 of 788 patients from the European-Australian Acute Stroke Study II trial, which revealed that at least a quarter of infarcts considered <1/3 of the MCA territory had ASPECTS ≤6.
There are other points in the design of our study that are worth considering. The raters were instructed to consider only regions of relatively decreased CBV. Reassessment of the raw data showed that of the 9 false-negative regions on CT perfusion CBV maps, 4 displayed relative increase in CBV that is characteristic of penumbral tissue. In a small series of patients with acute stroke treated with intra-arterial therapy, Schaefer et al20 reported that regions with high CBV can have variable outcomes despite prompt recanalization and reperfusion. Thus, we believe our initial assumption to consider only a region with low CBV was valid. Similarly, a recommendation14,15 was recently put forth to consider only a region of hypoattenuation (infarct core) and not focal cortical swelling (likely penumbra) in the scoring of ASPECTS on noncontrast CT (a recommendation that was adopted in this study).
All images in the noncontrast CT and CTA source image datasets were available to the raters (instead of just selected sections corresponding to the 2 levels of the CT perfusion) because we wanted to simulate the emergency setting whereby the entire brain is evaluated. Furthermore, since gyri can curve in and out of the axial imaging plane, the ability to evaluate multiple sections helps to prevent the erroneous rating of cortical hypoattenuation secondary to partial volume effects. Despite access to all images from the vertex to the skull base and the use of adjustable window width and center level settings, noncontrast CT was 47% and CTA source images were 34% less sensitive than CT perfusion CBV maps for regional infarct detection during the 3-hour window, which reduced their ability to delineate the full infarct extent.
Conclusion
In a retrospective cohort of nonlacunar MCA strokes with evidence for complete arterial recanalization, the delineation of final infarct extent by using ASPECTS was more accurate on CT perfusion CBV maps than on CTA source images or noncontrast CT. It remains to be determined whether early ischemic changes, ASPECTS, and/or CT perfusion should be used in the initial 3-hour window to select patients for thrombolysis.
References
- Received June 28, 2007.
- Accepted after revision December 10, 2007.
- Copyright © American Society of Neuroradiology
In this issue


Jump to section
Related Articles
Cited By...
- CT perfusion and angiographic assessment of pial collateral reperfusion in acute ischemic stroke: the CAPRI study
- Automated CT Perfusion Ischemic Core Volume and Noncontrast CT ASPECTS (Alberta Stroke Program Early CT Score): Correlation and Clinical Outcome Prediction in Large Vessel Stroke
- Performance of CT ASPECTS and Collateral Score in Risk Stratification: Can Target Perfusion Profiles Be Predicted without Perfusion Imaging?
- Dynamic Angiography and Perfusion Imaging Using Flat Detector CT in the Angiography Suite: A Pilot Study in Patients with Acute Middle Cerebral Artery Occlusions
- Impact of the ASPECT scores and distribution on outcome among patients undergoing thrombectomy for acute ischemic stroke
- Computed Tomographic Angiography and Cerebral Blood Volume Can Predict Final Infarct Volume and Outcome After Recanalization
- Length of Occlusion Predicts Recanalization and Outcome After Intravenous Thrombolysis in Middle Cerebral Artery Stroke
- Alberta Stroke Program Early CT Scale Evaluation of Multimodal Computed Tomography in Predicting Clinical Outcomes of Stroke Patients Treated With Aspiration Thrombectomy
- Pre-intervention cerebral blood volume predicts outcomes in patients undergoing endovascular therapy for acute ischemic stroke
- Computed Tomography Angiography in Hyperacute Ischemic Stroke: Prognostic Implications and Role in Decision-Making
- Guidelines for the Early Management of Patients With Acute Ischemic Stroke: A Guideline for Healthcare Professionals From the American Heart Association/American Stroke Association
- Location of the Clot and Outcome of Perfusion Defects in Acute Anterior Circulation Stroke Treated with Intravenous Thrombolysis
- Interobserver Agreement of ASPECT Score Distribution for Noncontrast CT, CT Angiography, and CT Perfusion in Acute Stroke
- Dramatically Reducing Imaging-to-Recanalization Time in Acute Ischemic Stroke: Making Choices
- Stroke and CT Perfusion
- CT Angiographic Source Images: Flow- or Volume-Weighted?
- Evaluation of CT Perfusion in the Setting of Cerebral Ischemia: Patterns and Pitfalls
- Optimal Brain Perfusion CT Coverage in Patients with Acute Middle Cerebral Artery Stroke
- Identification of Infarct Core and Penumbra in Acute Stroke Using CT Perfusion Source Images
- Advances in Interventional Neuroradiology